
Fact Sheets Merge
Vanguard®
Australian Shares
Index ETF
ETF
VAS
ASX Code: VAS
At a glance
Features, benefits & risks
As at 31 December 2014
Diversification
Invests in around 300 of the largest Australian
companies and property trusts listed on ASX.
Tax-effective
returns
A buy and hold approach takes advantage of
capital gains discounts and the deferral of capital
gains liabilities, which may result in effective
after-tax returns.
Capital growth
potential and taxeffective income
Includes exposure to companies offering franking
benefits that can offset income tax quarterly
distributions and offers long-term capital growth
potential through its diversified portfolio of
Australian shares.
Risks
High - the potential for higher returns than lower
risks investments, however there is the higher
potential for below-average returns and/or some
loss of capital. Please see Product Disclosure
Statement for further details.
ETF name
ASX code
ISIN
Benchmark
Management costs
Distribution frequency
®
Vanguard Australian Shares Index ETF
VAS
AU000000VAS1
S&P/ASX 300 Index
0.15% p.a.
Quarterly
Distribution reinvestment plan
ETF listed on ASX
Underlying fund
Underlying fund
commencement date
Yes
8 May 2009
Vanguard ® Australian Shares Index Fund
30 June 1997
Objective
The fund seeks to track the return (income and capital appreciation) of the S&P/ASX
300 Index before fees, expenses & tax.
Strategy
The fund is managed to closely track the risk characteristics of the index, while
minimising transaction costs and effectively managing index changes. Through a buy
and hold investment strategy the fund offers a tax-efficient solution for investors
seeking to gain broad exposure to the Australian share market at low cost.
Vanguard ETF Product Profile
®
Vanguard Australian Shares Index ETF
Dated 31 December 2014
Holdings6
Overview
Size (AUD)
Inception date
Management costs
No. of securities
Benchmark
Underlying fund
ETF
Underlying fund
$854.2 million
4 May 2009
0.15% p.a
299
$8,309.2 million
30 June 1997
S&P/ASX 300 Index
Vanguard Australian Shares Index Fund
Performance return1,2,3 (%)
1 month
3 months
6 months
1 year
3 years (pa)
5 years (pa)
10 years (pa)
Inception (pa)
ETF
Gross
Bmk
ETF
Total
Dist
Growth
2.04
2.95
2.39
5.35
14.72
6.51
n/a
10.61
2.04
2.94
2.37
5.30
14.70
6.48
n/a
10.58
2.03
2.91
2.31
5.19
14.55
6.31
n/a
10.39
1.12
1.12
2.57
4.15
4.90
4.61
n/a
4.72
0.91
1.79
-0.26
1.04
9.65
1.70
n/a
5.67
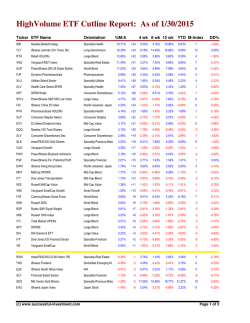
Top 10 holdings
1 CBA
2 Westpac
3 BHP Billiton
4 ANZ
5 NAB
6 Telstra
7 Wesfarmers
8 CSL
9 Woolworths
10 Woodside Petroleum
The Top 10 holdings represent 53.3% of the total underlying fund
Sector allocation6 (%)
5.1
5.1
Energy
15.0
15.0
Materials
7.4
7.4
Industrials
Year to year franking levels and gross return 1,2,3 (%)
Dec - Dec
ETF
YTD
2014
2013
2012
2011
5.35
5.35
19.67
19.74
-10.90
Bmk
5.30
5.30
19.68
19.74
-10.98
June - June
ETF
2.39
17.28
21.89
-7.00
11.93
Franking
2.37
17.25
21.90
-7.01
11.90
92.7
77.6
77.5
78.0
78.2
Prices4
5.9
5.9
Health Care
39.4
39.3
Financials ex Property
7.0
7.0
Net asset value
31 December 2014
$69.0859
Income distribution5
31 December 2014
7.4
7.4
Consumer Staples
Property Trusts
Month ended
Quarter ended
4.1
4.1
Consumer Discretionary
Bmk
Information Technology
1.0
1.0
5.8
5.9
Telecom. Services
Amount (CPU)
Reinvestment price
75.7108
$68.3288
Utilities
1.9
1.9
Notes
1. Past performance is not an indication of future performance
2. Returns assume reinvestment of all distributions. Returns for periods longer than 1 year are
annualised. ETF gross returns are before management costs and taxes, but after transaction and
operational costs. ETF total return is the ETF gross return less management costs. Index returns do not
allow for taxes, management, transaction and operational costs.
3. Returns assume that an investor purchased shares at Net Asset Value (NAV) and does not reflect the
transaction costs imposed on the creation and redemptions of ETF Units, brokerage or the bid ask spread
that investors pay to buy and sell ETF securities on the Australian Securities Exchange.
4. Month end cumulative-distribution
5. Past distributions are not an indication of future distributions
6. Figures as per underlying fund
Further information
Personal investors can transact in Vanguard ETFs through their financial adviser or stockbroker.
Connect with VanguardTM > vanguard.com.au > 1300 655 888
In preparing the above information, individual cirumstances, for example tax implications, have not been taken into account and it may therefore not be applicable to an individual's situtation. Before making an investment decision, you should consider
your or your clients' circumstances and whether the above information is applicable to your or your clients' situation. © 2015 Vanguard Investments Australia Ltd (ABN 72 072 881 086/AFS Licence 227263)("Vanguard") is the issuer of the Vanguard®
Australian Shares Index ETF. Vanguard ETFs will only be issued to Authorised Participants, that is persons who have been authorised as trading participants under the ASX Operating Rules ("Eligible Investors"). Retail investors can transact in Vanguard
ETFs through a stockbroker or financial adviser on the secondary market. Investors should consider the Product Disclosure Statement in deciding whether to acquire Vanguard ETFs. Retail investors can only use the Product Disclosure Statement for
informational purposes only. You can access the Product Disclosure Statement on our website.
Standard & Poors® and S&P® are registered trademarks of Standard & Poor's Financial Services LLC ("S&P"), and ASX® is a registered trademark of the Australian Securities Exchange Limited ("ASX"). These trademarks have been licensed for use by The
Vanguard Group, Inc. Vanguard's ETF(s) is not sponsored, endorsed, sold or promoted by S&P, or ASX. S&P and ASX make no representation, warranty or condition regarding the advisability of buying, selling or holding units/shares in the Vanguard ETF(s)


© Copyright 2026