
LUNAR TIDAL DISSIPATION. James G. Williams, Dale H. Boggs
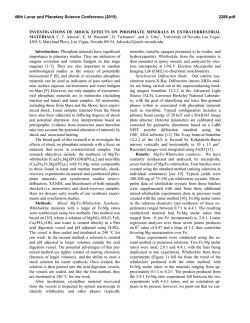
46th Lunar and Planetary Science Conference (2015)
1877.pdf
LUNAR TIDAL DISSIPATION. James G. Williams, Dale H. Boggs, and J. Todd Ratcliff, Jet Propulsion Laboratory, California Institute of Technology, Pasadena, CA, 91109, USA (e-mail [email protected]).
Introduction: The tidal distortion of a gravity field
is proportional to Love number k2. Vertical and horizontal distortions are proportional to two other Love
numbers h2 and l2. The analysis of lunar laser ranging
(LLR) data is sensitive to tides on the Moon. LLR
analysis found a strong value (a low Q) for lunar tidal
dissipation a decade ago [1]. Analysis of subsequent
data have confirmed the low quality factor, Q, and
refined the value for dissipation. Recent analyses of
GRAIL data have provided an excellent value for the
Love number k2 [2-5] and have also detected the strong
dissipation [5].
The shape of the curve for dissipation k2/Q vs. tidal
period depends on the rheology of the deep mantle.
This abstract updates the lunar laser dissipation results
at 4 tidal periods from a recent analysis [6].
Theoretical Background: The theory for the effect of tidal dissipation on the tidal distortion and resulting potential is given in [6]. It is suitable for accurate GRAIL analysis. For each periodic tidal term, the
amplitude is larger than the elastic response and there
is a phase shift. The theory for the effect of tidal dissipation on orientation is presented in [1,6]. Each coefficient for a periodic term is a linear function of k2/Q
dissipation values at different tidal periods.
LLR Solutions: Lunar laser ranging (LLR) data
consisting of 19,361 ranges extending from March
1970 to April 2014 were analyzed. The accuracy has
improved with time. On the Earth, McDonald Observatory, Texas, Observatoire de la Côte d’Azur, France,
Haleakala Observatory, Hawaii, and Apache Point
Observatory in New Mexico have provided extended
data sets. Ranges to 5 retroreflectors at different sites
provide information on the lunar orientation vs. time,
the physical librations. The orientation is specified by
the direction of the axis of rotation and rotation about
that axis.
In addition to standard parameters for retroreflector
positions, orbit, station positions, and Earth orientation, the solution includes parameters for dissipation
related libration terms at 1 month, 1 yr, 3 yr, and 6 yr.
These libration terms depend on tidal dissipation at a
variety of tidal periods including the foregoing. We
derive Q = 38±4 at 1 month and Q = 41±9 at 1 yr. Two
longer periods provide approximate limits of Q≥74 at 3
years, and Q≥58 at 6 years. These values correspond to
k2/Q=(6.4±0.6)x10–4 at 1 month, k2/Q=(6.2±1.4)x10–4
at 1 year, k2/Q≤3.5×10–4 at 3 years, and k2/Q≤4.5×10–4
at 6 years. See [6] for details.
Dissipation vs. Period and Rheology: The strongest dissipation is expected for the deep mantle. A
prime suspect is the attenuating layer that lies above
the liquid core. Strong seismic dissipation was discovered by Apollo seismology and is suspected to be a
partial melt [7,8]. Weber et al. [9] derive a 150 km
thick attenuating layer from radii of 330 to 480 km.
We are concerned with dissipation that is associated with rigidity µ rather than bulk modulus κ. It is
convenient to represent µ with a complex variable. The
imaginary part is from dissipation associated with
shear. For elastic distortions, the Love number k2 is
computed from µ and κ. With dissipation, both µ and
k2 are complex. The (negative) imaginary part of k2
gives k2/Q. The ratio of imaginary to real parts gives
the tangent of the negative phase shift. A fundamental
computation of complex Love numbers evaluates the
elastic equations with complex variables. An alternative approach uses a Taylor expansion of elastic k2
with respect to µ in each layer and then multiplies by
complex µ. The former procedure was used by Harada
et al. [10]. The latter approach is used in this study.
The rheology of the dissipating regions determines
how the dissipation k2/Q depends on tidal period P.
Important factors include temperature, stress, grain
size, water content, and presence of melt [11,12]. Various models have been used for dissipation vs. tidal
period P: a) The time delay model has k2/Q is proportional to 1/P. b) A constant phase shift and k2/Q is a
simple model. c) Maxwell dissipation results when
viscosity can cause unlimited distortion. Then k2/Q ∝
P. d) The Andrade model has k2/Q ∝ Pw. This model,
with a positive w, is frequently used to fit laboratory
data. e) A single relaxation time model produces a
peaked function of k2/Q vs. period. This is an example
of dissipation with limited distortion. It may be an appropriate model for a partial melt. f) An absorption
band model results from the superposition of many
relaxation times with minimum and maximum limits.
With an exponential distribution of relaxation times
between the limits, the dissipation resembles an Andrade model between the limits and decreases outside
the limits.
Comparisons: We compare the foregoing 6 models to the LLR results. Figure 1 shows 6 curves of k2/Q
vs. tidal period. All curves pass through the monthly
(27.2 day) value of k2/Q. Only 3 curves also pass
through the annual value; they are the constant k2/Q,
the single relaxation time, and the absorption band
models. The latter two curves also satisfy the two LLR
upper limits. Only the single relaxation time and the
absorption band models satisfy the 4 LLR results.
Note that an attempt to fit all 4 of the LLR results
with an Andrade curve would lead to a negative slope.
This explains the negative exponent w found in [1,4].
46th Lunar and Planetary Science Conference (2015)
Interpretation: Several papers have attempted to
explain the low tidal Q. Harada et al. [10] proposed
that low viscosity was the cause, possibly from a partial melt in the attenuating layer. The single relaxation
time curve is the analogue. Applying Love number
expressions for a homogeneous body, Efroimsky
[13,14] modeled the decrease at long period with a low
global viscosity. He obtained a peaked curve for k2/Q
vs. tidal period that resembled a single relaxation time
curve. Although a low global viscosity Moon is not
realistic, the peaked k2/Q curve explained the negative
exponent w found in [1,4]. Nimmo et al. [15] applied
an absorption band model and concluded that deep hot
mantle material was sufficient for low Q and a partial
melt was not needed. Karato [16] proposed that the
low lunar Q came from water content in the mantle. A
partial melt was not required. Combining a variety of
evidence, Khan et al. [17] favored a partial melt in the
attenuating zone. There is a diversity of opinion.
Two models give satisfactory fits to the LLR dissipation results (Figure 1): 1) a partial melt causing a
single relaxation time curve and 2) an absorption band
model appropriate for solid material. We are not able
to explain the observed strength of dissipation with the
150 km thick attenuating zone of [9]. At the zero shear
strength limit, a ~200 km thick layer is needed. This
thickness would place the top of the attenuating layer
adjacent to the bottom of the deep moonquake zone
[18]. The lunar mantle has several layers and strong
dissipation could extend over multiple layers. For example, a partial melt in a deep attenuating layer could
cause a single relaxation time component while higher
layers could add an absorption band component.
Summary: LLR analysis provides dissipation information at 4 tidal periods. Two k2/Q values and two
upper limits are shown in Figure 1. Also shown are
examples of 6 models for k2/Q vs. tidal period. Of the
6, only the single relaxation time and absorption band
models are good fits to the LLR results. The former
could indicate a deep partial melt whereas the latter
does not. Future tidal measurements at additional periods would help reveal the source of lunar tidal dissipation.
Acknowledgements: We thank the lunar laser
ranging stations at McDonald Observatory, Texas,
Observatoire de la Côte d’Azur, France, Haleakala
Observatory, Hawaii, and Apache Point Observatory in
New Mexico for providing the ranges that made this
study possible. The research described in this abstract
was carried out at the Jet Propulsion Laboratory of the
California Institute of Technology, under a contract
with the National Aeronautics and Space Administration. Government sponsorship acknowledged.
References: [1] Williams J. G. et al. (2001) J. Geophys. Res., 106, 27,933-27,968. [2] Konopliv A. S. et
al (2013) J. Geophys. Res. Planets 118, 1415–1434,
1877.pdf
doi:10.1002/jgre.20097. [3] Lemoine F. G. et al.
(2013) J. Geophys. Res. Planets 118, 1676–1698,
doi:10.1002/jgre.20118. [4] [Williams J. G. et al.
(2014) J. Geophys. Res. Planets, 119, 1546–1578,
doi:10.1002/2013JE004559. [5] Williams J. G. et al.
(2015) The deep lunar interior from GRAIL, LPSC 46,
abstract 1380. [6] Williams J. G. and Boggs D. H.
(2014) J. Geophys. Res., submitted. [7] Nakamura Y.
et
al.
(1973)
Science
181,
49–51,
doi:10.1126/science.181.4094.49. [8] Nakamura Y. et
al. (1974) Geophys. Res. Lett. 1, 137–140,
doi:10.1029/GL001I003p00137. [9] Weber R. C. et al.
(2011)
Science
331,
309–312,
doi:10.1126/science.1199375. [10] Harada Y. et al.
(2014)
Nature
Geoscience
7,
569–572,
doi:10.1038/ngeo2211. [11] Karato S. and Spetzler H.
A.
(1990)
Rev.
Geophys.
28,
399–421,
doi:10.1029/RG028I004p00399. [12] Karato S. (2010)
Gondwana
Research
18,
17–45,
doi:10.1016/j.gr.2010.03.004.
[13] Efroimsky, M.
(2012) Celest. Mech. Dyn. Astron. 112, 283–330,
doi:10.1007/s10569-011-9397-4. [14] Efroimsky, M.
(2012) Astrophys. J. 746, 150, doi:10.1088/0004637X/746/2/150. Erratum (2013) Astrophys. J. 763,
150, doi:10.1088/0004-637X/763/2/150. [15] Nimmo
F., Faul U. H., and Garnero E. J. (2012) Dissipation at
tidal and seismic frequencies in a melt-free Moon, J.
Geophys.
Research
117,
E09005,
doi:10.1029/2012JE004160. [16] Karato S. (2013)
Earth
Pl.
Sci.
Lett.
384,
144–153,
doi:10.1016/j.epsl.2013.10.001. [17] Khan A., Connolly J. A. D., Pommier A., and Noir J. (2014) Geophysical evidence for melt in the deep lunar interior
and implications for lunar evolution, J. Geophys. Res.
Planets 119, 2197–2221, doi:10.1002/2014JE004661.
[18] Nakamura Y. (2005) Far deep moonquakes and
deep interior of the Moon, J. Geophys. Res. 110,
E01001, doi:10.1029/2004JE002332.
Figure 1. Six model curves show the dependence of
k2/Q on tidal period. The two circles indicate monthly
and annual determinations from LLR data analysis.
Upper limits are shown at 3 and 6 years.
© Copyright 2026