
Economic Le er Se 1 Introduction
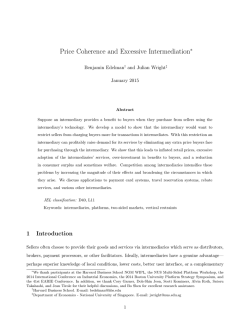
Dermot Coates, Reamonn Lydon & Yvonne McCarthy
1
Economic Letter Series
House price volatility: The role of different buyer types
Vol 2015, No. 2
Abstract
This Economic Letter examines the link between house price dynamics in Ireland during the recent housing
boom and the composition of buyers in the market. The analysis provides information on the relative
riskiness of different buyer types, a topic that has increased in importance with the recent Central Bank of
Ireland proposals to cap loan-to-value and loan-to-income ratios for new mortgage borrowings. The analysis
points to an association between periods of strong house price growth and the changing composition of
Irish property purchasers, and in particular, the rise in the BTL segment.
1
Introduction
In the decade preceding the house price collapse in 2007, real Irish house prices grew by
over 9 per cent per annum. Over this period,
the structural make-up of buyers changed significantly, with first-time buyers (FTBs) accounting for a reducing share of transactions
over time and buy-to-lets (BTLs) accounting
for an increasing share. This raises the question of whether or not different buyer groups
contribute differentially to house price dynamics.
The relationship between different buyer
types and house price volatility is particularly
relevant in the context of recent proposals by
1
the Central Bank of Ireland to cap loan-tovalue (LTV) and loan-to-income (LTI) ratios
on new mortgage lending. These proposals
have highlighted a need to understand more
about the relative riskiness of different buyer
groups. In this context, Kelly et al (2014)
find that FTBs have a lower default risk than
second or subsequent buyers, implying that
this could “rationalize differentiation of policy measures between different buyer groups”.
This Economic Letter sheds further light on
the issue of the relative riskiness of different
buyers by examining the link between periods
of rapid house price growth and the presence
of different buyer groups in the Irish housing
market.
Corresponding author: [email protected]. The views expressed in this paper are those of the
authors only and do not necessarily reflect the views of the Central Bank of Ireland. We thank Gerard O’Reilly,
Gabriel Fagan, Rebecca Stuart and Mark Cassidy for helpful comments.
House price volatility: The role of different buyer types
Internationally, there is limited evidence
on how the actions of different buyer groups
such as new or existing owners/investors affect
house price movements. This Economic Letter attempts to address this gap by examining
the correlation between trends in the housing
market and developments in the composition
of mortgage borrowers over time. We find that
periods of strong house price growth appear to
be related more to the share of BTL borrowers
in the market than to the share of FTBs. The
next section summarises the key results.
price growth expectations for a range of borrowers in 2005 and 2006. There is very little
difference between the range of expectations
(7 to 9 per cent) across the various groups.
In particular, the “wants to buy” group, who
could be considered to be a pool of potential
FTBs, exhibit expectations which are not out
of line with the expectations of other buyer
groups. Thus, there does not appear to be
any evidence in favour of this channel leading
to heterogeneous effects on house prices from
different buyer groups.
2
Figure 1: Price expectations (% annual growth)
The Channels
9
In considering how different buyer groups
might be expected to have a differential impact on house price dynamics, we identify
three potential ‘channels’ and consider the evidence for Ireland: (i) the expectations channel; (ii) the liquidity channel and; (iii) the collateral channel.
8
Expected % Price Change over coming 12 Months
'FTB-pool'
2005
2006
7
6
5
4
3
2
1
Expectations channel A potential buyer’s
current willingness to pay for a property may,
in part, reflect their expectation regarding future price developments. Much of the recent
literature on house prices highlights the role of
expectations in driving house price dynamics,
and in particular, periods of overvaluation. If
buyer groups have different expectations regarding future price developments, their demand, and thus their impact on current house
prices, should vary. In this vein, it could be argued that existing home owners or investors,
who are active in the housing market, are better informed on house price developments and
so have different expectations about the future, than potential new owners (FTBs). In
a rising property market, if FTBs believe price
growth will continue, while other buyer groups
do not, they may purchase property now for
fear that they will not afford it later. This
would lead to a differential impact on house
price growth relative to other buyers.
Figure 1 shows the year-on-year house
0
Owner( >5 yrs) Owner (3-5 yrs) Owner (<=2 yrs) Wants to buy Doesn't own, not Wants to invest
buying
Source: ESRI-IIB Consumer Sentiment Survey
Liquidity channel In a buoyant market, buyer
affordability will fall if incomes do not grow in
line with house prices (assuming no change in
the supply of credit). In this situation, some
buyer groups could find themselves ‘pricedout’ of the market. Again, there is a distinction between existing homeowners or investors
and FTBs. The latter are generally younger,
with lower levels of wealth and income, and
have no existing housing wealth to draw on.
This group, therefore, is more likely to get
priced out of the market at a time when house
prices are increasing rapidly.
To examine this channel, and the ‘pricingout’ hypothesis in particular, we explore trends
in ‘transaction rates’ for the different buyer
groups over time. If a particular group of buyers is priced-out of the market, then one might
2
House price volatility: The role of different buyer types
expect to see a reduction in the level of transactions carried out by this group when house
prices are growing rapidly. We define a transaction rate for a particular group as the ratio
of the number of mortgages drawn down for
house purchase to the total population in that
group. We proxy for the population of potential FTBs with the population aged 25 to 34
years. Similarly for the next-time buyer (NTB)
and BTL group, we use the population aged
35 - 49 years.2
during the peak years of the boom from 2000
through to 2007, suggests that potential FTB
buyers were not priced out of the market. The
starkest result is the trend in the transaction
rate for NTBs and BTLs, which rises rapidly
from 2001 onwards. As we show in the next
section, the main driver of this trend was the
rapid increase in BTL transactions, which rose
from less than 5 per cent of the market to account for more than a quarter of all transactions for house purchases at the peak of the
housing cycle.
Figure 2: Transaction rates
Transaction rates for FTB and NTB+BTL borrowers
9
9
8
7
8
Next-time buyers
(NTB) + Buy-to-let
(BTL)
6
7
6
5
5
First-time buyers(FTB)
4
4
3
3
2
2
1
1
0
0
1996 1997 1998 1999 2000 2001 2002 2003 2004 2005 2006
Source: Central Bank calculations
Figure 2 shows the trends in transaction rates
over time. Following a drop in the mid- to
late-1990s, the FTB transaction rate remained
steady at around 5 per cent of the population
in the 25-34 age group. As a further check.
we also examine the home-ownership rate for
those in the 25-34 year age group using Household Budget Survey data from the CSO; while
the rate declined from 65 per cent in 1994 to
58 per cent in 1999, it remained relatively stable thereafter until the housing bust in 2007.
Overall, the fact that the FTB transaction
and home-ownership rates remained steady
Collateral channel Another way in which
buyers might have differential impacts on
house price dynamics relates to housing equity.3 In a rising housing market, existing homeowners benefit from an increase in
their housing collateral. This capital gain increases their ability to purchase a new property
(as their down-payment constraint has been
eased), and thus the price of properties for
NTBs increases. The increase in the price of
NTB properties leads to further capital gains
in this market and so demand in the NTB market increases further. As this positive feedback loop continues, it can lead to price overshooting, i.e. house prices increase beyond a
level justified by fundamentals.4
If the collateral channel operates, one
would expect to observe an increase in the
share of existing homeowners in housing transactions when house prices rise. Furthermore,
since the additional demand from capital gains
originates with NTBs, and since NTBs and
FTBs generally demand different types of
properties (the latter group tending to demand
2
The choice of the potential pool of each group is informed by our analysis of the characteristics of borrowers
from mortgage loan-level data at the CBI; we observe that the median age of FTBs between 2000 and 2006 was 32
years while the median age for NTB and BTL borrowers was 39 and 42 years respectively.
3
This channel is distinct from the liquidity channel; the latter hypothesises that certain buyers are priced out
of the market because their affordability cannot keep up with house price increases. The collateral channel, on
the other hand, does not suggest that buyers get priced out of the market, but rather that the group of existing
homeowners, who experience capital gains (losses) during housing upturns (downturns) disproportionately impact
house price developments.
4
For further information on this channel, and a more formal model of housing demand with down-payment
constraints, see Stein (1995) and Ortalo-Magn´e (2006).
3
House price volatility: The role of different buyer types
‘starter’ homes, for example), one should observe a difference in the rate of inflation among
FTB and NTB properties. We examine each
of these issues in Figures 3 and 4 below.
growth rate of house prices for first-time versus second-time buyers. Benito (2006) finds a
similar result for the UK, albeit with marginally
higher growth for NTBs during the late 1980s.
Figure 3: Share of mortgage loans for purchase
Figure 4: House price trends (FTB versus NTB)
160
70%
140
60%
120
Next-time buyer
50%
40%
160
FTB
STB
140
140
120
120
100
100
80
80
60
60
40
40
20
20
100
FTB
80
30%
60
20%
40
10%
20
BTL
0
1996
1996
1997
1998
1999
1999
2000
2001
2002
2002
2003
2004
2005
2005
2006
2007
2008
2008
2009
2010
2011
2011
2012
2013
2014
0%
Buy-to-let
First-time buyer
Next-time buyer
House Prices (real, rhs 2005=100)
0
2003Q1
0
2004Q1
2005Q1
2006Q1
2007Q1
2008Q1
2009Q1
Source: Central Bank calculations
Source: DoELG and IBPF
Figure 3 shows that the FTB share declined from 40 per cent to 33 per cent during
the early 2000s as house prices rose rapidly.
However, this was largely due to the marked
increase in BTL transactions during this period. Indeed, if BTL loans are excluded, there
is little change in the FTB share throughout
the boom. This is not necessarily a rejection of
the collateral channel, as Lydon and O’Hanlon
(2012) show that many existing home owners
realised their capital gain via equity withdrawal
which was used to purchase additional property, as opposed to selling their existing home.
The observed negative correlation between
house price growth and FTB shares is not
unique to Ireland. As we show in Figure A6 in
the appendix, similar patterns are observed in
Australia, the US and UK.5
Next we compare house price inflation for
FTB and NTB properties (Figure 4). The
chart shows little difference in the average
One possible explanation of this finding
could be the presence of buy-to-let buyers in
the Irish market. The expectation of greater
inflation in the NTB market assumes that
FTB- and NTB-type properties are not substitutable. In Ireland, however, buy-to-let borrowers were active in acquiring both FTB and
NTB properties during the boom, as indicated
by the average price of properties purchased
by investors (e250,000) which sat at the midway point between FTB (e230,000) and NTB
(e280,000) properties. Thus, whilst we may
observe a collateral effect driving up NTB and
BTL demand, we may not observe differential
levels of house price growth between FTB and
NTB purchases.
One corollary of this is that we would expect to see a positive correlation between excessive house price developments (i.e. over- or
under-shooting) and the share of BTLs in the
market. Figure 5 shows that this is indeed the
case: using a standard house price model to
5
We also tested the significance of this negative correlation in a regression of house price growth on the log of
the FTB share, controlling for disposable income and country fixed effects: the coefficient is -0.21, with a standard
error of 0.063.
6
House price mis-alignment is calculated as the difference between actual and fundamental house prices. The
fundamental house price is estimated with a standard reduced form model of house prices, where prices are a function
of income levels, real interest rates, population levels and the total housing stock. For a more thorough overview of
the model, see Kennedy and McQuinn (2012)
4
House price volatility: The role of different buyer types
measure house price ‘mis-alignment’, we find a
strong correlation between this mis-alignment
and the increasing presence of BTL buyers in
the Irish housing market.6
Figure 5: House price mis-alignment and BTL
40
0.35
30
0.3
20
0.25
10
0.2
0
0.15
-10
0.1
-20
0.05
-30
1996Q1 1998Q1 2000Q1 2002Q1 2004Q1 2006Q1 2008Q1
HP mis-alignment
BTL market share
Percent mis-alignment from fundamental HP
share
0
BTL Market Share (rhs)
Source:Central Bank calculations
3
Conclusion
This Economic Letter examines the link between house prices and the composition of
buyers in the Irish housing market, with a particular focus on the recent housing boom. We
hypothesise three channels through which different buyers might have varying impacts on
house price growth; the expectations channel;
the liquidity channel and the collateral channel.
In terms of the first two channels, we find
no evidence that buyers in the Irish market had
varying impacts on house prices through these
channels. We do, however, observe a number
of stylised facts in the data which are consistent with the operation of the collateral channel. Specifically, we find that during periods
of strong house price appreciation, the share
of FTBs in the market fell, while other buyers, and in particular BTLs, became increasingly important. We also find that the share
of BTLs in the market is positively correlated
with a measure of overvaluation in the market,
a result which does not hold for other buyer
groups.
While a more formal investigation is necessary to define causal relationships between
house prices and different buyer groups, we
nonetheless observe an interesting association between the period of excessive house
price growth observed in Ireland until the
house price collapse in 2007, and the changing composition of Irish property purchasers,
and in particular, the rise in the BTL segment.7 These findings, therefore, are informative when considering the relative riskiness of
different buyer segments, from the perspective
of their relationship with periods of excessive
house price growth.
References
[1] Benito, A. (2006). “How does the down-payment constraint affect the UK housing market?”,
Working Paper No. 294, Bank of England.
[2] CBI (2014). “Macro-prudential policy for residential mortgage lending”, Consultation Paper
CP87, Central Bank of Ireland.
[3] Kelly, R., O’Malley, T. and C. O’Toole (2014). “Do first time buyers default less? Implications
for macro-prudential policy” Economic Letters 14/EL/14, Central Bank of Ireland.
7
In terms of a more formal validatiin of the predictions of the Stein (1995) and Ortalo-Magn´e (2006) models of
housing demand with downpayment constraints, an analysis of the extent to which existing owners used housing
equity to invest in BTL properties, as suggested in Lydon and O’Hanlon, would be particularly useful.
5
House price volatility: The role of different buyer types
[4] Kennedy, G. and K. McQuinn (2012). “Why are Irish house prices still falling?” Economic
Letters 5/EL/12, Central Bank of Ireland.
[5] Lydon, R and N. O’Hanlon (2012). “Housing equity withdrawal, property bubbles and consumption”. Journal of the Statistical and Social Enquiry of Ireland, Vol. XLI.
[6] Ortalo-Magn´e, F. and S. Rady (2006). “Housing market dynamics: On the contribution of
income shocks and credit constraints”, The Review of Economic Studies, Vol. 73, No.2, pp.
459-485.
[7] Stein, J. (1995), “Prices and trading volume in the housing market: a model with downpayment effects”, Quarterly Journal of Economics, 110, pp. 379-406.
Figure 6: FTB share and house prices
House price index and FTB share
FTB Share
HP index
25
80
20
60
15
40
10
20
5
0
0
50
0
2000 2002 2004 2006 2008 2010 2012 2014
FTB Share
HP index
40
30
20
10
0
2000 2002 2004 2006 2008 2010 2012 2014
FTB share
150
House prices
50
FTB Share
House prices
Ireland
80
60
100
40
50
FTB Share
United Kingdom
120
100
80
60
40
20
0
60
50
40
30
20
10
0
100
2000 2002 2004 2006 2008 2010 2012 2014
HP index
FTB Share
150
House prices
30
100
House prices
120
FTB Share
HP index
United States
FTB Share
Australia
20
0
0
1996 1999 2002 2005 2008 2011 2014
Source: National sources, BIS Residential Property Price database (www.bis.org/statistics)
6


© Copyright 2026