
evaluating the impact of health care reform in colombia
DOCUMENTO CEDE 2006-06
ISSN 1657-7191 (Edición Electrónica)
ENERO DE 2006
CEDE
EVALUATING THE IMPACT OF HEALTH CARE REFORM IN
COLOMBIA: FROM THEORY TO PRACTICE1
ALEJANDRO GAVIRIA*
CARLOS MEDINA**
CAROLINA MEJÍA***
Abstract
This article presents an evaluation of an ambitious health reform implemented in
Colombia during the first half of the nineties. The reform attempted to radically
change public provision of health services, by means of the transformation of
subsidies to supply (direct transfers to hospitals) into a new scheme of subsidies to
demand (transfers targeted at the poorest citizens). Although the percentage of the
population having medical care insurance has notably increased, mostly among
the poorest, problems of implementation have been numerous. It has not been
possible to achieve the transformation of subsidies to supply into subsidies to
demand. At the same time, competition has not made it possible to increase the
efficiency of many public hospitals, which continue to operate with very low
occupation rates, while receiving hefty money transfers. Subsidies increased
demand for medical consultations, but have curbed demand for hospitalizations.
Nonetheless, subsidies might have adversely affected female’s labor market
participation and even household consumption. As a whole, evidence suggests
that the health reform has been effective in rationalizing households’ demand for
health, but not in rationalizing public supply, and neither in increasing the efficiency
of service providers.
Keywords: demand subsidies, targeted social services, instrumental variables.
JEL Classification: I1, I11, I18, I38.
1
We thank David McKenzie and Rodrigo R. Soares for detailed comments on a previous version.
Miguel Urquiola and participants of the 12th Economia Panel Meeting provided helpful comments.
Excellent research assistance from Lina Cardona is gratefully acknowledged. All errors are our own.
*
Associated professor Universidad de los Andes, [email protected].
**
Regional Director of Economic Studies, Banco de la República, [email protected].
Opinions expressed in this document are those of the authors and not necessarily reflect the views
of the Banco de la República (Colombian Central Bank) or of the members of its Board of Directors
***
Researcher, Fedesarrollo, [email protected].
1
LA REFORMA EN SALUD EN COLOMBIA: DE LA TEORIA A LA
PRACTICA
Resumen
Este artículo presenta una evaluación de la reforma de salud implantada en
Colombia durante la primera mitad de los años noventa. La reforma intentó
cambiar la forma de la intervención pública en salud, mediante la transformación
de los subsidios a la oferta (transferencias directas a los hospitales) a un nuevo
esquema de subsidios a demanda (transferencias focalizadas hacia los más
pobres). Aunque el porcentaje de la población con seguro medico ha crecido de
manera notable, los problemas de implementación de la reforma han sido
numerosos. La transformación de subsidios de oferta a demanda no ha podido
completarse. Al mismo tiempo, la competencia no ha logrado incrementar la
eficiencia de muchos hospitales públicos, que siguen operando con ocupaciones
muy bajas pero recibiendo transferencias cuantiosas. De otro lado, los subsidios
han aumentado la demanda por consultas pero han disminuido la demanda por
hospitalizaciones. Los subsidios tampoco parecen haber tenido un efecto notable
sobre el consumo de los hogares y pueden haber disminuido la participación
laboral de las mujeres. En conjunto, la evidencia sugiere que el RS ha sido
efectivo para racionalizar la demanda por salud de los hogares, pero no para
racionalizar la oferta pública, ni para incrementar la eficiencia de los prestadores.
Palabras clave: subsidios a la demanda, servicios sociales focalizados, variables
instrumentales.
Clasificación JEL: I1, I11, I18, I38.
2
I. Introduction
In 1993, Colombia implemented an ambitious health reform. Since its inception, the
reform was considered to have been a great advance in terms of fairness and
efficiency and was publicized as a paradigm to be imitated across the developing
world. The reform attempted to transform health care provision in a radical way,
especially for the poorest population. In essence, the reform attempted to
transform public intervention in health care from an scheme of subsidies to supply
(direct transfers to public hospitals) to a scheme of subsidies to demand (transfers
targeted to poor citizens). To this effect, the reform put into practice a system of
vouchers, under the assumption that, after a transition period, efficient public
service providers would cover their costs through the sale of services, and that
competition would eliminate the prevailing (and large) inefficiencies.
The analysis of the impact of the health reform is not only important in itself; it also
offers lessons that go beyond the peculiarity of any particular sector or country.
Ultimately, an overview of the Colombian experience helps in understanding the
difficulties inherent to any attempt of changing the nature of the provision of a
social service (of moving from supply to demand), especially when public supply
tends to be mostly determined by factors unrelated to conventional market forces,
and when many institutions operate with soft-budget constraints. Furthermore, the
Colombian experience also illustrates the complexities of evaluating an integral
scheme of subsidies to demand.
3
This article is divided into two parts. The first describes some institutional aspects
of the reform and emphasizes the difficulties found in the transformation of supply
into demand. The second part evaluates the impact of subsidies to demand upon
the use of services, health outcomes, as well as on household consumption and
labor participation. Together, both parts offer an ambiguous balance of the reform.
Despite the substantial increase in public expenditure on health care and the
increase in the proportion of population with health insurance, many problems
persist. On the one hand, the implantation of a scheme of subsidies to demand has
not been accompanied by a dismantling of subsidies to supply, which has led to a
doubling in expenditure and a multiplication of inefficiencies. On the other hand,
the impact of subsidies upon health outcomes and household consumption are
questionable, to say the least
In particular, this article seeks to evaluate the impact of the Subsidized Regime
(SR) on the three categories of outcomes: (i) on the state of health, subjectively
measured through the self-report and objectively measured by the number of days
in which the person ceased to perform regular activities; (ii) on the use of medical
services (demand for preventive consultations, for medical consultations because
of illness and for hospitalizations); and, lastly, (iii) on household consumption of
goods and services different from health care and labor force participation.
With the aim of overcoming the endogenous nature of enrollment into SR, a
instrumental variables estimation strategy is used. Since just 50% of eligible
individuals are enrolled in the program, and given that the enrollment depends on
4
social and political contacts within municipalities, both the share of the age of the
household’s head living in current municipality, and his length of residence are
used to instrument enrollment into the program. Following are the most important
results of the evaluation. There seems to be a positive effect of enrollment upon
the reported state of health (subjective measurement) and upon the use of both
preventive and illness-related medical consultations. Likewise, enrollment seems to
lessen the frequency of hospitalizations. Finally, the SR appears to have an
adverse effect on consumption and on labor market participation. The remainder of
this document is organized as follows: Section II presents a description of the
reform and an analysis of the implementation problems. Section III briefly
summarizes the relevant literature, outlines the empiric strategy and presents the
results of the evaluation. Finally, Section IV draws some general conclusions.
II. Colombia’s health reform: background, assumptions and results
This section presents a description of: (i) the main institutional innovations
introduced by the health reform; (ii) the assumptions that underlied the reforming
efforts; and, (iii) the results that were finally achieved. As described ahead, the
differences between the assumptions of the reformers and the realities of the
reform were dramatic; which in turn explains the difference between the results
foreseen and those achieved. In the end, the reform to Colombian health care can
be construed as a warning against the difficulties, both institutional and political, in
the implementation of a radical transformation in the way of providing a social
service.
5
1. Institutional aspects before and after the reform
Prior to the reform, the Colombian healthcare system was segmented into three
independent subsystems: the public, the private, and the social security systems.
The public system provided medical care to persons in the low and medium-low
strata, who were not protected by any kind of medical insurance (about 70% of the
total population in 1985). The private sector satisfied the demand of the highincome population (15% of the total population), through direct charges to users or
by means of private health insurance plans. The social security system included
two types of institutions with different target populations. The Social Security
Institute (Instituto de Seguridad Social) was targeted at formal workers belonging
to the private sector and was financed by payroll taxes; and the Social Benefit
Societies (Cajas de Previsión Social) were limited to public sector workers and
were financed directly by the State.
The system in place prior to the reform had three types of problems: (i) low levels
of insurance coverage; (ii) inequities in the access to services, and low levels of
solidarity; and (iii) high inefficiency in the public provision. These problems were
not exclusive of the Colombian system. On the contrary, they were shared by the
majority of healthcare systems in Latin America, which had been consolidated
during the fifties and had favored, from their earliest inception, the higher income
population. Gideon (1993) shows that, at the start of the nineties, nearly 45% of the
urban population lacked medical insurance. Likewise, a large share of hospital
6
discharges and surgical procedures performed by the public system benefitted
persons belonging to the top-income quintile. According to the World Bank (2003),
such historical evidence suggests that, prior to the reform the most affluent
persons were using public sector providers, not for primary care or consultations,
like preventive medical visits, but for costly and high-complexity medical
procedures.
In 1993, Colombia put into practice one of the most ambitious social reforms ever
undertaken in Latin America. Thus has been acknowledged by, among others,
several multilateral organizations, which contributed not only huge amounts of
resources but also technical orientation throughout the design and execution of the
reform. The key principles of the reform included among others: (i) equity in access
to health services, (ii) mandatory health insurance to everyone, (iii) comprehensive
coverage, which includes the design of a benefit package that would be covered by
the Mandatory Health Plan, POS, as well as a subsidized basket, POSS, which
initially covered 50% of the POS, and (iv) free choice of insurer and health
provider.
First of all, the reform sought to solve the problems mentioned above by proposing:
(i) to increase insurance coverage to 36 million people by 2000
(24 million
targeted to the poorest), by increasing resources through National and regional
contributions, as well as through national transfers, (ii) to increase solidarity by
establishing cross subsidies among people able to contribute, and between these
and those unable, and (iii) to increase efficiency through a radical change in the
7
way of participation by the State, which would shift from supply-side subsidies to
demand-side subsidies of health services, and by increasing public hospitals
efficiency through re-structuring programs.
Given the existing problems, the reform intended that all individuals, regardless of
their origin or economic means, would have access to a pre-established package
of basic health services. The new healthcare system divided the operation into two
different levels: the Contributive Regime (CR), which guaranteed the POS to its
enrolees, was targeted at the population of means, and the Subsidized Regime
(SR), which guaranteed the POSS to its enrolees, was designed for the poorest
population.2 During the transition period, before universal coverage was achieved,
there would be also the uninsured population, accounted for mainly by the poor not
covered by the SR.
Population covered by the Contributive Regime
Persons affiliated to the CR contribute with 12% of their earned income. The
employer pays for two thirds of the contribution and the employee pays for the rest.
The contribution is collected by the insurance carrier (EPS) that the contributor
freely chooses. The EPS discounts from each contributor’s contribution the value
of the premium stipulated by the regulation (UPC) for the worker and his/her
dependants, and transfers the difference to an equalization fund known as the
Fosyga in the Colombian legislation. When the said difference is negative, the
2
The resources required to cover the health services included in the POSS are mainly oriented to fund the less
complex health services included in the POS, Currently, the POSS cover 56% of the costs of the POS.
8
Fosyga compensates the EPS with the corresponding value. One point of the
contribution (i.e., the “solidarity point” in the Colombian legal jargon) is transferred
to regional entities with the purpose of paying for the financing of SR’s
beneficiaries (see Figure 1).
Population covered by the Subsidized Regime
Persons enrolled in the SR are selected through a test of their economic means
(proxy-means test) known as the Sisben (System of Beneficiaries Selection). The
score in the Sisben is used in determining six groups of social-economic levels,
with level 1 grouping the poorest population. By legal stipulation, only those
households belonging to levels 1 and 2 of the Sisben are eligible to receive the SR.
In the SR there are insurance carriers (ARS), equivalent to the EPS of the CR.
Enrolled members can freely select their insurance carrier, which receives a
premium per each enrolled member (Subsidized UPC), corresponding to the
estimated value of services in the package stipulated for the SR (see Figure 1).
Each individual ARS establishes agreements with a limited number of public or
private hospitals and health professionals, which provide health services to
enrolees within the benefit package (the POSS) covered by the SR. If the health
service demanded is not covered by the POSS, then the services are provided by
public health care providers and the beneficiary would have to pay 5% of its cost if
he or she was classified as Sisben 1, and 10% if classified as Sisben 2
Resources of the SR come from different sources. The first of them, which was
already mentioned, groups the shared payments put in by contributors to the CR
9
(i.e., solidarity contributions). The second source consists of resources
corresponding to the transfers that the central government makes to regional
entities. The third is made up of resources owned by each regional entity.
According to Bitrán, Gideon and Muñoz (2004), in the year 2004, 64% of the cost
of subsidized services was financed through transfers from the Nation; 24%,
through shared contributions by persons enrolled in the contributive regime; and,
the remaining 10% was financed through regional sources for health care and outof-pocket payments made by enrolees.
Uninsured population
A noteworthy fact is that the eligible but not covered population has a right to
services provided by public hospitals (or private ones, by means of contracts with
regional entities). These services are covered with the so-called supply-side
subsidies. In summary, the Colombian health system is not only characterized by
the existence of two different insurance systems according to enrolees’ ability to
pay, but also by two schemes of confronted subsidies: demand-side subsidies for
enrolees in the SR and supply-side subsidies for poor citizens not enrolled.
In practice, the system’s administrators (municipalities in this case) seem to have
considerable flexibility at the time of choosing who the beneficiaries of the SR will
be. Given that municipalities are autonomous in the management of the targeting
instrument (Sisben) and since the eligible population largely surpasses the number
of beneficiaries, there is a wide margin for arbitrariness and political patronage.
Concerning this, Ruiz et al (1999) point out that, for example, the enrollment in the
10
SR in a municipality on the Colombian Pacific Coast was done simply “by pointing
at certain individuals on a whim. A lot of people enrolled were workers of the
municipality, of the hospital, or of the insurer company itself”. Seemingly, this case
repeats itself time and again all across the country. If belonging to a political
patronage network or counting on political connections has a bearing on the
probability of enrollment, having deep-rooted attachments to a municipality
(understood, for instance, as the number of years of residence there) would be
related with the said probability. This assumption plays a key role in the empirical
strategy used for identifying the impact of the SR.
2. Assumptions of the reform
The health reform was approved based on a basic objective: the proposed
changes would make it possible to achieve universal insurance coverage within a
10-year term. This objective dominated the legislative discussion and ended up
silencing any attempt to voice opposition or express skepticism. The achievement
of that objective was based primarily on the projections for extending the coverage
of the Contributive Regime, CR. According to initial calculations, the CR would
guarantee healthcare coverage for 70% of the better-off tier of the population.
Within that percentage, or target population of the CR, the percentage of enrolled
members would increase from 40% to 90% of wage earners between the years
1994 and 2000 , and would leap from 9% to 85% for independent workers. As is
shown later on, these projections, based on too optimistic assumptions about
economic performance and job generation, were not met.
11
However, the reformist calculations were not only optimistic about macroeconomic
and labor market assumptions (and, therefore, in relation to growth in the number
of individuals enrolled in the CR); they were also overly confident regarding the
possibility of transforming supply-side subsidies into demand-side subsidies.
According to the provisions established by lawmakers, after a period of transition,
the SR would cover the totality of the eligible population (Sisben 1 and 2); public
hospitals would be financed through sales revenues; and supply-side subisdies
would be ostensibly reduced. Thus, public expenditure on health care would be
primarily oriented to subsidizing demand by the poorest citizens and public
hospitals would be transformed into efficient institutions thanks to competition.
Entities not achieving competitiveness would simply disappear. In brief, it was
assumed that public supply was elastic from a long-term viewpoint.
Multilateral credit institutions backed the aforementioned assumptions. According
to the World Bank (2004), for example, “in as much as the number of members
enrolled in the EPS and ARS organizations continued to grow, the need for supplyside subsidies would decline, given that public hospitals would be expected to
finance half of their annual budget by selling their services to the members enrolled
in the Contributive and Subsidized regimes”.
Even if this reasoning is valid in theory, what happened in practice was an increase
in the coverage of healthcare insurance, accompanied by a growth (not a
reduction) in the number of public providers. In short, two assumptions presented
12
by the government and accepted by the political actors made it possible to pass
the law: (i) feasibility of reaching universal coverage in health insurance, and (ii)
feasibility of transforming health subsidies from the supply side to the demand side.
As we will see, both of these proved to be fallacious.
3. Results of the reform
Let us first analyze the results of the first assumption of the reform, that of
universal coverage of health insurance. Both coverage of the Contributive and the
Subsidized regimes had a weaker-than-expected performance, as Figure 2 shows.
Regarding the CR, the number of individuals actually covered was only 54% of that
expected. Not only did growth rates projections turn out to be lower than the
forecast, but something similar happened to the growth in formal employment.
Thus, resources from the shared-contribution system were lower than expected,
which negatively affected the financing of the subsidized regime and the expansion
of coverage among the poorest population. Other sources had actually the largest
gaps, namely those from the regions, which were expected to fund 30% of the SR,
actually collected 90% less resources than expected; while national transfers, that
were expected to fund 40% of the SR, collected 50% less resources than
expected. The number of individuals actually covered by the SR was only 40% that
expected in equivalent terms. On the whole, health insurance coverage increased
from 28% in 1992 to 42% (instead of 100%) in 2000.
13
Despite such observed gap, some actors had anticipated that the goal to achieve
universal coverage might have been too optimistic. What was less anticipated by
them (or what was ignored by both political and academic actors), and constituted
the greatest difference between the theory of the reform and its reality, had to do
with the transformation of subsidies to supply into subsidies to demand. In the first
place, the transformation of resources of supply into resources of demand was
negatively affected by a predictable vicious circle: initially, supply resources had to
be maintained in order to assist the poor, uninsured population; which, in turn,
diminishes available resources for subsidies to demand, which hinders the
enrollment of new members, and which prevents the reduction in resources of
supply, thereby deducting more resources from demand, and so on. In other
words, the increase in demand for healthcare resources occasioned by the greater
insurance coverage is not immediate, which aggravates the transition and may
lead to financially unsustainable situations for many public hospitals, thus leading
them to exert political pressure for more direct transfers.
But the problem of resource transformation goes beyond the transition. The
political pressure exerted by inefficient public hospitals which were not able to
attract resources through the sale of services, and therefore display a structural
shortfall in their budgets, constituted the major bottleneck in accelerating the
transition of subsidies to demand. Gaviria (2004) argues that public supply has
proved to be fundamentally inelastic. It might have actually shown some elasticity,
but not to market forces, as conceptually assumed by reformers, but to political
ones: public hospitals have registered budget increases on the whole, while just a
14
few of the most inefficient have been shut down. According to available evidence,
more than 10 years after the reform, there has been little advance towards
rationalizing public supply and making it more efficient.
The introduction of the SR has been accompanied by both growth in the number of
public hospitals and lower levels of occupation—a predictable result in the face of
soft-budget constraints. Currently, resources are used not only in maintaining
underused public hospitals, but also into subsidizing demand by the poorest
citizens, who prefer to use private hospitals. In other words, the cost of subsidies to
demand has been absorbed, but subsidies to supply have never been dismantled,
which has implied a doubling the cost (see Jack, 2000). To sum up, the lack of
elasticity to market forces of public supply conspired against the most optimistic
projections of reform. Once again, political pressures by public hospitals
overpowered the intentions –evident in the rhetoric, diffuse in practice– that
successive governments had of consolidating a new scheme of subsidies to
demand.
Figure 3 shows the budgetary consequences of the mentioned problem. Growth in
the total budget of the healthcare sector increased substantially: the budget of
public hospitals (initially meant -by reformists- to fund the SR) inflated instead of
declining and a new expenditure item appeared: that of the SR, a good part of
which comes from central budget and does not return by the sale of services
supplied by public hospitals. The expenditure increase in public hospitals has not
taken place as a result of either the opening of new hospitals in underserved areas
15
or a budget redistribution favoring efficient hospitals; rather, it occurred because of
expenditure boom in formerly established public hospital, thanks in part to the
larger resources received from the central government, and to a huge increases in
payroll and wages that took place by between 1995 and 1998 (World Bank, 2003).
4. Some lessons from Colombia’s health reform
The reform produced three results that had not been anticipated by those who
pushed it through: (i) the duplicity in expenditure; (ii) the perpetuation of
inefficiencies in public supply; and, (iii) the horizontal inequities generated by the
lack of universal coverage of the SR. This situation constitutes a warning for those
who continue to defend the movement towards schemes of demand subsidies with
theoretical arguments that do not take political restrictions into consideration. If
public supply is inelastic to market forces, the alternative is to reform political
institutions that impede the working of market forces; or else, the alternative could
be learning to live with the public supply. That does not necessarily mean stoically
accepting the inefficiency of public providers; instead, it underscores the need of
direct policies aimed at increasing the efficiency of existing suppliers, and exposes
the naivety of believing that competition will take care of the problem. This fact is
particularly true in a sector such as that of health care, in which, owing to political
reasons public institutions operate with soft-budget constraints.
On the other hand, lack of accurate information could partially explain this and
other cases of myopic policy design. Governments promoting ambitious (somewhat
16
experimental) reforms in popular issues are usually well regarded by the
electorate, regardless of the feasibility of the reform: good intentions are not always
dwarfed by poor results. Thus, bold reformers have the incentives to push through
risky agendas, mostly when they can always find a multilateral institution to echo
them conceptually and financially.
III. Evaluation of a key component of the reform: the Subsidized Regime
Given the complex structure of the Colombian health system shown in figure 1, a
thorough evaluation would be beyond the scope of this paper. In this section, we
focus on the impact evaluation of the Subsidized Regime, SR. In spite of the
aforementioned problems, the SR remains one of the most important health
interventions in Latin America. Not only because of its cost (close to $1 billion
dollars -1% of GDP- per year, or a quarter of all public resources invested in the
health sector), but also because of its coverage (of over thirteen million people by
2004).
Since public hospitals’ budget has continued to grow after the reform, it is crucial to
know whether insured individuals are better off than uninsured ones. In this
section, we first overview previous work that evaluates the SR, then explain our
model specification and empirical strategy, and finally present the results.
17
1. Bibliography overview and conceptual framework
When the reform was approved, the need to get accurate impact evaluations was
never considered. To that extent, most available work on the impact of the SR is
based on strong (and doubtful) assumptions. Thus, the available evidence could
hardly be used to forge a difficult consensus on the advantages and disadvantages
of the reform. This article aims to overcome this problem.3
The vast majority of research conducted on the SR is descriptive in nature and has
concentrated (i) in characterizing the formal institutional aspects, (ii) in measuring
the incidence and targeting, and (iii) in evaluating the differences between the
private and public ARS (O’Meara et al. 2003, Vélez and Foster 2000, Londoño et
al. 2001, among others). Ayala and Henao (2001) argue that, in spite of the
advances in insurance coverage, the system displays problems of resource
allocation and efficiency: it does not reach the poorest individuals and a large
group of independent workers (who are not poor enough to be eligible for the SR
but who earn less than enough to contribute to the CR) is not covered either.
3
There exists an extensive international literature on the impact of health insurance. Levy and
Meltzer (2001) divide this literature into three categories: (i) observational studies, (ii) quasiexperimental studies, and (iii) randomized experiments (or social experiments). This article belongs
to the second category. On this respect, it is worthwhile to cite the works of Currie and Gruber
(1996 and 1997) and Card and Shore-Sheppard (2004); both pairs of authors analyze the impact of
Medicaid between 1979 and 1992. The first authors find that increases in health insurance
coverage improve health indicators for children (rate of mortality at birth, rate of infant mortality,
child’s weight at birth, preventive medical visits during the last month of pregnancy, and
hospitalization during the past year, among others). The second pair of authors is less optimistic;
they point out that Medicaid expansions had a more modest impact. In general, the impact of health
insurance on health outcomes remains an open question in the literature.
18
Along the same lines, Bitrán et al. (2004), Escobar and Panopoulou (2003), BDO y
CCRP (2000), DNP (2000, 2001, 2003, 2003a), and others, find that there still
exists a large part of the poorest population without formal insurance. These
studies reiterate that the system has somewhat large errors of both inclusion (nonpoor households receiving subsidy) and exclusion (poor households not receiving
subsidy).
Bitrán et al. (2004) also show that households enrolled in the SR spend more in
health care (as a proportion of total household spending) than those enrolled in the
CR and that, for obvious reasons, they are more vulnerable to falling below poverty
line as a result of and adverse health-related shock. In a first attempt to evaluate
the impact of the SR, Panopoulus and Vélez (2001) identify, initially, the factors
that determine enrollment and, later, study the effect of enrollment on both the use
of medical services and the spending in health services. In relation to the first
outcome, they conclude that enrollment depends both on factors related with
demand (individual) and those related with supply (municipality)4, although they
vary in importance depending on whether the individual resides in a rural or urban
zone. In relation to the second issue, they find that beneficiaries of the SR are
more likely to visit a doctor and less likely to be admitted to a hospital.
Nevertheless, they spend less in medical services than those not enrolled.
Contrary to what Panopoulus and Vélez found, Trujillo et al. (2004) show that an
enrollment to the SR does increase the use of medical services (preventive care,
ambulatory visits, and inpatient care).
4
The medical expenditures considered were hospitalization, medical visits and medications.
19
Both articles use the Colombian 1997 LSMS survey and both propose similar
strategies to account for the endogeneity of enrollment: using spatial variation in
key characteristics and arguing that they are independent of the health variables
analyzed. Panopoulus and Vélez (2001) use as instruments the popularity of the
mayor of the municipality of residence and the hospitalization rate of the state. On
the other hand, Trujillo et al. (2004) use as instruments a set of dummy variables
indicating whether the municipality has a health center, whether it is covered by a
major national assistance agency (Red de Solidaridad Social), as well as an index
of living standard conditions of the municipality and voter turn out in 1994 municipal
elections.5
As will be shown later, spatial variables are likely to be related to health outcomes:
not controlling for municipality fixed effects could severely bias impact estimates of
the SR. Furthermore, the Propensity Score Matching (PPS) estimates used by both
papers are troublesome. For example Trujillo et al. (2004)’ estimates have some
obvious problems: (i) the propensity scores do include variables that can be
classified as outputs (health status, head’s employment status and health
expenditures) and (ii) it’s not clear whether matched individual are drawn from the
comparison group with or without replacement.
Figure 4 summarizes the major lines of analysis of this article. In first place, it
studies the effect of the SR on the use of medical services. Hypothetically, the
5
There are 34 states and 1100 municipalities in Colombia.
20
lower cost faced by enrolled individuals increases service use; especially for the
poorest--income is usually the first factor determining demand for medical services
(see Andersen, 1995). In second place, the SR should positively affect
consumption, not only because it significantly reduces the price of a relevant
package of medical services, but also because it lessens the financial impact that
may emerge in case of a medical event of significance.
For effects of this study, the impact of the SR is analyzed on the basis of the four
variables underlined in Table 4. In general, the hypotheses analyzed are the
following. The SR has a positive effect on health status, both if measured in a
subjective manner (self-report) and if measured in an objective manner (days that
the individual ceased performing regular activities because of illness).6 The SR has
a positive effect on the use of preventive visits and illness-related visits. The effect
on the demand for inpatient care is ambiguous. On the one hand, the use of
preventive and ambulatory services averts the later use of curative services (Tono,
2000); on the other hand, the lower cost of inpatient care might increase its use.
The SR has a positive effect on the consumption of goods different from health
services, as it frees disposable income via price, thereby increasing consumption
possibilities.7 Finally, the SR could have a negative impact on labor market
participation.
6
Although the ideal objective measure of the state of health of any person is a medical report, this
information is not available in the data base used.
7
We include in consumption all expenditures made by the household, except durable goods, health
and education.
21
2. Empirical strategy and data base
The evaluation of the impact of the SR has to start by solving the problem of the
endogenous nature of enrollment. Since the selection of beneficiaries is not
randomized, the problem of selection in the non-observables is the first obstacle
that must be confronted. We now proceed to illustrate how individuals are selected
into the SR, and then present the empirical strategy used to get the impact
estimates.
Procedure to enroll individuals into the Subsidized Regime
According to the Colombian health regulations, municipal authorities are
responsible of enrolling individuals into the SR but have no discretion to do so, only
a set of procedures to follow.8 Figure 5 presents the steps municipal authorities
must follow to enroll individuals into the SR. First, individuals are classified as
either “especial” or not. If an individual is classified as “especial”, he (and his family
group) is automatically included in a list of potential beneficiaries; otherwise, the
proxy means test (Sisben) is applied to his family group: each member is classified
according to their Sisben score in one out of six levels. Among the subset of
people in Sisben levels 1 or 2, other groups of “especial” individuals must also be
included automatically into the list of potential beneficiaries: first pregnant women,
then children under five, and so on. Once all special groups have been included,
and if available resources permit to enroll additional people, the list of potential
beneficiaries must be complemented with those belonging to Sisben levels 1 or 2.
8
See Accords 77 of November/1997, and 244 of January/2003.
22
Municipalities are responsible of publicly displaying the complete list of potential
beneficiaries and of asking them to freely select their preferred insurance carrier,
ARS. Individuals not selecting an ARS on time are dropped from the list and
replaced by other individuals not initially included and belonging to Sisben levels 1
or 2. Once individuals selected their preferred ARS, they become officially enrolled
in the SR.
Figure 5 uses bold-face to designate local institutions in charge of key steps in the
selection process.9 If there were any sort of corruption (or unduly favoritism) in any
of these institutions, ineligible individuals might have the possibility to be included
in the list of potential beneficiaries, thus getting access to the SR.
Empirical Methodology
Several types of biases can arise if we do not consider the endogeneity of
enrollment to the SR. For instance, if enrollment depends on the extent of social
connections, then individuals belonging to the medium stratum who are in good
health would have a high probability of becoming beneficiaries, and that, in turn,
could bias the estimation of the impact of the SR. With the aim of solving this
problem, this article uses a instrumental variable (IV) estimation strategy.10
9
ICBF: Colombian Institute of Family Welfare, in charge of policy for children (National entity with
local branches); RSS: Social Solidarity Network, in charge of policy for population displaced by
violence (National entity with local branches).
10
An IV strategy is surely the most adequate for the problem at hand. The traditional nonparametric methods (Propensity Score Matching) do not correct the problem of selection in the nonobservable. Other methods (differences in differences) cannot be applied given that no base line is
available.
23
As usual, the idea is to find a variable that directly affects enrollment, but that does
not directly affect the outcome under analysis. In notational terms, let Zit be the
instrumental variable affecting participation (Dit), but that does not affect the
outcome (Yit).11 Under the assumption that all individuals exhibit homogeneous
responses to the SR, a two-stage estimation procedure is followed. In the first
stage, Zit and Xit are used in predicting Dit:
Dit = f ( X it , Z it ) + Vit ,
(1)
where Dit=1 if individual i is enrolled in the SR at time t and Dit=0 otherwise. In the
second stage, the predicted value Dˆ it of Dit is plugged into the impact equation:
Yit = f t ( X i ) + α t Dˆ it + ε it .
(2)
The parameter α can be interpreted, under certain assumptions, as the mean
impact of the SR. 12
We propose, as instrument for enrollment in the SR, the fraction of life that the
head of household reports having resided in the municipality where he/she resided
at the moment when the survey was conducted. In other words, we assumed that,
conditional to certain observable characteristics, this variable has an incidence on
the person’s enrollment in the SR, but has no direct incidence on the outcome
11
Beyond standard assumptions, IV only requires that conditional in X, the decision to participate is
a non-trivial function (non constant) of Z, and the existence of g(Z) such that: E(g(Zit) εit)=0, and g(Z)
not collinear with f(X) (see Heckman and Robb (1985), and Heckman, LaLonde and Smith (1999)).
The annex presents a listing of all variables (X, Y, Z) with the corresponding statistic descriptions.
12
This follows if either we assume that treatment is homogeneous for all the population, or that it is
heterogeneous, but simultaneously it holds that E(U1-U0|X;D=1)=0, in which cases the average
treatment effect, ATE, equals the average treatment on the treated, ATT (see, for example,
Heckman and Robb (1985), and Heckman, LaLonde and Smith (1999)).
24
variables studied: health status, use of medical services, household consumption
and labor force participation.
In justifying this decision, it is pertinent to make two precisions. First, the SR is
managed directly by the Colombian municipalities, which are in charge of selecting
the beneficiaries and paying the premiums to the intermediary companies (ARS).
Second, given the existing horizontal inequities, of close to 50%, municipalities
have ample autonomy to decide who gets the subsidy and who doesn’t, even if
they do choose to allocate all available resources to the eligible population (Sisben
1 and 2). This is more so when enrollment information is not usually updated and
overseeing is intermittent at best.13
Anecdotic and empirical evidence suggests that enrollment to the SR seems to be
related with political connections and to the density of social networks, just like
happens with the individual’s (or its family’s) capacity to wangle. This problem
becomes evident once we note that by 2000, seven years after the reform had
been approved, 54% of the beneficiaries claimed that they did not know their
13
According to BDO and CCRP (2000), only 62% of the information available in the databases of a
sample of 93 municipalities was supported by the corresponding filled out forms, the rest had been
destroyed, were unreadable, lost, etc. When a follow up survey was applied to families that had a
Sisben form available, 48% of them had information consistent with the follow up survey, only 8%
required to be classified in a lower level, and 44% in a higher level, showing a clear bias toward
benefiting the ineligible. Finally, when individuals were asked for the reasons why they were not
beneficiaries of the SR, 25% said that they did not know how to apply, 9% that there were too many
official procedures, 40% said they already had their Sisben score but the municipality had not
proceed to enroll them, and 10% that they lack economic resources. On the other hand, the same
source reports that, in 2000, only 61% of individuals reported by ARS as their beneficiaries were in
Sisben levels 1 or 2, 9% were in Sisben 3 and 30% did not have any Sisben score since they were
not subject to the proxy means test.
25
rights.14 Actually, 9% of beneficiaries of the SR selected their ARS following the
recommendations of a friend, relative, politician or local leader, while 36% said that
their ARS was assigned by their municipality.15 Thus, local authorities appear to
have enough leeway to point at specific insurers at the moment to enroll
beneficiaries, from which they might illicitly benefit: especially when less than 7% of
beneficiaries actually participated in the election of local committees of citizenship
participation and vigilance.16 On the other hand, in large municipalities and in cities
where connections are less important, the formalities required to obtain enrollment
demand prudential time. Furthermore, several government documents that have
carefully examined the selection process into the SR have mentioned the existence
of political biases.17 Of course, political patronage can not be considered as the
only way to get access to the SR, but it is definitely an important one.
In sum, the crucial assumption is that the extent of social and political connections
is related with the fraction of life that the head of household has been living in the
municipality of residence. In other words, residence can measured how deep-
14
See BDO and CCRP (2000).
See BDO and CCRP (2000).
16
See BDO and CCRP (2000). In addition, National Department of Planning, DNP (2003) reports
that individuals do not participate in the committees because (i) they are afraid to confront the
ineligible beneficiaries, (ii) they do not have time, or (iii) they think that the committees serve no
purpose whatsoever. On the other hand, people distrust the committees: they report that some
members use them either for political purposes or for personal gain.
17
See, for example, DNP (2003), page 125. Also DNP (2001), page 44. The latter document, for
example, reiterate the limits of community participation due to local political misconduct. Finally,
DNP (2000) presents the statements of State governors, mayors, and local attorneys, all of whom
denounce the lack of local control and political misconduct of the system administrators and Sisben
surveyors.
15
26
rooted is the individual’s attachment, and attachment is related with his/her social
capital.18
Data used
Data used come from the Colombian 2003 LSMS survey, which contains
information on 22,949 households and 85,150 individuals and is representative of
the country as a whole. This survey contains a detailed module on health, which
has information at the individual level concerning. (i) insurance status, (ii) health
status and (iii) use of medical services (preventive visits, illnes-related ambulatory
visits, use of inpatient care, and out-of-pocket payments for services). Also
reported is individual information on education, labor market conditions, as well as
information at the household level on consumption, income and dwelling
characteristics.
In the evaluation’s jargon, the individual who reported being enrolled in the SR is
considered treated, and the individual who reported otherwise, non-treated. All
individuals belonging to either the CR or to special health regimes were dropped
from the sample. This selection is made with the purpose of avoiding negatively
biasing the impact estimates. In addition, four categories of outcome variables (Yit
variable en Eq. 2, see Table 1) were considered: health status, use of medical
services, consumption and labor market participation.
18
Some specifications (not shown) use the number of years spent in the municipality of current
residence instead of the fraction of life. In this case, results were similar to those shown in the
following section.
27
The first category includes a subjective measurement: a binary variable that takes
on the value of 1 if the person considers his/her state of health as very good or
good, and the value of 0, otherwise; and an objective measurement: the number of
days that the individual stopped performing regular activities because of the latest
health problem experienced (an illness not requiring hospital admission). In the
category of use of medical services, three variables are considered: use of
preventive visits and use of illness-related visits during the 30 days prior to the
survey, and admission to hospital during the last twelve months–these three binary
variables take on the value of 1 if the event occurs, and of 0 otherwise. In the third
category of outcome variables, the per capita consumption in 2003 pesos is
analyzed (without including healthcare spending). Finally, in the fourth category,
labor market participation is analyzed by means of a variable that takes the value
of 1 if the person is employed or unemployed, and of 0 if inactive.19
Table 1 also shows the exogenous variables (the Xit vector of Eq. 1 and 2) used in
the evaluation.20 These variables are classified in three types: individual,
household and census track variables. Additionally, some specifications include
municipalities fixed effects. Finally, the instrumental variable, Zit in Eq. 2,
corresponds to the fraction of life that the head of household reports having lived in
the municipality where he/she resided at the time of the survey.
19
Only for people 12 or older.
The use of medical services is commonly considered to be a function of the person’s state of
health. This model, however, takes the state of health as an endogenous variable, and it does not
study the relationship between that variable and the use of medical services.
20
28
As mentioned earlier, some authors, Bitrán et al. (2004), Panopoulus and Vélez
(2001) and Trujillo et al. (2004), have indicated that targeting problems are
widespread in the SR: there are non-poor persons who receive the subsidy while
there are poor persons who do not get it. Map 1 illustrates the spatial distribution of
households living in Bogotá (Colombia’s capital city) and interviewed as part of the
2003 LSMS survey. Each dot represents a block where at least one household was
interviewed. There are seven tones in the map, each representing a
socioeconomic strata. The zoomed area shows a sector of the city inhabited by
lower and lower-middle class households (strata 2 an 3). Empty squares denote
blocks where no SR beneficiaries were found. Crisscrossed squares denotes
blocks where there is at least an insured household and uninsured one. As shown,
there are many blocks where such a situation is found. Given the high levels of
spatial segregation in Colombian cities in general and in Bogotá in particular, it
should be clear from the map that horizontal inequalities are rather common
among neighbors, implying that ample scope for discretion in the spatial dimension
is present.21
In an attempt to ratify the conclusions of the mentioned authors, the SISBEN score
was constructed (with data from the 2003 LSMS survey) for each one of the
households, following the questions and original weightings of the survey. Table 2
shows the distribution of beneficiaries according to SISBEN level. The results
21
Socioeconomic strata are a spatial targeting mechanism used in Colombia to assign public
services subsidies. There are six socioeconomic strata, one being the poorest. The Sisben survey
is applied always to all people living in strata one and two, and in some municipalities, to people in
strata 3 and over.
29
suggest the existence of problems of exclusion (poor households not receiving
subsidy) and of inclusion (non-poor households receiving subsidy): in levels 1 and
2 of the SISBEN, more than half the population is not enrolled in the SR, whereas
in levels 3 and 4, a percentage higher than 20% reports being enrolled. Table 3
repeats the same exercise for income quintiles. Results are the same as in the
former case. Taken together, the results suggest that targeting is far from perfect.22
The previous results bring to the fore one of the main problems of the reform. The
movement from a scheme of subsidies to supply towards a scheme of subsidies to
demand was, to a large extent, based on the need of improving targeting. But the
results have been discouraging, casting serious doubts on the premise to the effect
that “whatever goes to demand is better targeted”. In all probability, political
patronage and outright favoritism have thwarted the initial intentions of the
reformers.
Before moving on to the evaluation, it may be pertinent to study the mean
differences among enrolled and non-enrolled individuals for each of the outcome
variables. This exercise is performed not only for the whole sample (Table 4) but
also for the sub-sample of individuals classified in the 1 and 2 SISBEN levels
(Table 5). In the first exercise, the non-enrolled individuals report a better health
status, fewer days of illness-related inactivity, better household conditions, and a
higher labor market participation. Separately, enrolled individuals report greater
22
The results may exaggerate the importance of targeting manipulation since we observe the SISBEN levels
at the moment of the survey rather than at the time of affiliation.
30
use of medical services (preventive consultation, consultation on illness, and
hospitalization) and greater per capita consumption. When circumscribing the
analysis for individuals in the 1 and 2 SISBEN levels, almost all results hold up.
3. Results of the evaluation
This section presents the results of the evaluation. The analysis is first performed
for the total sample and later for the sub-sample of individuals belonging to
SISBEN levels 1 and 2.
For each variable, four estimations are presented: Ordinary Least Squares (OLS)
with and without municipality fixed effects, and Instrumental variables (IV) with and
without municipality fixed effects.23 All specifications correct for the possible
heteroscedasticity in errors. Besides, all estimations were repeated with a larger
group of control variables that includes census tract characteristics. Because the
evaluation results are quite sensitive to instrument choice, two robustness
exercises were carried out. The first exercise used a slightly different instrument:
instead of the fraction of life that the head of household has resided in the
municipality where he/she currently lives, the number of years that the head of
household has lived in the same municipality was used. Results do not change.
The second exercise used a sample restriction: the whole exercise was repeated
for the city of Bogotá, the main city of the country, where health care availability is
23
In IV specifications the R-square is not reported. Reported instead are the coefficient and the
significance of the instrumental variable in the first stage of the estimation.
31
greater than in other regions. Once again, the main results do not change
substantially.
Table 6 shows the estimated impact of the SR upon state of health: reported health
status (subjective measurement) and number of days that the individual stopped
performing regular activities (objective measurement). For the first variable, the
impact of the SR goes from being negative in the OLS estimation to being positive
in the IV estimation. The estimated coefficient is 15 percentage points if
municipalities fixed effects are included, and to 23 points if they are not. In the case
of the number of days that the individual stopped performing regular activities, the
SR does not seem to have any effect. The same result is obtained for both the
OLS estimations and the IV estimations.
Regarding the effect of the SR on the use of medical services, Table 7 shows
evidence in favor of a positive and substantial impact on both the attendance to
preventive medical consultations and the attendance to medical consultations on
illness. In the case of preventive consultations, the estimated effect becomes lower
when municipalities fixed effects are included (39 vs. 25 percentage points),
whereas in the case of consultations on illness, the contrary occurs (62 vs. 66
percentage points). Both results suggest that the SR facilitates access to medical
care, either because of lower cost or because of greater availability of services. For
hospitalization, the effect is the opposite: enrollment in the SR decreases the
probability of having been hospitalized by approximately 11 percentage points in
the IV estimation.
32
As speculation, it could be argued that by encouraging attendance to preventive
medical consultations, the SR diminishes the need of hospitalizations. But perhaps
the explanation is more straightforward and the results will simply show that noncovered persons, because of the absence of insurance itself, tend to request
medical services via emergency rooms, which
implies, in many cases, a
preventive hospitalization. In summary, even if the SR does not avoid
hospitalizations through the better health of enrollees, does in fact seem to avoid
them by means of a more efficient use of medical resources.
The latter result was not foreseen by reformers, who forecasted an increase in the
demand for hospitalization services as a consequence of the extension of the
insurance to the poorest population. The evidence suggests that the SR
rationalized demand for hospital services, although it raised the number of
consultations, which is consistent with the increase in transfers to public hospitals
that occurred after the reform. As was stated earlier, these transfers did not go into
financing an improved functioning but to compensate for the deficit generated by
surplus capacity.
Table 8 shows the effect of the SR on consumption. Although OLS estimates
indicate a negative effect of the SR on consumption, IV estimates show no effect.
This result suggests that savings on medical services prompted by enrollment in
the SR is not substantial and does not seem to be reflected in greater
consumption. Or alternatively, that the effect of the SR may be offset by behavioral
33
responses: diminished labor force participation, for example. All in all, the
subjective well-being indicators show that in the better case, the SR has a nil
effect.
The effect of the SR on consumption may suggest an adverse effect on labor
participation, as it is actually shown in Table 9. Even though the OLS estimates (for
males and females combined, only for males and only for females) are not
significant, the IV estimates suggest that the SR reduces participation by as much
as 24 percentage points. The effects differ substantially according to gender.
Whereas female participation is reduced by as much as 34 points, male
participation remains unchanged. All in all, the SR might indeed relax the need of
looking for a job in order to afford getting health insurance or demanding health
services as uninsured individuals.
It is worth to point out that if a household member gets a formal job and is
consequently enrolled in the CR, then all family members will also be enrolled.
Thus, if, say, a woman head of household gets access to a job in the formal sector,
all household members will be excluded from the SR, and would have apply again
had the woman in question lost her job. Thus, access to the SR could discourage
individuals from taking risky (in terms of long run stability) experiences in the formal
sector. To that extent, the SR ends up working as an additional labor market
rigidity for the movement of individuals from the informal to the formal sector.
34
We re-run all the models restricting the sample to the SISBEN 1 and 2 population,
theoretically the target population of the program. For the self-reported health
status, the effect is negative and small in the OLS estimation, and positive and
close to 40 percentage points in the IV estimation, much larger than for the whole
sample (Table 8). As it happened in the earlier case, there does not seem to be a
discernible effect upon the number of days that the person ceased performing
regular activities because of illness. For this estimation, the sample is quite small,
1,700 observations, which may explain the difficulty in finding significant effects.
As for the impact of the SR on the use of preventive consultations (consultations
on illness), an important difference appears from the earlier exercise, which
analyzes the total sample. Table 10 shows that the effect is larger in this case,
especially when municipality fixed effects are included.
There may be two
explanations for the larger effect of the SR on the poorest population (SISBEN 1
and 2). On the one hand, access to SR would relax their budget and liquidity
constraints, which are likely to be much more severe for this group than for the
whole sample. On the other hand, there might be some sort of larger adverse
selection in this group.
The effect of SR on consultations on illness are in this case nil, thus suggesting
that for this group barriers to access are not important enough to prevent them
from consulting a doctor when an illness comes up. Finally, results do not change
when studying the effect of the SR on hospitalization: the effect continues to be
negative and close to 10 percentage points, and the explanation remains the
35
same: greater prevention and higher efficiency in the use of services prevents
ending up in hospitalization.
Table 12 shows the estimation of the impact of the SR on the per capita
consumption in the restricted sample. Results are now negative for both OLS and
IV estimates, with and without controlling for municipalities: monthly consumption is
approximately COP$75,000 (US$ 30) lower. Finally, Table 13 presents the effects
upon labor market participation. Results are similar to those found for the whole
sample, nonetheless, they are larger in magnitude for females, which in this case
would be 41 points less likely to participate in the labor market when enrolled.
Again, results on consumption and labor market participation are consistent and
stronger than for the whole sample. Needless to say, reformers did not
contemplate this type of effect either.
In summary, the SR seems to have a positive impact on perceived health status,
but not so on the number of days of temporary disability.
At the same time,
evidence is consistent with a rationalization in the use of medical services: more
consultations and fewer hospitalizations. Finally, SR has a negative impact on
consumption and labor market participation.
It is important to note that an exhaustive evaluation of the SR would have to
consider the existence of general equilibrium effects. Given that the subsidized
regime oriented poor individuals’ demand towards private hospitals (i.e. the ARS
contracts an important share of services with hospitals of a private nature), public
36
hospitals have greater capacity to service the non-insured, which could improve
the quantity and quality of the service. This type of effects is not considered in the
previous analysis.
IV. Conclusions
This article presents an evaluation of an ambitious health reform implemented in
Colombia during the first half of the nineties. Among other things, the reform
attempted to change the form of public intervention in health, through the
transformation of subsidies to supply (direct transfers to hospitals) to a new
scheme of subsidies to demand (transfers targeted to the poorest population).
Likewise, the reform put into practice a complex system of financing based, in part,
on shared contributions by formal workers.
At first glance, the results of the reform have been positive. The percentage of the
population with a medical insurance, even though well below what the reform
predicted, has grown notably, especially among the poorest. But problems persist.
It has not been possible to complete the transformation of subsidies to supply from
those to demand. In practice, both schemes subsist and there has been a
duplication of expenditure: demand started being subsidized, but subsidizing
supply has been continued. At the same time, competition has not raised the
efficiency of many public hospitals, which continue to operate with very low
occupancy rates, but receiving hefty transfers.
37
To sum up, the adoption of subsidies to demand has not achieved transforming the
historic inefficiencies of a sector that has demonstrated great inertia of costs and
an almost absolute inelasticity of supply.
From another angle, the analysis suggests that the targeting of subsidies to
demand has not been positive either, and that municipalities seem to be incurring
in practices of political patronage (or favoritisms of other types) at the time of
assigning subsidies. Ultimately, the Colombian experience calls attention to the
fact that granting subsidies to demand, especially when horizontal inequities exist,
may result in political opportunism. If the old subsidies to supply created, in several
Latin American countries, labor union strongholds dedicated to capture rents,
subsidies to demand have generated networks of political patronage dedicated to
select the beneficiaries with a political interest.
As a final point, subsidies to health care have a negative effect on households’
consumption and on female’s labor force participation. These results are mutually
consistent, casting serious doubts upon the effect of the subsidized regime on
overall wellbeing. All in all, the results imply that the program could have created
an involuntary hurdle for individuals seeking to pass from informal to formal
employment. As a whole, evidence suggests that the SR has been effective in
rationalizing households’ demand for health care, but not in rationalizing public
supply or increasing the efficiency of service providers.
38
V. References
Aday, Lu Ann and Andersen, Ronald. (1974). A Framework for the Study of Access
to Medical Care. Health Services Research 9.
Aday, Lu Ann et. al. (1980). Health Care in the US: Equitable for Whom? Beverly
Hill CA: Sage.
Andersen, Ronald. (1968). Behavioral Model of Families’ Use of Health Services.
Center for Health Administration Studies, University of Chicago. Research
Series No. 25.
Andersen, Ronald. (1995). Revisiting the Behavioral Model and Access to Medical
Care: Does it matter? Journal of Health and Social Behavior. Vol 36.
Ayala, Ulpiano and Henao Marta Luz. (2001) Consulting for Targeting, Coverage
and Effectiveness of the social protection network in Colombia: The System
on Social Protection in Health (Consultoría para la Focalización, Cobertura y
Efectividad de la red de protección social en Colombia: El Sistema de
Protección Social en Salud). Report presented by Fedesarrollo and the
World Bank.
Bitrán, R., Gideon, U. and Muñoz, R. (2004) Risk Pooling, Savings and Prevention:
Regional Study of Policies for the protection of the poorest and the effects of
the health shocks: Case study of Colombia. World Bank. (Risk Pooling,
Ahorro y Prevención: Estudio Regional de Políticas para la protección de los
más pobres de los efectos de los shocks de salud: Estudio de caso de
Colombia. Banco Mundial).
BDO y CCRP (2000) “Evaluation of Sisben: Efficiency, Institutional Efficacy of the
Identification, Classification and Beneficiary Selection Processes” Final
Report, Ministry of Health
Blundell, R. y Costa Dias, M. (2002). Alternative Approaches to Evaluation in
Empirical Microeconomics. Centre for micro data methods and practice, UCL
Working Paper.
Brook R., Rogers W., Keeler, E. y Davies, A. (1983). Does Free Care Improve
Adults’ Health? The New England Journal of Medicine 309, 1426-1434.
Card D., Dobkin, C. y Maestas, N. (2004) The Impact of Nearly Universal
Insurance Coverage on Health Care Utilization and Health: Evidence from
Medicare. NBER Working Papers No. 10365.
Card, D. y Shore-Sheppard, L. (2004) Using Discontinuous Eligibility Rules to
Identify The Effects of the Federal Medicaid Expansions on Low Income
Children. The Review of Economics and Statistics. 86 (3).
Currie, J. y Gruber J. (1996). Health insurance eligibility, utilization of medical care
and child health. Quarterly Journal of Economics.
Currie, J. y Gruber J. (1997). The technology of birth: health insurance, medical
interventions and infant health. National Bureau of Economic Research
Working Paper 5985.
Department of National Planning and Ministry of Health (2000) ““Proceedings of
the Regional Conferences on Sisben: Integral Evaluation”
Department of National Planning and Ministry of Health (2001) “Proceedings of the
National Conference on Sisben: Integral Evaluation”
39
Department of National Planning and Ministry of Health (2003) “Who Benefits of
Sisben? Integral Evaluation”
Department of National Planning and Ministry of Health (2003) “Results of the
Evaluation Survey of Sisben at the Municipal Level”
Doyle, Joseph. (2005) Health Insurance, Treatment and Outcomes, Using Auto
Accidents as Health Shocks. NBER Working Paper No. 11099.
Escobar, María Luisa and Panapoulou (2003) “Health” (“Salud”) Chapter 22 in
Colombia: Economic Fundamentals of Peace (Fundamentos Económicos de
la Paz), World Bank, Washington, D.C.
Esguerra, María del Pilar; Acosta, Olga Lucía and Nigrinis, Mario (2000) “System
of Social Security in Colombia: Major costs on the IPS” (“Sistema de
Seguridad Social en Salud en Colombia: Principales Costos sobre las IPS”)
mimeo, Fedesarrollo.
Fihn, Stephan D. and John B. Wicher. (1988). Withdrawing routine outpatient
medical services: effects on access and health. Journal of General Internal
Medicine.
Gideon, U, López H. and Marulanda J. (1993) Public Spending on Health and
Distribution of Subsidies in Colombia. (El Gasto Público en Salud y
Distribución de Subsidios en Colombia). Fedesarrollo and Nacional
Department of Planning.
Gómez Buendía, Hernando (1993) “Counts of the Milking Woman: We have to Ask
Congress to Change the Stories for Accounts” (“Las Cuentas de la Lechera:
Hay que Pedirle al Congreso que nos cambie los Cuentos por las Cuentas”)
El Tiempo, September 21.
Gorbaneff, Yuri; Torres, Sergio y Contreras, Nelson (2004) “Anatomy of the
Healthcare Service Supply Chain in Colombia within the Contributive
Regime” (“Anatomía de la Cadena de Prestación de Salud en Colombia en el
Régimen Contributivo”) Economy Files, National Department of Planning,
Document 259, June.
Haas, Jennifer S., Steven Udvarhelyi and Arnold M. Epstein. (1993). The effect of
providing health coverage to poor uninsured pregnant women in
Massachusetts. Journal of the American Medical Association.
Hanratty, Maria. (1996). Canadian national health insurance and infant health. The
American Economic Review 86(1).
Health Ministry (1994) “The Reform of Social Security in Health, Volume 1:
Background and Results” (“La Reforma a la Seguridad Social en Salud,
Tomo 1: Antecedentes y Resultados”), Carrera Séptima Ltda. Editorial.
Santafé de Bogotá.
Health Ministry (2002) “Evaluation and Restructuring of Processes, Strategies and
Organisms in Charge of Conducting the Functions of Financing, Insuring and
Providing Services in the Subsidized Regime” (“Evaluación y
Reestructuración de los Procesos, Estrategias y Organismos Encargados de
Adelantar las Funciones de Financiación, Aseguramiento y Prestación de
Servicios en el Régimen Subsidiado”) Final Report.
Heckman, J. and Robb, R. (1985) “Alternative Methods for Evaluating the Impact of
Interventions”, in Longitudinal Analysis of Labour Market Data, New York:
Wiley.
40
Heckman, J., LaLonde R. and Smith J. (1999). The Economics and Econometrics
of Active Labor Market Programs. In O. Ashenfelter and D. Card, Chapter 31,
Handbook of Labor Economics, Vol. IV.
Heckman, J., Smith, J. and Clements N. (1997). Making the Most out of Program
Evaluations and Social Experiments: Accounting for Heterogeneity in
program Impacts. Review of Economic Studies, 64.
Jack, William (2000) “Health Insurance Reform in Four Latin American Countries:
Theory and Practice” Policy Research Working Paper 2492.
Keeler, Emmet. (1985). How Free Care Reduced Hypertension in the Health
Insurance Experiment. JAMA 254.
Levy, H. and Meltzer, D. (2001) What Do We Really Know About Whether Health
Insurance Affects Health? University of Chicago publication.
Lichtenberg, Frank. (2000). The Effects of Medicare on Health Care Utilization and
Outcomes. Prepared for presentation at the Frontiers in Health Policy
Research Conference, National Bureau of Economic Research. Washington,
DC, 7. Unpublished manuscript.
Londoño, B., Jaramillo, I. and Uribe, J. (2001). Decentralization and Reform and
Health Service: The Colombian Case. (Descentralización y Reforma en los
Servicios de Salud: El Caso Colombiano). World Bank Working Paper.
Londoño, Juan Luis and Frenk, Julio (1997) “Structured Pluralism: Towards an
Innovative Model for the Reform of Healthcare Systems in Latin America”
(“Pluralismo Estructurado: Hacia un Modelo Innovador para la Reforma de
los Sistemas de Salud en América Latina”) Inter American Development
Bank, Office of the Economist in Chief, Working Paper 353
Lurie, N., Shapiro M. and Brook R. (1984). Termination from Medi-Cal--does it
affect health? New England Journal of Medicine. August.
Marcus, M., Mashigan, M. and Andersen, R. (1996). A Comparative Systems
Perspective on Health Promotion and Disease Prevention. Oral Health
Promotion: Social Sciences in action. Denmark.
National Department of Planning (2003) 2002-2006 National Development Plan:
“Towards a Communitary State” (“Hacia un Estado Comunitario”) National
Press.
Newhouse, J. et al., RAND Insurance Experiment Group. (1993). Free for All?
Lessons from the RAND Health Insurance Experiment. RAND
Nuñez, J. and Espinosa, S. (2005) Exclusion and incidence of social spending
(Exclusión e incidencia del gasto social). Documento CEDE 2005-16.
O’Meara, G., Ruiz, F. and Amaya, J. (2003) Impact of Insurance on the use and
spending on healthcare in Colombia. (Impacto del Aseguramiento sobre uso
y gasto en salud en Colombia). Corona Foundation, Inter American
Development Bank, CENDEX, Pontificia Universidad Javeriana.
Pan-American Health Organization (1999) “Profile of the System of Health
Services in Colombia” (“Perfil del Sistema de Servicios de Salud de
Colombia”) mimeo, Program of Organization and Running of Health Systems
and Services, Division for the Development of Health Systems and Services,
OPS.
Pan-American Health Organization (2000) “Analysis of the Reforms to the Health
Sector in Countries of the Andean Region” (“Análisis de las Reformas del
41
Sector Salud en los Países de la Región Andina”) Area of Strategic
Development in Health, Unit of Health Policies and Systems, OPS.
Panopoulus, G. and Velez, C. (2001) Subsidized Health Insurance, Proxy Means
Testing and the Demand for Health Care among the Poor in Colombia.
Colombia Poverty Report Volume II. World Bank Document.
Perry, C. and Rosen, H. (2001). The self-employed are less likely to have health
insurance than wage earners. So what? National Bureau of Economic
Research Working Paper 8316.
Pincus, Esther et. al. (1998). Social conditions and self-management are more
powerful determinants of health than access to care. Annals of Internal
Medicine 129 (5).
Prada, María Fernanda and Sánchez, Fabio. (2004) Effects of the end-of-century
crises on Colombian households (Efectos de la crisis de fin de siglo sobre los
hogares colombianos 1997-2003). Unpublished Draft.
Quintana, Stella (2004) “The Access to Healthcare Services in Colombia” (“El
Acceso a los Servicios de Salud en Colombia”) mimeo, Doctors without
Borders, Santafé de Bogotá, Colombia
Ravallion, Martin. (2001) The Mystery of Vanishing Effects. World Bank working
paper. World Bank.
Rosenbaum, P. and Rubin, D. (1983). Assessing Sensitivity to an Unobserved
Binary Covariate in an Observational Study with Binary Outcome. Journal of
the Royal Statistical Society, 45.
Ross, C. and Mirowsky, J. (2000). Does medical insurance contribute to
socioeconomic differentials in health? Milbank Quarterly 78 (2).
Rubin, D. (1974). Estimating Causal Effects of Treatments in Randomized and
Nonrandomized Studies. Journal of Educational Psychology, 66.
Ruiz, F. et al. (1999). Environment, Insurance, and access to the subsidized
regime in Colombia. (Entorno, aseguramiento y acceso en el régimen
subsidiado en Colombia). Corona Foundation, Cendex and Ford Foundation.
Tafur, Luis Alberto (2004) “The Health System in Colombia alter the 100 Law” (El
Sistema de Salud de Colombia después de la Ley 100”) mimeo, Public
Health School, Universidad del Valle, Cali, Colombia
Tono Teresa. (2000) Access to healthcare services in Colombia: effects of income
and availability of suppliers over the use of medical services. Social Juncture.
(Acceso a los servicios de salud en Colombia: efectos del ingreso y de la
disponibilidad de proveedores sobre el uso de servicios médicos. Coyuntura
social). Fedesarrollo.
Trujillo, A., Portillo, J. and Vernon, J. (2004) The Impact of Subsidized Health
Insurance for the Poor: Evaluating the Colombian Experience Using
Propensity Score Matching. International Journal of Health Care Finance and
Economics, 5, 211-239
Vélez, Alba Lucía (2002) New Basis for Reform to Social Security in Colombia
(“Nuevas Bases Jurídicas de la Reforma a la Seguridad Social en
Colombia”) Rev Enferm IMSS, 10 (1), 45-53.
Velez, C. and Foster, V. (2000). Colombia Poverty Study: The Impact of Public
Social Expenditure. Latin American Caribbean Region, World Bank,
Washington D.C.
42
Wooldridge, Jeffrey (2002). Econometric Analysis of Cross Section and Panel
Data. MIT Press, Cambridge, MA.
World Bank (1998) “Colombia Economic and Social Development Issues for the
Short and Medium Term” Colombia, Ecuador, and Venezuela Country
Management Unit Latin America and The Caribbean Region, November 19
World Bank (2003) Colombia: The Economic Foundation of Peace. Health Chapter
22.
World Bank (2004) “Program Document For a Proponed Second Programmatic
Labor Reform and Social Structural Adjustment Loan In The Amount of
US$200 Million to the Republic of Colombia” October 6.
43
FIGURES, MAPS AND TABLES
Figure 1. General System of Health Social Security, SGSSS
(1)
Ministry of Social Protection, MPS
Health Superintendence
National Council of Health Social Security, CNSSS
Mandatory Transit Accidents Insurance, SOAT
(2)
Compensation
Weapons taxes
Social VAT
Oil Wells
Cusiana and
Cupiagua
10.5%
FC
EPS
8%
4%
1.0%
FS
0.2%
0.4%
FECAT
GNB
0.25%
Co-payment
Supply
(4)
4%
CCF
CCF/ARS
0.5% FP&P
Demand
Public
SGP
Health
Employers
ARS
Private IPS
FTS - SR
Insured in SR:
Vulnerable poor, not able
to pay for coverage.
(and their family members)
Public IPS
FTS – Public Health
Insured in RC:
Employee, pensioner,
retired, independent
worker with ability to pay.
(and their family members)
(3)
FTS - IPS
Not Insured
Sisben
Local Authorities
(Entidades Territoriales)
Own Resources,
Beverages, Lotteries
Private Funding
Public Funding
Source: Adapted from MHCP y DNP (2003), and Escobar and Panapoulou (2003)
44
Funding by EPS, ARS
Figure 2. Projected versus Actual Number of Individuals Enrolled
(i) Contributive Regime
30
Million People
25
20
15
10
5
0
1992 1993 1994 1995 1996 1997 1998 1999 2000 2001 2002
Projected
Observed
25
90
20
80
15
70
10
60
5
50
0
40
1994
1995
1996
1997
Projected with POSS Projected
Observed with 50% of POS
POSS of 1994
1998
1999
2000
Projected with 50% of POS
POSS Projected
45
POSS as % of POS
Million People
(ii) Subsidized Regime, According to Assumptions about Content of POSS
Figure 3. Composition of Public Expenditure in Health in Colombia
8
7
COP$ trillion of 2000
6
5
4
3
2
1
0
1993
1994
1995
1996
1997
Subsidized Regime
1998
1999
Hospitals
2000
2001
Others
Figure 4. Impact of the Subsidized Regime: Result Variables
46
2002
Figure 5. Process of beneficiaries selection into the SR
Municipality
Abandoned children → ICBF
Indigent population → Municipality
Displaced population → RSS
Indigenous population → Law 691/2001
Ex member of armed group → Ministry of Justice
Head women working for HCB/ICBF → ICBF
Abandonded old population → Municipality
Rural migrating population → Agricultural institutions
Pregnant
women
No
Yes
Include in list
of potential
beneficiaries
Children
under 5
Yes
No
No
Handicaped
Yes
Head
women
No
No
Old
Ineligible
Population
No Pregnant
Forced No
Handicaped
Displaced
women
Yes
Yes
Yes
No
Yes
Municipalities divulge list of potential beneficiaries, and
ask them to select an ARS between 120-90 days before
the final enrollment date
No shows dropped from list of
potential beneficiaries and subject
to filter in six months
No
Public event in which potential beneficiaries
freely select an ARS between 90-30 days
before the final enrollment date
No
Sisben
1/2
Yes
Yes
Complement list of potential
beneficiaries with the poorest:
from lowest to highest
Sisben score
No
Especial
Population
Yes
Showed up
and selected
ARS
Yes
Enrolled
in SR
Complement list of potential
beneficiaries with the poorest:
from lowest to highest
Sisben score
Source: Accords 77 of November/1997, and 244 of January/2003.
Map 1. Targeting of beneficiary households in Bogotá, 2003 LSMS survey
Stratum
Estratum33
Stratum 2
47
Table 1. Variables used in the analysis
Result variables (Y)
Exogenous variables (X)
State of Health
Individuals
Good health and days note able to Age, gender, marital status, ethnic minority and
perform normal activities.
years of formal education.
Use of medical services
Home
Ascending indices for the type of housing,
Preventive consultation,
materials that walls are made of, floors, and
consultation on illness and
quality of waste disposal system and water
hospitalization during the past
source. Dichotomizing variable for the
year.
aqueduct service, sewage system and garbage
collection system.
Well-being
Household
Age of household head, woman head of
Per capita consumption, good
household, years of education of household
economic conditions in the
head, head unemployed, proportion of children
household and whether their living under 7 years of age, per capita income,
standards have improved.
dichotomizing variable by displacement, rural
residence and region.
Labor market participation
Person is employed or seeking for
a job (active)
Table 2. Targeting of the SR according to the SISBEN level
SISBEN level
1
2
3
4
5
6
Enrolled in the SR
No
55.6%
53.3%
61.4%
74.2%
87.7%
96.1%
Yes
44.4%
46.7%
38.6%
25.8%
12.3%
3.9%
Total
100%
100%
100%
100%
100%
100%
Table 3. Targeting of the SR according to income quintiles
Income Quintile
1
2
3
4
5
Enrolled in the SR
No
56.8%
58.4%
67.5%
75.6%
85.2%
48
Yes
43.2%
41.6%
32.5%
24.4%
14.8%
Total
100%
100%
100%
100%
100%
Table 4. Mean differences in result variables: enrolled and not enrolled in the
SR (whole sample)
Enrolled in SR
No
Yes
Significant
difference*
70.8%
62.5%
Yes
45836
5.84
6.00
No
4661
Preventive consultation
35.9%
52.0%
Yes
45836
Consultation on illness
59.1%
77.9%
Yes
4661
Hospitalization
5.3%
6.8%
Yes
45836
Yes
45836
Variable
Number of
Observations
Health
Good health
Days not able to perform regular
activities
Use of medical services
Well-being
Per capita consumption ($)
114,965
82,653
Conditions in the home are good
37.5%
33.4%
Yes
45836
Living standards have improved lately
31.9%
30.7%
Yes
45836
74.9%
70.2%
Yes
45836
Labor Participation
*Significant at 99%.
Table 5. Mean differences in result variables between the enrolled and the
not enrolled (SISBEN 1 and 2)
Variable
Enrolled in SR
No
Yes
Significant
difference*
65.0%
59.4%
Yes
18393
6.84
6.28
No
1799
24.5%
59.9%
5.3%
46.0%
76.5%
6.6%
Yes
Yes
Yes
18393
1799
18393
Yes
18393
Number of
Observations
Health
Good health
Days not able to perform regular
activities
Use of medical services
Preventive consultation
Consultation on illness
Hospitalization
Well-being
Per capita consumption ($)
69,311
Conditions in the home are good
27.4%
28.2%
Yes
18393
Living standards have improved lately
29.8%
28.0%
Yes
18393
76.4%
68.6%
Yes
18393
Labor Participation
*Significant at 99%.
49
61,357
Table 6. Effect of the SR on health status (whole sample)
Dependent variables: good health and number of days that the individual stopped performing regular activities
National sample
OLS
Good Health
Beneficiary of SR
Standard error
Instrument (1 stage)
Standard error
Municipalities fixed effects
Number of observations
R-squared
Days not able to perform
regular activities
Beneficiary of SR
Standard error
Instrument (1 stage)
Standard error
Municipalities fixed effects
Number of observations
R-squared
IV
National sample with additional controls
OLS
IV
Coefficient
Coefficient
Coefficient
Coefficient
Coefficient
Coefficient
Coefficient
Coefficient
-0.0300
0.0062
-0.0314
0.0063
-0.0237
0.0064
Yes
45031
0.2016
0.1472
0.0694
0.1209
0.0088
Yes
45031
0.2008
-0.0219
0.0063
No
45031
0.1760
0.2491
0.0652
0.1276
0.0090
No
45031
0.1756
No
44280
0.1975
Yes
44280
0.2189
-0.1399
0.5146
-0.4002
0.5152
-0.8345
0.5324
Yes
4602
0.0745
0.6482
6.9464
0.0971
0.0267
Yes
4602
0.0743
-0.6122
0.5271
No
4602
0.0363
0.0792
6.8167
0.0933
0.0266
No
4602
0.0363
No
4543
0.0714
Yes
4543
0.1018
Additional controls include census tracts characteristics.
50
0.2257
0.0676
0.1218
0.0086
No
44280
0.1974
0.1537
0.0689
0.1198
0.0085
Yes
44280
0.2186
4.6608
6.9029
0.0928
0.0258
No
4543
0.0711
3.6610
6.9444
0.0991
0.0251
Yes
4543
0.1012
Table 7. Effect of SR on the use of medical services (whole sample)
Dependent variables: Preventive consultation, consultations on illness and hospitalization.
National sample
OLS
IV
Coefficient Coefficient
Coefficient
Coefficient
Preventive consultation
Beneficiary of SR
Standard error
Instrument (1 stage)
Standard error
Municipalities fixed effects
Number of observations
R-squared
Consultations on illness
Beneficiary of SR
Standard error
Instrument (1 stage)
Standard error
Municipalities fixed effects
Number of observations
R-squared
Hospitalization
Beneficiary of SR
Standard error
Instrument (1 stage)
National sample with additional controls
OLS
IV
Coefficient
Coefficient
Coefficient
Coefficient
0.1918
0.1749
0.4759
0.3389
0.1732
0.1691
0.3935
0.2507
0.0069
0.0069
0.0753
0.1276
0.0786
0.1209
0.0071
0.0071
0.0782
0.1218
0.0781
0.1198
No
45031
0.0770
Yes
45031
0.1197
0.0090
No
45031
0.0452
0.0088
Yes
45031
0.0951
No
44280
0.1153
Yes
4428
0.1519
0.0086
No
44280
0.0916
0.0085
Yes
44280
0.1303
0.1893
0.1762
0.5477
0.6609
0.1838
0.1739
0.6243
0.6551
0.0194
0.0188
0.2857
0.0933
0.2658
0.0971
0.0196
0.0196
0.2760
0.0928
0.2566
0.0991
No
4602
0.0580
Yes
4602
0.1373
0.0266
No
4602
0.0241
0.0267
Yes
4602
0.1123
No
4543
0.1178
Yes
4543
0.1808
0.0258
No
4543
0.0901
0.0251
Yes
4543
0.1590
0.0144
0.0173
-0.1137
-0.1004
0.0120
0.0157
-0.1090
-0.1068
0.0032
0.0034
0.0360
0.1276
0.0392
0.1209
0.0034
0.0035
0.0388
0.1218
0.0407
0.1198
0.0090
No
45031
0.0163
0.0088
Yes
45031
0.0250
No
44280
0.0272
Yes
44280
0.0351
0.0086
No
44280
0.0270
0.0085
Yes
44280
0.0345
Standard error
Control by regions
No
Yes
Number of observations
45031
45031
R-squared
0.0167
0.0258
Additional controls include census tracts characteristics.
51
Table 8. Effect of SR on well-being indicators (whole sample)
Dependent variables: consumption per capita, conditions in the home are good and living standards improved lately
National sample
OLS
IV
Coefficient Coefficient
Coefficient
Coefficient
Consumption per capita
Beneficiary of SR
Standard error
Instrument (1 stage)
Standard error
Municipalities fixed effects
Number of observations
R-squared
Conditions in the home
are good
Beneficiary of SR
Standard error
Instrument (1 stage)
Standard error
Control by regions
Number of observations
R-squared
Living standards
improved lately
Beneficiary of SR
Standard error
Instrument (1 stage)
National sample with additional controls
OLS
IV
Coefficient
Coefficient
Coefficient
Coefficient
-8732
-9631
-40272
-43506
-6097
-6525
-12028
-16545
1252
1360
27817
0.1276
26519
0.1209
2443
2628
27820
0.1218
23401
0.1198
No
45031
0.3843
Yes
45031
0.3965
0.0090
No
45031
0.3835
0.0088
Yes
45031
0.3956
No
44280
0.4219
Yes
44280
0.4340
0.0086
No
44280
0.4215
0.0085
Yes
44280
0.4336
-0.0089
-0.0167
-0.0090
0.0959
-0.0127
-0.0164
-0.0121
-0.0181
0.0068
0.0068
0.0732
0.1276
0.0769
0.1209
0.0067
0.0067
0.0740
0.1218
0.0749
0.1198
No
45031
0.0532
Yes
45031
0.0932
0.0090
No
45031
0.0531
0.0088
Yes
45031
0.0930
No
44280
0.1077
Yes
44280
0.1381
0.0086
No
44280
0.1076
0.0085
Yes
44280
0.1378
0.0043
0.0112
-0.3595
-0.3309
-0.0012
0.0060
-0.3534
-0.3573
0.0065
0.0064
0.0719
0.1276
0.0758
0.1209
0.0067
0.0066
0.0762
0.1218
0.0763
0.1198
0.0090
No
45031
0.0252
0.0088
Yes
45031
0.0600
No
44280
0.0495
Yes
44280
0.0845
0.0086
No
44280
0.0504
0.0085
Yes
44280
0.0854
Standard error
Municipalities fixed effects
No
Yes
Number of observations
45031
45031
R-squared
0.0241
0.0593
Additional controls include census tracts characteristics.
52
Table 9. Effect of SR on employment indicators (whole sample)
Dependent variables: labor force participation
National sample
OLS
IV
Coefficient Coefficient
Coefficient
Coefficient
Labor Participation
Beneficiary of SR
National sample with additional controls
OLS
IV
Coefficient
Coefficient
Coefficient
Coefficient
-0.0262
-0.0292
-0.2780
-0.2342
-0.0384
-0.0394
-0.2510
-0.2419
0.0071
0.0071
0.0752
0.1271
0.0789
0.1205
0.0071
0.0072
0.0752
0.1251
0.0771
0.1214
Standard error
Municipalities fixed effects
Number of observations
R-squared
No
32866
0.2557
Yes
32866
0.2683
0.0106
No
32866
0.2557
0.0105
Yes
32866
0.2680
No
32318
0.2984
Yes
32318
0.3074
0.0101
No
32318
0.2976
0.0100
Yes
32318
0.3065
Male labor participation
Beneficiary of SR
Standard error
-0.0406
0.0082
-0.0417
0.0082
-0.1088
0.0851
-0.0313
0.0851
-0.0457
0.0083
-0.0473
0.0082
-0.1374
0.0844
-0.0992
0.0818
0.1225
0.0152
0.1226
0.0154
0.1190
0.0147
0.1225
0.0147
Standard error
Instrument (1 stage)
Instrument (1 stage)
Standard error
Municipalities fixed effects
Number of observations
R-squared
No
15738
0.3096
Yes
15738
0.3264
No
15738
0.3076
Yes
15738
0.3243
No
15456
0.3738
Yes
15456
0.3854
No
15456
0.3715
Yes
15456
0.3830
Female labor
participation
Beneficiary of SR
Standard error
-0.0079
0.0108
-0.0109
0.0109
-0.4036
0.1138
-0.3861
0.1226
-0.0254
0.0107
-0.0261
0.0108
-0.3338
0.1111
-0.3393
0.1167
0.1326
0.0148
0.1219
0.0144
0.1317
0.0140
0.1244
0.0137
No
17128
0.1660
Yes
17128
0.1902
No
16862
0.2147
Yes
16862
0.2332
Instrument (1 stage)
Standard error
Municipalities fixed effects
No
Yes
Number of observations
17128
17128
R-squared
0.1647
0.1893
Additional controls include census tracts characteristics.
53
No
16862
0.2143
Yes
16862
0.2330
Table 10. Effect of SR on the health state (SISBEN 1 and 2)
Dependent variables: good health and days that individual was not able to perform regular activities.
National sample
OLS
IV
Coefficient
Coefficient
Coefficient
Coefficient
Good Health
Beneficiary of SR
Standard error
Instrument (1 stage)
Standard error
Municipalities fixed
effects
Number of observations
R-squared
Days that individual was
not able to perform
regular activities
Beneficiary of SR
Standard error
Instrument (1 stage)
Standard error
Control by regions
Number of observations
R-squared
National sample with additional controls
OLS
IV
Coefficient
Coefficient
Coefficient
Coefficient
-0.0209
-0.0321
0.2860
0.2724
-0.0129
-0.0243
0.4041
0.4027
0.0092
0.0092
0.0732
0.1808
0.0788
0.1672
0.0099
0.0099
0.1031
0.1278
0.0953
0.1388
0.0141
0.0139
0.0128
0.0128
No
17610
0.1564
Yes
17610
0.1907
No
17610
0.1573
Yes
17610
0.1907
No
17381
0.1870
Yes
17381
0.2147
No
17381
0.1880
Yes
17381
0.2155
-0.3176
-0.8219
-2.9164
-1.6822
-0.8851
-1.2957
-9.5929
-8.8110
0.6874
0.6905
5.9652
0.1515
7.0520
0.1360
0.6884
0.6934
8.5763
0.1149
9.9700
0.1124
No
1713
0.0395
Yes
1713
0.0912
0.0410
No
1713
0.0395
0.0405
Yes
1713
0.0903
No
1700
0.1030
Yes
1700
0.1391
0.0379
No
1700
0.1030
0.0380
Yes
1700
0.1380
Additional controls include census tracts characteristics.
54
Table 11. Effect on SR on the use of medical services (SISBEN 1 and 2)
Dependent variables: Preventive consultation, consultations on illness and hospitalization.
National sample
OLS
IV
Coefficient Coefficient
Coefficient
Coefficient
Preventive consultation
Beneficiary of SR
Standard error
Instrument (1 stage)
Standard error
Municipalities fixed effects
Number of observations
R-squared
Consultations on illness
Beneficiary of SR
Standard error
Instrument (1 stage)
Standard error
Municipalities fixed effects
Number of observations
R-squared
Hospitalization
Beneficiary of SR
Standard error
Instrument (1 stage)
Standard error
Municipalities fixed effects
Number of observations
R-squared
National sample with additional controls
OLS
IV
Coefficient
Coefficient
Coefficient
Coefficient
0.2259
0.2101
0.4114
0.4093
0.1935
0.1876
0.3865
0.3870
0.0095
0.0095
0.0755
0.1808
0.0814
0.1672
0.0103
0.0101
0.1067
0.1278
0.0980
0.1388
No
17610
0.0857
Yes
17610
0.1424
0.0141
No
17610
0.0351
0.0139
Yes
17610
0.1028
No
17381
0.1418
Yes
17381
0.1888
0.0128
No
17381
0.1121
0.0128
Yes
17381
0.1627
0.1671
0.1717
0.2734
0.4328
0.1576
0.1390
0.2794
0.3675
0.0291
0.0280
0.2625
0.1515
0.2996
0.1360
0.0305
0.0298
0.3381
0.1149
0.3582
0.1124
No
1713
0.0633
Yes
1713
0.1738
0.0410
No
1713
0.0368
0.0405
Yes
1713
0.1504
No
1700
0.1593
Yes
1700
0.2614
0.0379
No
1700
0.1412
0.0380
Yes
1700
0.2489
0.0134
0.0164
-0.1017
-0.0793
0.0092
0.0122
-0.1050
-0.0995
0.0047
0.0049
0.0391
0.1808
0.0436
0.1672
0.0050
0.0051
0.0561
0.1278
0.0529
0.1388
No
17610
0.0251
Yes
17610
0.0393
0.0141
No
17610
0.0251
0.0139
Yes
17610
0.0386
No
17381
0.0438
Yes
17381
0.0571
0.0128
No
17381
0.0439
0.0128
Yes
17381
0.0570
Additional controls include census tracts characteristics.
55
Table 12. Effect of SR on well-being indicators (SISBEN 1 and 2)
Dependent variables: consumption per capita, conditions in the home are good and living standards improved lately
National sample
OLS
IV
Coefficient Coefficient
Coefficient
Coefficient
Consumption per capita
Beneficiary of SR
Standard error
Instrument (1 stage)
National sample with additional controls
OLS
IV
Coefficient
Coefficient
Coefficient
Coefficient
-6435
-4768
73876
-65328
-6493
-5642
-74326
-74522
1243
1158
11222
0.1808
12134
0.1672
1334
1275
15184
0.1278
14281
0.1388
0.0141
No
17610
0.1809
0.0139
Yes
17610
0.2768
No
17381
0.2385
Yes
17381
0.3172
0.0128
No
17381
0.2389
0.0128
Yes
17381
0.3183
0.2138
0.0710
0.1808
0.0141
No
17610
0.0250
0.3988
0.0770
0.1672
0.0139
Yes
17610
0.0961
0.0196
0.0098
0.0231
0.0096
No
17381
0.0711
Yes
17381
0.1408
0.3556
0.1017
0.1278
0.0128
No
17381
0.0718
0.3743
0.0938
0.1388
0.0128
Yes
17381
0.1417
-0.3800
0.0762
0.1808
0.0141
No
17610
0.0230
-0.3652
0.0815
0.1672
0.0139
Yes
17610
0.1015
0.0109
0.0098
0.0198
0.0093
No
17381
0.0713
Yes
17381
0.1419
-0.5023
0.1072
0.1278
0.0128
No
17381
0.0733
-0.4693
0.0964
0.1388
0.0128
Yes
17381
0.1435
Standard error
Municipalities fixed effects
No
Yes
Number of observations
17610
17610
R-squared
0.1783
0.2750
Conditions in the home
are good
Beneficiary of SR
0.0159
0.0286
Standard error
0.0091
0.0091
Instrument (1 stage)
Standard error
Municipalities fixed effects
No
Yes
Number of observations
17610
17610
R-squared
0.0245
0.0947
Living standards
improved lately
Beneficiary of SR
-0.0046
0.0231
Standard error
0.0093
0.0088
Instrument (1 stage)
Standard error
Municipalities fixed effects
No
Yes
Number of observations
17610
17610
R-squared
0.0205
0.1002
Additional controls include census tracts characteristics.
56
Table 13. Effect of SR on employment indicators (SISBEN 1 y 2)
Dependent variables: labor participation
National sample
OLS
IV
Coefficient Coefficient
Coefficient
Coefficient
Labor Participation
Beneficiary of SR
Standard error
Instrument (1 stage)
Standard error
Municipalities fixed effects
Number of observations
R-squared
Male labor participation
Beneficiary of SR
Standard error
Instrument (1 stage)
Standard error
Municipalities fixed effects
Number of observations
R-squared
-0.0382
0.0105
-0.0357
0.0104
No
11607
0.2984
Yes
11607
0.3181
-0.0406
0.0082
-0.0417
0.0082
No
15738
0.3096
Yes
15738
0.3264
Female labor
participation
Beneficiary of SR
-0.0079
-0.0109
Standard error
0.0108
0.0109
Instrument (1 stage)
Standard error
Municipalities fixed effects
No
Yes
Number of observations
17128
17128
R-squared
0.1647
0.1893
Additional controls include census tracts characteristics.
National sample with additional controls
OLS
IV
Coefficient
Coefficient
Coefficient
Coefficient
-0.1661
0.0904
0.1694
0.0175
No
11607
0.2973
-0.0774
0.0952
0.1619
0.0174
Yes
11607
0.3170
-0.0685
0.0114
-0.0679
0.0113
No
11468
0.3400
Yes
11468
0.3534
-0.1088
0.0851
0.1225
0.0152
No
15738
0.3076
-0.0313
0.0851
0.1226
0.0154
Yes
15738
0.3243
-0.0567
0.0140
-0.0516
0.0137
No
5521
0.3937
Yes
5521
0.4139
-0.4036
0.1138
0.1326
0.0148
No
17128
0.1660
-0.3861
0.1226
0.1219
0.0144
Yes
17128
0.1902
-0.0675
0.0164
-0.0731
0.0165
No
5947
0.2325
Yes
5947
0.2603
57
-0.3033
0.1185
0.1279
0.0157
No
11468
0.3371
-0.2572
0.1093
0.1389
0.0158
Yes
11468
0.3506
-0.0796
0.1434
0.1167
0.0225
No
5521
0.3904
-0.0155
0.1272
0.1288
0.0224
Yes
5521
0.4113
-0.4382
0.1584
0.1434
0.0219
No
5947
0.2307
-0.4146
0.1527
0.1518
0.0222
Yes
5947
0.2580

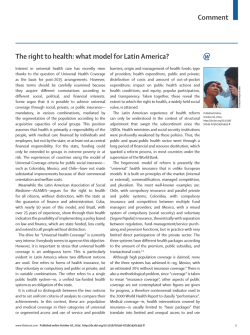
© Copyright 2026