
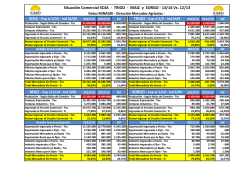
SOJA - Exp al 07/01 - Ind. 31/12 2014/15 2013/14
Avance Comercial SOJA 13/14 Vs. 12/13 – y 14/15 Vs. 13/14
Datos Oficiales MINAGRI
SOJA - Exp al 07/01 - Ind. 31/12
Producción - Según Bolsa de Cereales - Tns
Compras Exportación - Tns.
Compras Industrias - Tns.
Ingresado al Circuito Comercial - Tns.
Ingresado al Circuito Comercial - %
Restan Ingresar al Circuito Comercial - Tns.
Restan Ingresar al Circuito Comercial - %
Detalle Comercialización
Exportación Ingresado a Precio - Tns
Exportación Ingresado a Fijar - Tns
Exportación Mercadería ya fijada - Tns
Exportación Resta que le fijen - Tns
Fábricas Ingresado a Precio - Tns
Fábricas Ingresado a Fijar - Tns
Fábricas Mercadería ya fijada - Tns
Fábricas Resta que le fijen - Tns
Total Mercaderia Sin Precio - Tns
Total Mercaderia Sin Precio - %
SOJA - Exp al 07/01 - Ind. 31/12
Producción - (14/15 Estimación KIMEI)
Compras Exportación - Tns.
Compras Industrias - Tns.
Ingresado al Circuito Comercial - Tns.
Ingresado al Circuito Comercial - %
Restan Ingresar al Circuito Comercial - Tns.
Restan Ingresar al Circuito Comercial - %
Detalle Comercialización
Exportación Ingresado a Precio - Tns
Exportación Ingresado a Fijar - Tns
Exportación Mercadería ya fijada - Tns
Exportación Resta que le fijen - Tns
Fábricas Ingresado a Precio - Tns
Fábricas Ingresado a Fijar - Tns
Fábricas Mercadería ya fijada - Tns
Fábricas Resta que le fijen - Tns
Total Mercaderia Sin Precio - Tns
Total Mercaderia Sin Precio - %
2013/14
2012/13
Dif
54.500.000 48.500.000 6.000.000
10.664.000
9.630.500 1.033.500
31.375.700 31.027.800
347.900
42.039.700 40.658.300 1.381.400
77,14%
83,83%
-6,69%
12.460.300
7.841.700 4.618.600
22,86%
16,17%
6,69%
2013/14
2012/13
Dif
7.300.800
6.977.300
323.500
3.363.200
2.653.200
710.000
2.710.600
2.651.100
59.500
652.600
2.100
650.500
22.992.200 16.959.700 6.032.500
8.383.500 14.068.100 -5.684.600
7.042.100 12.195.500 -5.153.400
1.341.400
1.872.600 -531.200
14.454.300
9.716.400 4.737.900
26,52%
20,03%
6,49%
2014/15 2013/14
56.000.000
1.152.600
1.673.900
2.826.500
5,05%
53.173.500
94,95%
Dif
54.500.000 1.500.000
1.841.800 -689.200
1.186.200
487.700
3.028.000 -201.500
5,56%
-0,51%
51.472.000 1.701.500
94,44%
0,51%
2014/15 2013/14
Dif
138.700
465.500 -326.800
1.013.900 1.376.300 -362.400
14.200
139.800 -125.600
999.700 1.236.500 -236.800
179.100
638.300 -459.200
1.494.800
547.900
946.900
35.800
34.600
1.200
1.459.000
513.300
945.700
55.632.200 53.221.800 2.410.400
99,34%
97,65%
1,69%

© Copyright 2026