
Sulphur content in ships bunker fuel in 2015
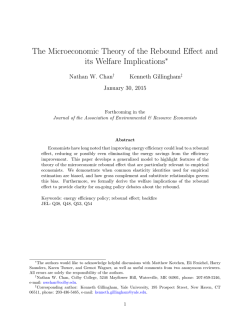
PUBLICATIONS OF
THE MINISTRY OF TRANSPORT AND COMMUNICATIONS
31/2009
Sulphur content in ships bunker fuel
in 2015
A study on the impacts of the new IMO
regulations on transportation costs
Helsinki, 2009
DESCRIPTION
Date of publication
9 April 2009
Authors (from body; name, chairman and secretary of the body)
Type of publication
Juha Kalli, Tapio Karvonen and
Report
Assigned by
Teemu Makkonen, University of Turku,
Ministry of Transport and Communications
Date when body appointed
The Centre for Maritime Studies
Name of the publication
Sulphur content in ships bunker fuel in 2015
A study on the impacts of the new IMO regulations and transportation costs
Abstract
On 10 October 2008 the Marine Environment Protection Committee of the International Maritime
Organisation, IMO, unanimously adopted the revised Annex VI, Prevention of Air Pollution from Ships, to
the MARPOL 73/78 Convention. The Annex sets limits on nitrogen oxide and sulphur oxide emissions from
ship exhausts. Low sulphur fuel also reduces particulate emissions from ships. The new Annex will enter
into force on 1 July 2010. The highest sulphur content allowed in ship fuel will reduce globally as of 1
January 2012 from 4.5% to 3.5% and as of 1 January 2020 to 0.5%. Sulphur content allowed in Sulphur
Emission Control Areas (SECA) that currently include the Baltic Sea, the North Sea and the English
Channel will decrease as of 1 July 2010 from 1.5% to 1.0% and as of 1 January 2015 to 0.1%. The use of
exhaust gas cleaning systems will continue to be allowed, which means that vessels equipped with scrubbers
may also run on types of fuel that are currently in use.
According to an IMO expert study, the use of heavy fuel oils will largely have to be abandoned once the
sulphur content limit in fuel decreases to less than 1%. Transfer to low sulphur and thus cleaner fuels
(marine diesel and marine gas oil) will increase fuel costs considerably, because it is more expensive to
produce cleaner fuels than heavy fuels. Fuel price forecasts should be treated with caution because there are
so many variables affecting the price.
A calculation model presented in the study estimates the fuel consumption of vessels in Finland’s foreign
trade transport to be 1.8 million to 2.6 million tonnes a year. With many uncertainties involved, it is difficult
to estimate how the fuel price will develop. The two fuel consumption scenarios in the study suggest that
additional costs would amount to between 200 million and 1.18 billion euros. After the entry into force of
the new IMO regulations in SECA areas in the beginning of 2015, the growing fuel costs will increase sea
freight charges.
The savings in fuel costs due to the possible use of a scrubber adaptable to Baltic Sea conditions has been
considered in the calculations. The calculations do not, however, take account of the impact of the new
SECA areas. The USA and Canada will establish a SECA area outside their coastal areas. The Commission
of the European Union is also exploring the possibilities to establish SECA areas outside EU Member
States’ coastal areas in the Mediterranean and the Black Sea. The increasing demand for low sulphur fuel
will increase the market and thus influence the price formation.
Keywords
Sulphur content regulations, scrubbers, fuel types, fuel price, transport costs
Miscellaneous
Contact person at the Ministry: Ms Lolan Eriksson
Serial name and number
ISSN
ISBN
Publications of the Ministry of Transport and Communications 31/2009
1457-7488 (printed version)
1795-4045 (electronic version)
978-952-243-073-1 (printed version)
978-952-243-074-8 (electronic version)
Pages, total
Language
Price
Confidence status
38
English
Distributed and published by
Ministry of Transport and Communications
Public
3
ABSTRACT
On 10 October 2008 the Marine Environment Protection Committee (MEPC) of the
International Maritime Organisation (IMO) unanimously adopted the revised Annex VI
to MARPOL 73/78 (International Convention for the Prevention of Pollution from
Ships), which places restrictions on nitrogen and sulphur oxides emissions from ship
traffic. Lowering the sulphur content in fuels will also be a way to reduce emissions of
particulate matter from shipping. The new Annex enters into force on 1 July 2010. The
sulphur content of fuel will fall in the special areas (SECA = Sulphur Emission Control
Area), which are the Baltic Sea, the North Sea and the English Channel, from 1.5% to
1% from 1 July 2010, and to 0.1% from 1 January 2015. Globally, the highest permitted
sulphur content of fuel will fall, as from 1 January 2012, from 4.5% to 3.5%, and to
0.5% from 1 January 2020. The use of sulphur scrubbers will still be allowed, so that
the fuel grades currently in use on vessels fitted with them can also be used.
For a long time now, large car and passenger ferries on the Baltic Sea have been using
heavy fuel oil with a sulphur content of no more than 0.5%. However, there is not
enough of it as things are now – and the situation may not change in the future either to meet the needs of all marine traffic in the Baltic, North Sea and English Channel. A
report by the IMO states that approximately 0.5% of the fuel currently used by global
maritime traffic is heavy fuel oil with a sulphur content of less than 0.5%. According to
the report, the use of heavy fuel oil grades will mainly need to be abandoned when the
sulphur content limit for fuel is less than 1%, necessitating a switch to light fuel grades.
Accordingly, it is also difficult to estimate the price that heavy fuel oil with a maximum
sulphur content of 0.5% might be in the future.
A switch to fuel with a maximum sulphur content of 0.1% will in practice mean that
vessels will have to use gas oil (MGO) as fuel, which is a lot more expensive than
heavy fuel oils, owing to the way it is manufactured. It has proven difficult to estimate
the availability of low sulphur fuels. Estimates received suggest that the problems will
not be owing to the demands on SECA areas, at least not yet, but to the fact that when
light fuels start to be used worldwide, the oil industry will have to increase its refining
capacity considerably to meet the rise in demand for light fuel grades.
One should always exercise caution when predicting future prices for fuels, as there are
so many variables involved. Besides, price trends are not so much based on facts as all
the various expectations and beliefs concerning the future. Uncertainty and the massive
fluctuations in fuel prices we have witnessed have led us in this report to give fuel
prices that are not based on any precise value but a probable range of variation on the
basis of estimates by the member companies of the Finnish Oil and Gas Federation.
The expert views received from shipping companies and Confederation of Finnish Industries associations suggest that rising fuel costs will, in time, be incorporated in their
entirety in sea freight costs. As a result, sea freight charges will increase considerably
when the stringent regulations on maximum sulphur content take effect. Rising freight
costs will particularly affect sectors that depend very much on exports and/or imports.
4
The total fuel consumption for ships bound for Finland has been estimated on the basis
of two scenarios for consumption in 2007, where maximum consumption is 2.6 million
tonnes (scenario 1) and minimum consumption is 1.8 million tonnes (scenario 2). The
estimate is that if vessels bound for Finland were to switch from heavy to light fuel - in
this case gas oil with a maximum sulphur content of 0.1% - the following additional
costs would be incurred, given the differential in prices for fuel grades:
1) at 111 euros per tonne the maximum would be 273 million euros and the minimum 190 million euros
2) at 480 euros per tonne the maximum would be 1.182 million euros and the
minimum 823 million euros
The calculations do not take account of the savings in fuel costs through the possible
use of sulphur scrubbers, adapted to deal with the conditions in the Baltic Sea.
5
CONTENTS
1
2
3
INTRODUCTION ................................................................................................... 6
DAY-TO-DAY RUNNING COSTS OF THE VARIOUS VESSEL TYPES ........ 8
EFFECT OF THE ESTIMATED FUEL PRICE RISE ON THE CHANGE TO
THE DAY-TO-DAY RUNNING COSTS OF VESSELS .................................... 10
3.1
Ship fuels ...................................................................................................... 10
3.2
Fuel prices .................................................................................................... 10
3.3 Fuel availability .................................................................................................. 16
4
INVESTMENT IN AND USE AND TOTAL COSTS OF SULPHUR
SCRUBBERS ........................................................................................................ 19
5 AN ESTIMATE OF TOTAL COSTS TO FINNISH MARITIME TRAFFIC ........... 21
6 EFFECT OF THE ESTIMATED PRICE RISE IN FUEL ON FREIGHT CHARGES
AND ON CERTAIN SECTORS........................................................................... 30
7 ENVIRONMENTAL IMPACT AND EFFECTS ON HUMAN HEALTH OF THE
SULPHUR CONTENT OF FUEL ........................................................................ 32
7.1 Sulphur dioxide .................................................................................................... 32
7.2 Fine particles......................................................................................................... 32
7.3 The effect on air quality of lowering the sulphur conent of fuel used in ships .... 33
8 CONCLUSIONS ......................................................................................................... 35
Sources
Appendix 1: Outlook for Marine Bunkers and Fuel Oil to 2025. Sourcing Lower Sulphur Products
6
1
INTRODUCTION
On 10 October 2008 the Marine Environment Protection Committee (MEPC) of the
International Maritime Organisation (IMO) unanimously adopted the revised MARPOL
73/78 (International Convention for the Prevention of Pollution from Ships) Annex VI
on air pollution from ships. The aim of the IMO is to reduce emissions from ships by a
switch from heavy fuel oils to light fuel oils. The new rules would place restrictions on
nitrogen and sulphur oxides (NOx and SOx) emissions from ship traffic into the atmosphere and as fallout into the sea. Lowering the sulphur content in fuels is also a way to
reduce emissions of particulate matter from shipping. The regulations would help reduce the harmful effects of emissions on human health and the marine environment, and
would increase navigational safety.
The new Annex enters into force on 1 July 2010, in accordance with the ’tacit acceptance procedure of the MARPOL 73/78 Convention.
The sulphur content of fuel will fall in the special areas (SECA), which are the Baltic
Sea, the North Sea and the English Channel (figure 1), from 1.5% to 1% from 1 July
2010, and to 0.1% from 1 January 2015. Globally, the highest permitted sulphur content
of fuel will fall, as from 1 January 2012, from 4.5% to 3.5%, and to 0.5% from 1 January 2020. The use of sulphur scrubbers will still be allowed, so that the fuel grades currently in use on vessels fitted with them can also be used.
The European Union will also see a regulation take effect on 1 January 2010 which
states that if a vessel is in a port for more than two hours it has to use a fuel with a sulphur content of no more than 0.1% while it is there.
Figure 1.1. The SECA special area (Baltic Sea, North Sea [latitude 62° north and longitude 4°
west] and the English Channel [longitude 5° west]).
7
In addition, the IMO’s MEPC 58 meeting endorsed the three Tier rules for NOx emission limits (Tiers 1-3) In addition to the existing Tier 1, there will be a Tier 2 standard
for new engines (in effect from 2011; around 20% lower than Tier 1) and the Tier 3
emission limits (in effect from 2016; around 80% less than Tier 1). The Tier 3 standard
is to be applied in the special Emission Control Areas established and would mean, using current technology, the introduction of the catalyst system, for example. The Tier 2
standard can be attained through improved engine technology. HELCOM is at present
looking into the possibility of creating an NOx special area in the Baltic Sea.
The IMO’s MEPC is presently preparing draft measures to limit greenhouse gases from
shipping. The Committee is to continue its discussion of the matter at its meeting in July
2009.
The principle aim of this report is to assess the effect of the regulations on the sulphur
content of fuel used by ships under the revised Annex VI of the MARPOL 73/78 Convention on the fuel costs to maritime traffic between Finland and continental Europe
and freight traffic transportation costs in the SECA area, and also to assess the impacts
of these costs on the various import and export sectors in Finland.
The report was produced by the Centre for Maritime Studies at the University of Turku.
It was the work of special researcher Mr. Tapio Karvonen, acting as project manager,
and researchers Me. Juha Kalli and Mr. Teemu Makkonen. The report was commissioned and sponsored by the Finnish Ministry of Transport and Communications. Mrs.
Lolan Margaretha Eriksson, Ministerial Counsellor at the Ministry, acted as Chairperson of the Steering Committee. The other members were Mr. Jorma Kämäräinen, Senior
Maritime Inspector, Mr. Markus Helavuori, Maritime Inspector at the Finnish Maritime
Administration, Mrs. Tiina Haapasalo, Senior Adviser at the Confederation of Finnish
Industries, and Mr. Bernt Bergman and Mr. Tero Jokilehto, both Senior Advisers at the
Finnish Shipowners' Association.
8
2
DAY-TO-DAY RUNNING COSTS OF THE VARIOUS VESSEL TYPES
Figure 2.1 gives the relative distribution of the day-to-day running costs by vessel type
of vessels operating between Finland and other countries and sailing under the Finnish
or a foreign1 flag, according to the Finnish Vessel Costs Survey 2006. Cost factors are
proportionately tied to vessel type and size. Seven vessel types are examined: container,
container feeder2, conventional dry cargo, dry bulk and ro-ro vessels, car and passenger
ferries and tankers. The comparisons given here were made by vessel type according to
the mean value for their draught categories3. It will be seen from the diagram that fuel
costs account for the largest share of the vessel costs for all vessel types now, and especially container vessels (fuel prices as at 2006: container vessels 54%, conventional dry
cargo vessels 38%, dry bulk vessels 40%, tankers 33 %, ro-ro vessels 36%, and car and
passenger ferries 30%)4.
100 %
90 %
80 %
70 %
Fuel
60 %
Overhead
Insurance
50 %
Repairs and maintenance
Crew (navigation)
40 %
Capital expenditure
30 %
20 %
10 %
0%
Container
Conventional dry
cargo
Dry bulk
Tankers
Ro-ro
Car and passenger
ferries
Figure 2.1. Distribution of costs by vessel type on average for vessels operating between
Finland and other countries and sailing under the Finnish or a foreign flag (Karvonen et al
2006).
1
The structure of day-to-day running costs of foreign vessels is assessed in the survey (Karvonen et al
2006) with principle reference to the main flag states for vessels entering Finnish ports.
2
A typical container vessel for feeder traffic in operation in Finnish waters (draught 9 m, container capacity approximately 1,000 TEU).
3
Because the claculations do not use a weighted mean value, the figures do not reflect an average vessel
but the mean values for draught categories.
4
With regard to cointainer vessels, it should be noted that the calculation is based on sample data, including that for large container vessels that do not enter Finnish ports. The share of fuel costs is not so great
for feeder container vessels typically sailing in Finnish waters. It is closer to those for conventional dry
cargo vessels.
9
Changes in the price of fuel affect the relative cost structure. If it rises, fuel and vessel
running costs increase and the relative share of fuel costs as a component of day-to-day
costs also goes up. It should be noted with regard to vessel costs that the fuel costs contained in them have been calculated in general with reference to the vessel’s engine
power. In reality, vessels with the same engine power can consume very different
amounts of fuel. The speeds of vessels also affect consumption, which has an impact on
fuel costs: consumption at lower speeds is less, and fuel costs are also lower as a result.
But vessels on scheduled routes cannot normally reduce their speed without it affecting
the viability of the entire transport chain.
The Vessel Costs Survey 2006 and the additions made to it (Karvonen 2007) can help
us to identify the average total costs and fuel costs5 for the different vessel types both
overall and per transported unit (Tables 2.1 and 2.2). Car and passenger ferries have by
far the highest operational and fuel costs. The running costs for ro-ro ships are clearly
higher than other cargo ship types when costs are examined for each transported unit
(see Karvonen et al 2006).
Table 2.1. Average fuel and operating costs for container vessels6
Vessel type
Fuel costs €
per travel day
Vessel costs €
per travel day
Fuel costs
€/TEU per
travel day
Vessel costs
€/TEU per
travel day
Container vessels
24,199
35,983
15.63
23.24
Container feeder vessels
15,081
23,184
12.73
19.56
Table 2.2. Average fuel and operating costs for vessel types
Vessel type
Conventional dry cargo vessels
Fuel costs €
per travel day
Vessel costs €
per travel day
Fuel costs €/t
per travel day
Vessel costs
€/t per travel
day
6,425
12,320
0.67
1.29
Dry bulk vessels
10,357
19,033
0.29
0.53
Tankers
10,093
21,615
0.40
0.86
Ro-ro vessels
14,587
29,255
1.70
3.41
Car and passenger ferries
41,166
95,407
5
To eliminate the distorting effect of huge fuel price fluctuations for short periods of time, the calculations have made use of a three year (2006-2008) average of 370 USD/t = 271 €/t, i.e. at the average dollar exchange rate for the same period (1 USD = 0,732 €) (Scandinavian Shipping Gazette 2009; Bank of
Finland 2009).
6
With container vessels the transported unit referred to is not the number of tonnes but TEUs, because
that reflects the reduction in vessel costs in relation to the amount of transported goods on container vessels more satisfactorily than a calculation based on the number of tonnes, as the economies of scale are
very obvious (Karvonen 2007).
10
3
EFFECT OF THE ESTIMATED FUEL PRICE RISE ON THE CHANGE TO
THE DAY-TO-DAY RUNNING COSTS OF VESSELS
3.1
Ship fuels
Ships generally run on heavy fuel oil (HFO/IFO). In auxiliary engines distillates are
usually used like marine diesel oil (MDO) or marine gas oil (MGO, with a maximum
sulphur content of 0.1%). Both of these have a lower sulphur content than heavy fuel
oil. MDO and MGO are also collectively known as light fuel oil. These distilled fuels
are more expensive than heavy fuel. For the purposes of this report, shipping companies
were asked in what proportion they used heavy fuel and distilled fuel grades in their
vessels. The answers received showed that 95% of the fuel used was heavy fuel oil and
5% MDO or MGO. This information was used in the cost calculations presented later in
this report.
It is possible to achieve a low sulphur content in fuel in two ways:
1) heavy fuel oil can be made from crude oil, which naturally contains less
sulphur
or
2) high sulphur and low sulphur fuel are mixed together
•
3.2
Fuel containing less than 1.5% sulphur, which is used at present in the Baltic
Sea, the North Sea and the English Channel, is normally high sulphur fuel
which has been mixed with a slightly lower sulphur content fuel, to keep the
sulphur content under the 1.5% mark. In 2010 the sulphur content limit will
drop to 1.0%, which will in practice mean having to change the mixing proportions, resulting in a greater need for low sulphur fuel. Mixing different fuel
grades, however, could lead to increasing engine problems due to poorer quality
fuel, as the new blends might be unstable.
Fuel prices
By 2015 the maximum sulphur content limit will fall to 0.1% in the SECA areas. Then
it will be technically impossible to mix fuel grades, and ships will have to switch to gas
oil (MGO), which would be the only option among the fuel grades presently available.
Because of the way it is manufactured, MGO is far more expensive than heavy fuel oils.
Furthermore, as the demand for it increases, it will also presumably go up in price.
As has been said, the prices of fuel grades containing less sulphur are higher than that
for the fuel grade more commonly in use at the moment (heavy fuel oil with a sulphur
content of 1.5%). This will cause a rise in the fuel costs of vessels. The change to fuel
costs was assessed by asking member companies of the Finnish Oil and Gas Federation
(ÖKKL) for their estimates for price increases for ship fuels (Table 3.1). The prices
given are at current levels. The fuel grades concerned are:
11
1) heavy fuel oils (sulphur content 1.0 % and 0.5 %)
2) light fuel oil (sulphur content 0.1 %)7.
One should always exercise caution when predicting future prices for fuels, as there are
so many variables involved. Besides, price trends are not so much based on facts as all
the various expectations and beliefs concerning the future. It may be that only a few
refineries will specialise in the manufacture of lower sulphur fuels. If future demand
should exceed supply, price differentials may be even greater than the estimates here.
Furthermore, if prices go up, sulphur levels might also be lowered by mixing middle
distillates with a quantity of heavy fuel, which will also affect future fuel prices. Uncertainty and the massive fluctuations in fuel prices (Figure 3.1) we have witnessed have
led us in this report to give fuel prices that are not based on any precise value but a
probable range of variation on the basis of estimates by the member companies of the
Finnish Oil and Gas Federation (Table 3.1). For the sake of comparison, we can say that
the average price for heavy fuel oil presently used globally (sulphur content 2.6–2.7%)
at the start of 2009 (24.12.2008–25.2.2009) in Rotterdam was around 173 euros a tonne
(Petromedia Ltd. 2009; Bank of Finland 2009).
Fuel prices (Rotterdam)
1400
1200
Price (USD/t)
1000
800
600
400
200
30
.0 7
.2 0
07
29
.0 8
.2 0
07
28
.0 9
.2 0
07
28
.1 0
.2 0
07
27
.1 1
.2 0
07
27
.1 2
.2 0
07
26
.0 1
.2 0
08
25
.0 2
.2 0
08
26
.0 3
.2 0
08
25
.0 4
.2 0
08
25
.0 5
.2 0
08
24
.0 6
.2 0
08
24
.0 7
.2 0
08
23
.0 8
.2 0
08
22
.0 9
.2 0
08
22
.1 0
.2 0
08
21
.1 1
.2 0
08
21
.1 2
.2 0
08
20
.0 1
.2 0
09
0
Date
IFO380 (USD/t)
LS380 (USD/t)
MGO (USD/t)
MDO (USD/t)
SECA 2 by EU
SECA 2 by IMO
Figure 3.1. Recent fluctuations in the price of fuel (see Appendix). In the diagram LS (Low Sulphur) is heavy fuel oil used in the SECA areas (meets the current 1.5 % requirement for sulphur
content). MDO and MGO are light fuel oils, of which MGO is the only one that contains less
than 0.1% sulphur (MDO is also available in Finland; it has a sulphur content of less than
0.1%). IFO (intermediate fuel oil) is heavy fuel oil that may contain 4.5% sulphur. 380 is the
fuel’s viscosity.
7
ÖKKL member companies were also asked for estimates of the price and availability of light fuel oil
(sulphur content 0.5%), but this fuel grade is still unknown to suppliers of fuel. Light fuel oil with a
maximum sulphur content of 0.1% is, to all intents and purposes, gas oil.
12
Table 3.1. Estimated price differentials8 for low sulphur fuel grades in relation to the fuel grade
currently in use (maximum sulphur contents in brackets)
Fuel grade
Current heavy fuel oil (1.5%)
Price € per
tone
Differential €
per tonne
Differential expressed as a
percentage
271
Heavy fuel oil (1%)
290–330
+19–59
7–22 %
Heavy fuel oil (0.5%)
305–350
+34–79
13–29 %
Light fuel oil (0.1 %)
470–500
+199–229
73–85 %
The estimated fuel prices help calculate the new fuel and vessel costs for the various
vessel types (Tables 3.2 and 3.3). Fuel costs will rise and their share of overall vessel
costs will increase. It is worth noting that the switch from heavy fuel oil to light fuel oil
will at the same time give rise to a very substantial rise in costs. Light fuel costs will be
considerably higher in all vessel types as compared to heavy fuel if the price estimates
for fuel grades used in this survey prove correct.
This will also affect global navigation when the global switch to fuel with 0.5% sulphur
content in 2020 or no later than 2025 takes place. According to a report by the IMO
(2008), the use of heavy fuel oil grades will mainly need to be abandoned when the sulphur content limit for fuel is less than 1%, necessitating a switch to light fuel grades. An
alternative, however, is the use of sulphur scrubbers, which would allow the use of current fuel grades.
The USA and Canada will present a proposal to the IMO in 2009 to have their sea areas,
which extend 200 nautical miles from their coastlines, designated as special areas with
regard to the sulphur content regulations in the new Annex VI to the MARPOL Convention. In this report it has not yet been possible to take account of the change to the
demand and availability of low sulphur fuel this would cause.
8
Given here is the three-year (2006-2008) average for fuel prices and the changes estimated with reference to that, and not the price for any single day.
13
Table 3.2. Effect of the minimum and maximum estimated price rise for fuel (See Table 3.1) on the day-to-day running costs of container vessels.
Vessel type
Container vessels
Fuel costs € per
travel day
Percentage
increase
24,200
Vessel costs €
per travel day
Percentage
increase
36,000
Fuel costs
€/TEU per
travel day
Percentage
increase
15.62
Vessel costs
€/TEU per travel
day
Percentage
increase
23.24
- Heavy fuel oil 1%
25,900-29,400
7 - 22 %
37,700-41,200
5 - 15 %
16.64 - 18.78
6 - 20 %
24.21 - 26.29
4 - 13 %
- Heavy fuel oil 0.5 %
27,200-31,200
12 - 29 %
39,000-43,000
8 - 20 %
17.44 - 19.84
12 - 27 %
24.99 - 27.33
8 - 18 %
- Light fuel oil 0.1 %
41,900-44,600
73 - 84 %
53,700-56,400
49 - 57 %
26.20 - 27.78
68 - 78 %
33.56 - 35.12
44 - 51 %
Container feeder vessels
15,081
23,184
12.73
19.56
- Heavy fuel oil 1%
16,100-18,400
7 - 22 %
24,200-26,500
5 - 14 %
13.61 - 15.49
7 - 22 %
20.45 - 22.32
5 - 14 %
- Heavy fuel oil 0.5 %
17,000-19,500
12 - 29 %
25,100-27,600
8 - 19 %
14.31 - 16.42
12 - 29 %
21.15 - 23.26
8 - 19 %
- Light fuel oil 0.1 %
26,100-27,800
73 - 84 %
34,200-35,900
48 - 55 %
22.06 - 23.46
73 - 84 %
28.89 - 30.30
48 - 55 %
14
Table 3.3. Effect of the minimum and maximum estimated price rise for fuel (See Table 3.1) on the day-to-day running costs of vessels.
Vessel type
Conventional dry cargo vessels
Fuel costs € per
travel day
Percentage
increase
6,400
Vessel costs €
per travel day
Percentage
increase
12,300
Fuel costs
€/TEU per
travel day
Percentage
increase
0.67
Vessel costs
€/TEU per travel
day
Percentage
increase
1.29
- Heavy fuel oil 1%
6,900-7,800
7 - 22 %
12,800-13,700
4 - 11 %
0.72 - 0.81
7 - 21 %
1.33 - 1.42
3 - 10 %
- Heavy fuel oil 0.5 %
7,200-8,300
12 - 29 %
13,100-14,200
7 - 15 %
0.75 - 0.86
12 - 27 %
1.37 - 1.47
6 - 14 %
11,100-11,800
73 - 84 %
17,000-17,700
38 - 44 %
1.14 - 1.20
69 - 79 %
1.74 - 1.80
35 - 40 %
- Light fuel oil 0.1 %
Dry bulk vessels
10,400
19,000
0.29
0.53
- Heavy fuel oil 1%
11,100-12,600
7 - 22 %
19,800-21,300
4 - 12 %
0.31 - 0.35
7 - 21 %
0.55 - 0.59
4 - 11 %
- Heavy fuel oil 0.5 %
11,600-13,000
12 - 29 %
20,300-22,000
7 - 16 %
0.33 - 0.37
12 - 27 %
0.57 - 0.65
7 - 15 %
17,900-8,600
73 - 84 %
26,600-30,100
40 - 46 %
0.50 - 0.70
72 - 83 %
0.74 - 0.77
39 - 44 %
- Light fuel oil 0.1 %
Tankers
- Heavy fuel oil 1%
10,100
10,800-12,300
21,700
7 - 22 %
22,300-23,800
0.40
3 - 10 %
0.43 - 0.48
0.86
6 - 20 %
0.88 - 0.93
3-8%
15
- Heavy fuel oil 0.5 %
11,400-13,000
12 - 29 %
22,900-24,500
6 - 14 %
0.45 - 0.51
11 - 26 %
0.90 - 0.95
5 - 11 %
- Light fuel oil 0.1 %
17,500-18,600
73 - 84 %
29,000-30,100
34 - 39 %
0.66 - 0.70
65 - 74 %
1.10 - 1.13
28 - 32 %
Ro-ro vessels
- Heavy fuel oil 1%
- Heavy fuel oil 0.5 %
- Light fuel oil 0.1 %
Car and passenger ferries
14,600
29,300
1.70
3.41
15,600-17,800
7 - 22 %
30,300-32,400
3 - 11 %
1.82 - 2.06
7 - 21 %
3.53 - 3.77
3 - 10 %
16,400-8,800
12 - 29 %
31,100-33,500
6 - 14 %
1.91 - 2.19
12 - 29 %
3.62 - 3.89
6 - 14 %
25,300-26,900
73 - 84 %
39,900-41,600
37 - 42 %
2.92 - 3.11
72 - 83 %
4.62 - 4.80
35 - 41 %
41,200
95,400
- Heavy fuel oil 1%
44,000-50,100
7 - 22 %
98,300-104,300
3-9%
- Heavy fuel oil 0.5 %
46,300-53,100
12 - 29 %
100,500-107,400
5 - 13 %
- Light fuel oil 0.1 %
71,300-75,900
73 - 84 %
125,600-130,100
32 - 36 %
16
3.3 Fuel availability
Member companies of the Finnish Oil and Gas Federation (ÖKKL) were also asked to
assess the future availability of the fuel grades examined, after the new legal instruments pertaining to sulphur oxides emissions enter into force. Individual shipping companies were also asked about the current and future availability of fuel grades. However,
neither the ÖKKL members nor the shipping companies were able to estimate future
availability with any degree of certainty, as there were so many factors to consider, such
as demand, price, the general situation with regard to shipping, etc.
For a long time now, large car and passenger ferries on the Baltic Sea have been using
heavy fuel oil with a sulphur content of no more than 0.5%. However, there is not
enough of it as things are now – and the situation may not change in the future either to meet the needs of all maritime traffic in the Baltic, North Sea and English Channel. A
report by the IMO states that approximately 0.5% of the fuel currently used by global
marine traffic is heavy fuel oil with a sulphur content of less than 0.5% (Figure 3.2).
According to the report, the use of heavy fuel oil grades will mainly need to be abandoned, as the sulphur content limit for fuel is less than 1%, necessitating a switch to
light fuel grades. Accordingly, it is also difficult to estimate the future price of heavy
fuel oil with a maximum sulphur content of 0.5%.
25
19,08
18,89
20
20,23
% of samples
13,89
15
11,28
9,34
% 10
4,71
5
2,06
0,51
0,02
0,00
0
0 - 0,5 0,5 - 1,0 1,0 - 1,5 1,5 - 2,0 2,0 - 2,5 2,5 - 3,0 3,0 - 3,5 3,5 - 4,0 4,0 - 4,5 4,5 - 5,0 5,0 - 6,0
Sulphur content % m/m
Figure 3.2.Tthe sulphur content of heavy fuel grades used by ships (global marine traffic;
196,925 samples) (IMO 2009)
Heavy fuel oil containing less than 0.5% sulphur is obtained from crude oil with a sulphur content that is clearly less than 0.5%. Heavy fuel oil is distillation residue oil,
which remains when grades of light fuel oil have been produced from crude oil. Most of
the sulphur remains in the heavy fuel oil, so sulphur-rich crude cannot possibly be used
to produce heavy fuel oil containing less than 0.5% sulphur. In practice, of the grades of
crude oil shown in figure 3.3 below, heavy fuel oil containing less than 0.5% can only
possibly be obtained from Daqing (China), Bonny Lt. (Nigeria), Brent (UK) and WT
(USA).
17
Figure 3.3. The sulphur content of some grades of crude oil. Source:
http://www.fxstreet.com/education/related-markets/oil-basis-grades-of-crude-oil/200812-10.html
In practice, it is not possible to extract sulphur from heavy fuel oil using current methods, because the metallic impurities in heavy fuel oil, such as vanadium and nickel, despite their very low content on the whole, prevent the use of the sulphur extraction systems employed for the lighter fractions in the oil refinement process for the removal of
sulphur in heavy fuel oil, as they poison the sulphur extraction catalysts. For that reason,
low-sulphur heavy fuel oil is only normally produced from low sulphur crude oil
(source: Fortum Oyj, Raskaan polttoöljyn käyttöopas (Heavy Fuel Oil Guide), 2002,
chapter 1.4.1).
A switch to fuel with a maximum sulphur content of 0.1% will in practice mean that
vessels will have to use gas oil (MGO) as fuel, which is a lot more expensive than
heavy fuel oils, owing to the way it is manufactured. Similarly, the switch to 0.5% fuel
will also in practice mean using diesel oil, or light fuel oil, containing 0.5% sulphur
(Figure 3.4).
It has proven difficult to estimate the availability of low-sulphur fuels. Estimates received suggest that the problems will not be owing to the demands on SECA areas, at
least not yet, but to the fact that when light fuels start to be used worldwide, the oil industry will have to increase its refining capacity considerably to meet the rise in demand
for light fuel grades.
The legal instruments pertaining to sulphur content in the special areas that differ from
global requirements have also led to the concern that it would be difficult for vessels
18
arriving from outside these areas to operate their services for technical reasons connected with their engines and that the volume of direct, long-haul traffic would fall.
It is difficult to estimate future prices for fuels and predict what grades will be available.
Figure 3.4. Forecast for the trend in the demand for fuel oil grades (see Appendix 2).
19
4
INVESTMENT IN AND USE AND TOTAL COSTS OF SULPHUR
SCRUBBERS
Annex VI of the MARPOL 73/78 Convention allows the after-treatment of exhaust
gases as an alternative to low sulphur fuel. There is plenty of experience of removing
sulphur from exhaust gas when it comes to energy plants on land, but up till now very
little in connection with the equipment installed in ships.
Cleaning the sulphur from ship exhaust is an option, the good sense and economics of
which will grow in importance as the price differential between high sulphur (sulphur
content over 1.5%) and low sulphur (sulphur content, e.g. 0.5% and 0.1%) increases. It
should be remembered that, if a sulphur scrubber is used, it will be possible to use fuel
with over 1.5% sulphur content even in the Baltic Sea, so increasing the price differential. It may also be assumed that the price differential will grow in the future as the demand for low sulphur fuel oil increases.
Hitherto, ships sailing in the Baltic Sea have not made use of sulphur scrubbers, but the
first equipment suited to the Baltic is being trialled on M/T Suula in an auxiliary engine.
In this report we were unable to produce any calculations of the benefits of the equipment in terms of savings in fuel costs.
There are at present basically two types of sulphur scrubber suitable for ships: the seawater scrubber and the freshwater scrubber. In both cases, the extracted sulphur is conducted into the sea.
The seawater scrubber’s principle of operation is to pass the exhaust gas through seawater. The seawater absorbs the sulphur compounds (and any other impurities, such as
particulate matter and heavy metals). The effectiveness of this method relies on the
seawater’s alkalinity, and so in waters low in salt, such as the Baltic, a lot more seawater has to be used than in the oceans. The sulphur washed out of the exhaust is conducted into the sea along with the wash water.
The freshwater scrubber’s (see Appendix) ability to clean and to neutralise sulphur oxides relies on maintaining the water’s pH, using a lye solution. The wash water’s pH in
a closed loop is kept close to neutral throughout the process and the quality of the seawater does not affect the effectiveness of the cleaning operation. During the process the
sulphur’s oxides are neutralised and converted into harmless sulphates, which fall into
the sea with the wash water. The pH of the cleaned wash water that falls into the sea is
neutral and thus barely differs from the pH of seawater.
Sulphur scrubber wash waters are pumped into the sea through separate purification
plants, where the oil (hydrocarbons) and other impurities are separated. The separated
sludge is similar to that from the engine room and can thus be left in the port. Ports will
therefore have to prepare to receive sulphur scrubber waste from ships.
Uncleaned sulphur scrubber wash water might pose an environmental risk, in the form,
say, of heavy metals, oil, nitrous compounds and the pH of wash water, which can differ
significantly from that of seawater. Wash water may have an adverse impact on the environment, particularly in ports and harbours, river deltas, other narrow and shallow
waterways and channels, and in archipelagos, especially if the use of sulphur scrubbers
20
becomes common. On the other hand, sulphur scrubbers remove harmful compounds
from exhaust, which would otherwise pass through the atmosphere and end up polluting
the environment with no controlled capture system in place. To minimise the risk to the
environment, the IMO has specified criteria for the quality of wash water falling into the
sea and for continued monitoring.
A sulphur scrubber can be installed in existing ships and new ones on certain conditions. The greatest challenge is probably the cleaning efficiency of the unit and its size,
which is in proportion to how efficient it is. The need for space for the cleaning equipment on board ship might in some cases make it a doubtful investment in terms of the
ship’s earnings potential. Installing the equipment in existing vessels would naturally be
a much more complex task than with new ships, where the necessary spatial solutions
could be reckoned with at the planning stage.
For the purposes of this report, representatives of Wärtsilä were interviewed, and they
supplied the information appended to it. There are only a few manufacturers of sulphur
scrubbers and no more exact survey of the number of suppliers was conducted in this
study.
21
5 AN ESTIMATE OF TOTAL COSTS TO FINNISH MARINE TRAFFIC
On the basis of the costs of fuel and sulphur scrubbers, an estimate can be made of the
additional costs of the various options to Finland’s foreign traffic by multiplying the rise
in the price of fuel by the volume of fuel required to meet Finnish marine transport
needs.
This survey makes use of the list of ships supplied by the Finnish Maritime Administration (1, 437 in all) that paid waterway charges to Finland in 2007. The vessels are examined more closely in Table 5.1, which divides them according to type. A separate estimate of fuel consumption for each ship was made for the year 2007, with reference to
the estimates produced for the Baltic Sea area by the Helsinki Commission’s (HELCOM’s) ShipNODep project. In the project, the fuel consumption for every ship operating in the Baltic Sea was estimated separately for both the main engines and auxiliary
engines.
A total of 1.081 of the ships paying fairway dues to Finland called at ports in the North
Sea in 2007. This is evident from the statistical data from the HELCOM AIS server.
The North Sea is also a SECA area, so the fuel consumption for the ship in question has
to be added to the amount of fuel used by the ship in the Baltic Sea.
Table 5.1.Breakdown of the vessels that paid fairway dues to Finland in 2007
Ship type
Number
Passenger vessel (including car and passenger ferries)
34
Cruise ship
61
High speed craft
Roll-on roll-off ship
Bulk carrier
7
151
86
Other dry bulk carriers
793
Tanker
266
Other vessels
39
Total
1.437
Ships that crossed the North Sea
1.081
Ships sailing under the Finnish flag
108
The hypothetical values used in calculating fuel consumption are set out in Table 5.2.
The average travel time and the ship’s engine data (see Formula 3) are used to estimate
the amount of fuel consumed in the North Sea. The average power consumption for the
vessels is 80% of the total engine power.
Scenario 1 is a calculation method where the variables have been chosen so that the
result obtained is the highest estimate for fuel consumption (maximum scenario). In
scenario 2 the variables have been chosen so that the estimated fuel consumption obtained is the ‘minimum estimate’. The “average” (expert opinion) scenario has been
used to establish the best estimate given in the results for the additional costs due to
sulphur legislation. The variables used in the calculation for the different scenarios are
set out in Table 5.2. On the basis of scenarios 1 and 2 the maximum and minmum fuel
22
consumption in the SECA area is obtained. The actual fuel consumption is assumed to
lie somewhere between these.
Table 5.2. Hypothetical values used in calculating fuel consumption. The values in Table 3.1
have been used as the price estimates
Price of fuel (euros)
Average (expert’s estimate)
Scenario
1
Scenario
2
Price of gas oil (MGO)
500
470
485
Price of heavy fuel oil (LS380 1.5 %-S)
Price differential between heavy fuel oil (LS380
1.5 %-S) and MGO (see Table 3.1)
271
271
271
229
199
214
Travel time in the North Sea (days)
10
2
4
Travel time in the Baltic Sea (tBaltic, days)
10
4
7
It should be remembered, however, that it is not possible to estimate the additional cost
to Finland in respect of the total fuel cost (for the vessels in question): instead, what
needs to be calculated is the share of fuel consumption by one single ship in connection
with Finnish imports and exports. In this survey we have worked on the assumption that
the ships should be given a factor of K (see Formula 1), which determines the share of
fuel consumption to be allocated to Finland. The basic assumption is one for all ships
that came to Finland more than 30 times or whose total consumption in the Baltic Sea is
less than 100 tonnes per one trip to Finland in 2007. In other cases fuel consumption is
calculated as in Formula 2.
Formula 1: K = NumberofvisitstoFinland *
Peng * 0.8 * S * t Baltic
Consumption Baltic
Where:
K = allocation factor to calculate share of total fuel consumption of significance for
Finland for the ship in question
Peng = total engine power for ship
S = consumption factor of 180 g/kWh
tBaltic = the time a ship needs to get to a Finnish port from the Danish Straits and back
ConsumptionBaltic = the ShipNODep project’s estimated consumption for a given ship in
the Baltic Sea area in 2007
23
Formula 2:
Ship X’s share of fuel allocated to Finland
K * (ConsumptionBaltic + ConsumptionNorth Sea)
Formula 3:
ConsumptionNorth Sea = Number of trips in North Sea * Peng * 0.8 * tNorth Sea
The number of trips in the North Sea is restricted, being no more than the number of
trips to Finland
Formula 1 is used to establish factors for ships visiting Finland fewer than 30 times,
which ensures the overall allocation of consumption is sufficiently accurate. Table 5.3
gives estimates for fuel consumption and the additional costs for the different scenarios,
if it is assumed that vessels will switch from heavy fuel oil to light fuel oil (i.e. gas oil
[MGO]).
24
Table 5.3. Estimated fuel consumption and additional costs for the different scenarios. The additional cost estimates are based on the hypothetical values for the price of fuel in Table 5.2.
Scenario 1
Ship types
Passenger vessel
Cruise ship
High speed craft
Roll-on roll-off ship
Bulk carrier
Other dry bulk carriers
Tanker
Other vessels
Total
Scenario 1
Ship types
Passenger vessel
Cruise ship
High speed craft
Roll-on roll-off ship
Bulk carrier
Other dry bulk carriers
Tanker
Other vessels
Total
Average estimate (by
expert)
Ship types
Passenger vessel
Cruise ship
High speed craft
Roll-on roll-off ship
Bulk carrier
Other dry bulk carriers
Tanker
Other vessels
Total
All ships paying fairway dues to
Finland
estimate of addifuel consumptional cost in
tion (tonnes)
euros
452,776
98,501,422
173,831
37,817,042
25,625
5,574,797
751,849
163,564,714
56,865
12,370,966
798,854
173,790,727
308,217
67,052,621
24,945
5,426,775
2,592,963
564,099,065
Ships sailing under the
Finnish flag
fuel conestimate of
sumption
additional
(tonnes)
cost in euros
226,527
49,280,984
472
102,757
0
0
175,135
38,100,713
28,654
6,233,611
55,608
12,097,558
57,271
12,459,414
23,468
5,105,523
567,137
123,380,560
All ships paying fairway dues to
Finland
estimate of additional cost in
fuel consumption (tonnes)
euros
452,201
85,488,639
76,366
14,437,076
25,625
4,844,475
572,659
108,261,126
35,727
6,754,101
475,975
89,983,032
144,078
27,237,894
22,429
4,240,264
1,805,060
341,246,607
Ships sailing under the
Finnish flag
fuel conestimate of
sumption
additional
(tonnes)
cost in euros
225,952
42,716,293
248
46,958
0
0
126,914
23,993,129
23,144
4,375,381
38,676
7,311,668
27,033
5,110,562
21,946
4,148,829
463,913
87,702,821
All ships paying fairway dues to
Finland
estimate of addifuel consumptional cost in
euros
tion (tonnes)
452,345
91,961,721
118,843
24,160,839
25,625
5,209,636
629,915
128,061,628
43,478
8,839,005
608,468
123,701,500
213,596
43,424,048
23,300
4,736,964
2,115,570
430,095,340
Ships sailing under the
Finnish flag
fuel conestimate of
sumption
additional
(tonnes)
cost in euros
226,096
45,965,329
304
61,880
0
0
144,490
29,374,856
24,725
5,026,628
44,153
8,976,256
38,563
7,839,935
22,457
4,565,605
500,789
101,810,489
25
Figures 5.1 and 5.2 give the fuel consumption for the different vessel types. Depending
on the calculation method used, total fuel consumption for ship traffic connected with
Finnish imports and exports in 2007 was between 1.8 and 2.6 million tonnes. Of this,
ships sailing under the Finnish flag accounted for 0.46–0.57 million tonnes. Fuel consumption is given in Table 5.3 above.
3 000 000
2 500 000
Tonnes
2 000 000
Scenario 1
Average estimate (by expert)
1 500 000
Scenario 2
1 000 000
500 000
ta
l
To
ls
se
er
dr
y
O
th
er
v
es
nk
er
rs
Ta
rri
e
er
ca
bu
Bu
ol
l-o
n
lk
lk
ca
r ri
hi
p
ff
s
af
t
ro
l
ee
l- o
d
cr
sh
ip
sp
O
th
R
Pa
H
ss
ig
h
C
en
g
er
ru
ise
ve
ss
el
0
Figure 5.1. Fuel consumption for ships paying fairway dues to Finland by vessel type
600 000
500 000
Tonnes
400 000
Scenario 1
Average estimate (by expert)
Scenario 2
300 000
200 000
100 000
ta
l
To
ls
ss
e
ve
er
rs
nk
er
Ta
O
th
dr
y
bu
lk
ca
rri
e
er
ca
r ri
hi
p
Bu
lk
O
th
er
R
ol
l-o
n
ro
l
ed
cr
l- o
ff
s
af
t
ip
sh
ig
h
sp
e
ru
ise
C
H
Pa
ss
en
g
er
ve
s
se
l
0
Figure 5.2. Fuel consumption for ships sailing under the Finnish flag paying fairway dues to
Finland by vessel type
26
The additional costs to the different vessel types are illustrated in Figures 5.3 and 5.4.
The estimates for additional costs take account of the impact on costs when fuel grades
change from heavy fuel oil with a 1.5% sulphur content to light fuel oil with a 0.1%
content. The additional cost estimates for the different scenarios are based on the hypothetical value of fuel in Table 5.2.
600 000 000
500 000 000
Euros
400 000 000
Scenario 1
Average estimate (by expert)
Scenario 2
300 000 000
200 000 000
100 000 000
ta
l
To
s
O
th
R
er
d
ry
O
th
er
ve
ss
el
nk
er
Ta
rri
er
s
er
Bu
ol
l-o
n
ca
ca
r ri
hi
p
lk
l- o
ro
l
bu
lk
cr
d
ff
s
af
t
ip
sh
Pa
H
ss
ig
h
sp
ee
ru
ise
C
en
g
er
ve
ss
el
0
Figure 5.3. Estimated additional cost to ships paying fairway dues to Finland for switching
from heavy fuel oil to gas oil by vessel type; the restrictions are to take effect in stages after
2015
140 000 000
120 000 000
Euros
100 000 000
80 000 000
Scenario 1
Average estimate (by expert)
60 000 000
Scenario 2
40 000 000
20 000 000
ta
l
To
ls
se
er
ve
s
nk
Ta
O
th
y
er
dr
er
rs
ca
rri
e
er
ca
r ri
lk
bu
lk
hi
p
ff
s
l-o
ro
l
Bu
cr
ed
ol
l-o
n
R
O
th
af
t
ip
sh
ig
h
sp
e
ru
ise
C
H
Pa
ss
en
g
er
ve
ss
el
0
Figure 5.4. Estimated additional cost to Finnish ships paying fairway dues to Finland for
switching from heavy fuel oil to gas oil by vessel type; the restrictions are to take effect in
stages after 2015
27
Figures 5.5-5.8 illustrate the impacts of the price difference between heavy fuel oil and
gas oil on additional costs. The additional cost estimates for the different scenarios are
based on the hypothetical values for the price of fuel in Table 5.2.
Estimate of additional costs (euros)
1 000 000 000
800 000 000
Estimate for maximum
additional cost
600 000 000
Linear (Scenario 2)
Linear (Scenario 1)
Estimate for minimum
additional cost
400 000 000
200 000 000
0
0
50
100
150
200
250
300
350
400
Price differential between heavy fuel oil and MGO
(euros)
Figure 5.5. Effect of the price differential on additional costs to ships paying fairway dues to
Finland and switching from heavy fuel oil to gas oil
Estimate of additional costs (euros)
200 000 000
150 000 000
Estimate for maximum
additional cost
Linear (Scenario 2)
100 000 000
Linear (Scenario 1)
Estimate for minimum
additional cost
50 000 000
0
0
50
100
150
200
250
300
350
400
Price differential between heavy fuel oil and MGO
(euros)
Figure 5.6. Effect of the price differential on additional costs to Finnish ships paying fairway
dues to Finland and switching from heavy fuel oil to gas oil
28
Estimate of additional costs (euros)
1 400 000 000
1 200 000 000
Price differential in
May 2008 was
approximately 480€
1 000 000 000
Linear (Scenario 2)
800 000 000
Linear (Scenario 1)
600 000 000
400 000 000
Price differential on
9.3.2009 was 111€
200 000 000
0
0
100
200
300
400
500
Price differential between heavy fuel oil and MGO
(euros)
Figure 5.7. Estimated additional cost at the current price differential level (9.3.2009) and at
that for May 2008, when the differential was at its highest
Estimate of additional costs (euros)
300 000 000
250 000 000
200 000 000
Price differential in May 2008
was approximately 480€
Linear (Scenario 2)
150 000 000
Linear (Scenario 1)
100 000 000
50 000 000
Price differential on 9.3.2009
was 111€
0
0
100
200
300
400
500
Price differential between heavy fuel oil and MGO
(euros)
Figure 5.8 Estimated additional cost at the current price differential level (9.3.2009) and at that
for May 2008, when the differential was at its highest (ships sailing under the Finnish flag)
These calculations do not take account of how much the additional costs will affect traffic bound for areas outside the SECA areas if the fuel switch on a vessel is not possible
for certain reasons and if it also has to use more expensive low-sulphur fuel outside the
SECA areas. Neither do they take account of any alternative scenario, whereby longhaul carriers might be reloaded in a European port outside the SECA areas and which
allows entry of vessels using sulphur-rich fuel. And, furthermore, the calculations do
29
not take account of the savings in fuel costs though the possible use of sulphur scrubbers, adapted to deal with the conditions in the Baltic Sea.
30
6 EFFECT OF THE ESTIMATED PRICE RISE IN FUEL ON FREIGHT
CHARGES AND ON CERTAIN SECTORS
A vessel’s charter party contract determines who pays for the fuel it uses (Table 6.1). If
the vessel is in the service of the shipping company that owns it, the shipping company
pays all the costs, including fuel. A shipping company that has entered into in a time
charter agreement leases the vessel to a charterer at a certain price for a given period of
time. The time charterer pays the operational costs of the service, including fuel costs,
and the shipping company pays the day-to-day running costs. A voyage charter agreement concerns the transportation of cargo from a port of loading to a port of discharge,
and in this case the shipping company pays not just the day-to-day running costs but
also the transportation costs, including fuel. With a bareboat charter agreement, the
shipping company is only responsible for the vessel’s capital outlay as well as certain
insurance premiums, and all other costs are the responsibility of the charterer (Karhunen
et al 2004.)
Table 6.1. Responsibility for fuel costs in charter agreements.
Charter agreement type
Time charter
Voyage charter
Bareboat charter agreement (vessel hire)
Responsible for fuel costs
Charterer
Shipping company
Charterer
Freight charges here are being examined from the perspective of transportation costs.
The expert views obtained from shipping companies and the Confederation of Finnish
Industries associations suggest that rising fuel costs will, at least in time, be incorporated in their entirety in sea freight charges.9 Table 6.2 gives examples of by how much
transportation costs10 for certain types of freight will rise as a percentage per transported
tonne or per TEU. Freight charges for bulk cargo transported on container ships and dry
bulk carriers can expect to see the greatest percentage increase. It is worth noting that
this estimate suggests that the effect on the rise in freight charges of the switch from
heavy fuel oil to light is major. This will have a particularly adverse impact on export
sectors located far away from the main markets. Shipping companies have also expressed the concern that excessively high fuel prices might lead to a modal switch to
other transport modes.
For example, around 49% of container traffic (excluding traffic in transit [total = 59%])
in Finnish waters is traffic between Finland and countries outside Europe (in container
tonnes 23% and in container exports 70%) (Venäläinen 2008: 7–9). Containers are
mainly imported on ocean-going vessels into ports in continental Europe, such as Rotterdam and Hamburg, where they are reloaded onto container feeder vessels for transportation to Finland. Similar transport chains are employed for exports, but going in the
other direction.
9 Despite trying to do so in a short space of time, no one could describe in detail how much fuel costs
would account for the various freight charges associated with different types of freight
The example freight types are divided according to transportation vessel type, so here the focus of
investigation is the estimated increase in vessel costs per tonne/TEU (cf. Tables 3.2 and 3.3)
10
31
Table 6.2.Effects of the estimated price rise in fuel on freight charges (percentage increase on
current levels).
Sulphur content
Freight type
1.0 %
0.5 %
Container
4–13 %
8–18 %
44–51 %
Paper reel
3–10 %
6–14 %
35–40 %
Lorry
3–10 %
6–14 %
35–41 %
Private car
3–10 %
6–14 %
35–41 %
3–8 %
5–11 %
28–32 %
Freight tonne on bulk carriers
4–11 %
7–15 %
39–44 %
Timber
3–10 %
6–14 %
35–40 %
Steel products
3–10 %
6–14 %
35–40 %
Oil
0.1 %
Next we examine the effects of the estimated price rise in fuel separately for various
sectors. The estimated additional costs to Finnish industry (reckoned here to be around
430 million euros) have been broken down by sector and the percentage in tonnes for
exports and imports are given for each sector (Table 6.3)11. Imports account for 58% of
all transportation and exports for 42% (Finnish Maritime Administration 2007), which
has been taken into account in calculating the sector’s share of total maritime traffic. It
would seem that costs would go up in the forest and metal industries especially. The
large share ‘other services’ have of overall tonnage is explained by the fact that here
electricity, gas and water supply are being included in the sector.
Table 6.3. Estimated share of the tonnage of Finland’s foreign trade in terms of maritime traffic
expressed as a percentage by sector and estimated additional costs due to the estimated rise in
the price of fuel calculated on the basis of this distribution
Sector
Exports Imports Total
Estimated additional cost
Agriculture
0.0 %
0.7 %
0.41 %
1,763,994
Forestry
0.0 %
0.0 %
0.00 %
382
Mining
4.7 %
0.0 %
2.02 %
8,668,913
Construction
0.9 %
8.1 %
5.02 %
21,581,213
Forest industry
51.5 %
9.5 %
27.64 %
118,890,562
Metal industry
9.1 %
18.4 %
14.36 %
61,776,307
Technology industry
0.4 %
0.4 %
0.43 %
1,838,810
24.1 %
6.8 %
14.22 %
61,169,232
Food industry
3.1 %
2.1 %
2.51 %
10,812,674
Other industry
Commerce and
trade
3.7 %
2.3 %
2.89 %
12,416,636
2.3 %
6.9 %
4.92 %
21,153,124
Other services
0.2 %
44.9 %
25.58 %
110,023,494
Total
100 %
100 %
100 %
430,095,340
Chemical industry
11The percentage shares the sectors have were calculated by dividing the amounts for tonnes or euros in
2007 for types of goods in National Board of Customs foreign trade statistics (SITC 3) for a given sector
or certain sectors on the basis of expert opinions.
32
7 ENVIRONMENTAL IMPACT AND EFFECTS ON HUMAN HEALTH OF
THE SULPHUR CONTENT OF FUEL
7.1 Sulphur dioxide
Sulphur is everywhere in the atmosphere, the most common sulphur compounds being
H2S, CH3SCH3, CS2, OCS and SO2. Of these, it is sulphur dioxide (SO2), obtained in
the fuel combustion process in energy production and in industrial processes, that is not
only harmful to human health but is also an important nutrient. Sulphur emission levels
have been falling in Finland, and this is observed everywhere in the country in the shape
of lower sulphur dioxide content of the air and decreased sulphur fallout, both at background stations and traffic and industrial monitoring stations in cities.
Currently the sulphur dioxide content can typically rise locally and for a short time
when there is industrial disruption or malfunction. But in recent years sulphur dioxide
levels in Finland have remained under the limit values imposed to protect health.
Gaseous SO2 oxidises in the atmosphere to become sulphuric acid and sulphates,
mainly via a hydroxyl radical, at a rate that is the equivalent of an average lifetime of
around a week. Aqueous phase oxidation, e.g. in a cloud, is a much faster process. SO2
very effectively passes out of the atmosphere through a process of dry and wet deposition, so it also has a local fallout range, unlike NO2, which mainly passes out of the
atmosphere only after it has converted into nitric acid or nitrates in atmospheric chemical reactions. The average lifetime of SO2 in the atmosphere is two days, while the lifetime of sulphate that results in the oxidation process is around five days. An important
sulphur compound in the marine environment is dimethyl sulphide (DMS, CH3SCH3)
produced from plant plankton, whose chemical lifetime in the marine environment is
several days (Hongisto 2009).
7.2 Fine particles
Fine particles get into the atmosphere during the combustion of fuel, for example. Particles with a diameter of less than 2.5 micrometres (µm) are the particles that typically
result from the combustion reaction in a diesel engine. Fine particles (PM2.5) are some
of the particles we inhale and they can be carried for up to thousands of kilometres, depending on the circumstances. When monitoring air quality, it is necessary to pay attention to the ever smaller sizes of particle, because smaller particles penetrate deep into
the respiratory tracts as we breathe. According to a study by Corbett (Corbett et al,
2007), fine particulate emissions from shipping are the cause of premature death in
62,000–64,000 people around the world each year.
Lowering the sulphur content of fuel linearly affects the mass volume of particles, as
does lowering its ash content (Figure 7.1).The new regulations under MARPOL 73/78
Annex VI will dramatically reduce particulate emissions, although they will not as yet
actually limit fine particulate emissions. To be able to set emission limits for fine particles from diesel engines, and if we want to install the same type of particulate traps as
there are in cars now, the fuel should be light fuel oil with a sulphur content of less than
0.05%. The sulphur and ash content of fuel needs to be low if the particulate trap’s oxi-
33
dation catalyst is to work properly (Hellén 2009). The IMO has not yet been prepared to
go to such low sulphur content levels, but things may well change in the future.
It has been estimated that particulate emissions for diesel engines are reduced by 60%90% mass, if the fuel grade changes from heavy fuel oil to diesel oil (MDO) (IMO
2007). In Figure 7.1 we can see how the combustion of heavy fuel oils produces far
more particles than light fuel grades. More details on the environmental impact of
MARPOL 73/78 Annex VI are to be found in the document BLG 12/INF.10/IMO 2007
(available form the Finnish Maritime Administration).
Figure 0.1 The effect of sulphur and ash content on particle volume (Hellén 2003)
7.3 The effect on air quality of lowering the sulphur content of fuel used in ships
The Helsinki Metropolitan Area Council has taken measurements of the air quality to
examine the effect of emissions from power stations. Power stations on land partly use
the same type of - and even exactly the same - diesel engines as in ships, and so they
tried to use existing data to assess the environmental impact of sulphur fallout from ship
fuel. Discussions with experts have led us to the conclusion that it is very difficult to
compare power stations with ships. Power station chimneys can be approximately 70
metres high, and the temperature and flow rate of exhaust gases determine, along with
other factors, the extent to which the compounds spread. The comparison is also made
all the harder by a general lack of information. Data on the volume and grades of fuel
used in power stations in particular is an important factor but is difficult to come by. For
that reason, more resources are needed to interpret the yearly emission reports. These
reports nevertheless reveal how the volume of sulphur oxides and particles has fallen
with more stringent legislation.
34
Recent measurements taken in Katajanokka (harbour) and the port area of Helsinki
show that sulphur emissions from ships can clearly be observed. Rising values are observed when the wind blows exhaust gas in the direction of the measurement point. A
comparison with the results of the monitoring stations at Vallila and Luukki is given in
Figure 7.2. But even at their maximum, the peaks do not reach harmful levels. The sulphur emissions from ships by the quayside in the dock area will fall when the EU regulation enters into force in 2010. Then all ships entering EU ports will have to use fuel
with a maximum sulphur content of 0.1% if they are moored there for more than two
hours. Furthermore, the increasing use of shore-side electricity will cut the emissions
from ships in the port area.
80
Vallila
Luukki
Katajanokka
SO2 tuntipitoisuus (µg/m3)
60
40
20
0
1
2
3
4
5
6
7
8
9
10
11
12
13
14
15
Hourly SO2 content (µg/m³)
Figure 0.2. Hourly SO2 content measured at Katajanokka in early 2009 compared to the monitoring stations at Luukki and Vallila.
35
8 CONCLUSIONS
According to the expert estimates of the member companies of the Finnish Oil and Gas
Federation, prices for low sulphur (light) fuel grades are and will be higher than the
price for heavy fuel oil currently being used. This being the case, the fuel and vessel
running costs for ships operating in the current special areas, i.e. the Baltic Sea, the
North Sea and the English Channel, will rise considerably as the provisions on sulphur
content of 0,1 % in the revised MARPOL 73/78 (International Convention for the Prevention of Pollution from Ships) Annex VI enter into force in 2015. This will also affect
global navigation when the global switch to fuel with 0.5% sulphur content in 2020 or
no later than 2025 takes place. The switch to light fuel oil (diesel or gas oil) will result
in a very significant rise in costs as compared to those for heavy fuel oil now in use.
It has proven difficult to assess the availability of fuel. At present, fuel availability
should not be a great problem, as the growing demand will create a supply. The USA
and Canada will present a proposal to the IMO/MEPC in July 2009 to have the sea areas
of these countries, which extend 200 nautical miles from their coastlines, designated as
special areas with regard to the new sulphur content regulations. When light fuels start
to be used worldwide, the oil industry will have to increase its refining capacity considerably to meet the rise in demand for light fuel grades.
The results of interviews with experts suggest that increased fuel costs will, in time, be
incorporated in their entirety in sea freight costs, which means that sea freight costs will
increase considerably when the tighter regulations on sulphur content take effect in
2015. Rising freight costs will particularly affect export- and/or import-oriented sectors,
such as the metal and forest industries.
The total fuel consumption for ships bound for Finland has been estimated on the basis
of two scenarios for consumption in 2007, where maximum consumption is 2.6 million
tonnes (scenario 1) and minimum consumption is 1.8 million tonnes (scenario 2). The
estimate is that if vessels bound for Finland were to switch from heavy to light fuel - in
this case gas oil with a maximum sulphur content of 0.1% - the following additional
costs would be incurred given the differential in prices for fuel grades:
3) at 111 euros per tonne the maximum would be 273 million euros and the minimum 190 million euros
4) at 480 euros per tonne the maximum would be 1.182 million euros and the
minimum 823 million euros
These calculations do not take account of how much the additional costs would be if
long-haul carriers (bound for destinations outside the SECA areas) also had to use lowsulphur fuel outside the SECA areas for technical reasons. Neither do they take account
of the savings in fuel costs through the possible use of sulphur scrubbers, adapted to
deal with the conditions in the Baltic Sea.
The calculations made in this report are of a type that can serve as a good basis and
starting point in the future when the figures are being updated in the light of new information, estimates and assessments.
36
SOURCES
Corbett, J.J., Winebrake, J.J., Green, E.H., Kasibhatla, P., Eyring, V., & Lauer, A.
(2007). Mortality from Ship Emissions: A Global Assessment. Environmental Sci.
Technol. American Chemical Society published on Web, 11/05/2007.
Fortum Oyj (2002). Raskaan polttoöljyn käyttöopas (Heavy Fuel Oil Guide).
Hellén, G. (2003). Guide to diesel exhaust emissions control. Marine News 2003:2.
Hellén, G. (2009). Wärtsilä Oy. Personal communication.
Hongisto, M. (2009). Finnish Meteorological Institute. Personal communication.
IMO, International Maritime Organization (2007). Input from the four subgroups and
individual experts to the final report of the Informal Cross Government/Industry
Scientific Group of Experts. BLG 12/INF.10 2007.
IMO, International Maritime Organization (2008). Report on the outcome of the Informal Cross Government/Industry Scientific Group of Experts established to evaluate the effects of the different fuel options proposed under the revision of MARPOL Annex VI. MEPC 57/4/57
IMO, International Maritime Organization (2009). Prevention of air pollution from
ships. Sulphur monitoring for 2008. MEPC 59/4/1.
Karhunen, J., R. Pouri & J. Santala (2004). Kuljetukset ja varastointi - järjestelmät,
kalusto ja toimintaperiaatteet (Transport and storage – systems, equipment and
operating principles) Suomen logistiikkayhdistys ry (Finnish Association of Logistics).
Karvonen, T. (2007). Aluskustannukset 2006, täydennys. Vaihtoehtoiset laskelmat kontti- ja ro-ro-alusten osalta. (Vessel Costs 2006; supplement. Alternative calculations for container and ro-ro vessels). Turun yliopiston Merenkulkualan koulutusja tutkimuskeskus (Centre for Maritime Studies at the University of Turku).
Karvonen, T., T. Solakivi & J. Vaiste (2006). Aluskustannukset 2006. (Vessel costs
2006) Merenkulkulaitoksen julkaisuja (publications of the Finnish Maritime Administration) 2006: 1.
Merenkulkulaitos (Finnish Maritime Administration) (2007). Ulkomaan meriliikenteen
kuukausitilasto. Joulukuu 2007. Monthly statistics for foreign marine traffic. December 2007)
Petromedia Ltd. (2009). www.bunkerworld.com/markets/prices/
Scandinavian Shipping Gazette (2009). http://www.shipgaz.com/
Suomen Pankki (Bank of Finland)(2009).
www.suomenpankki.fi/fi/tilastot/valuuttakurssit/
Tullihallitus (Finnish National Board of Customs) (2009).
www.tulli.fi/fi/05_Ulkomaankauppatilastot/
Venäläinen, P. (2008). Suomen konttikuljetukset meritse (Finnish marine container
transport). Merenkulkulaitoksen julkaisuja (publications of the Finnish Maritime
Administration) 2008: 4.
APPENDIX 1/Page 1(2)
APPENDIX 1
APPENDIX 1/Page 2(2)
© Copyright 2026