
Q4`16 Shareholder Letter
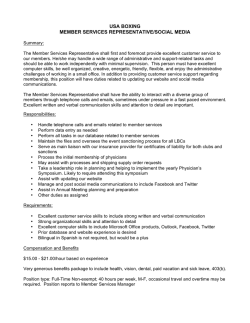
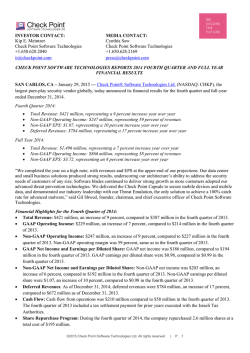
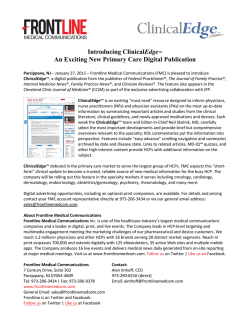
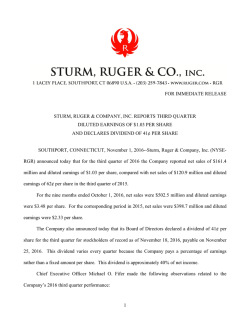
Q4 2016
Letter to Shareholders
February 9, 2017
@TwitterIR
1
Dear Shareholders,
2016 Overview
We look forward to discussing our fourth quarter and fiscal year 2016 financial
results with you at 5am PT today. As a reminder, to have your questions
considered during Q&A, Tweet to @TwitterIR using #TWTR. Thank you for
your interest and we look forward to speaking with you soon.
Revenue
$Millions
Advertising revenue
Data Licensing & Other revenue
$2,218
$2,530
$282
$224
Overview
Twitter made significant strides in 2016 as we positioned the company for
long-term sustainable growth and GAAP profitability. Specifically, we:
•
•
•
Clearly identified who we are — the best and fastest place to see
what’s happening in the world and what people are talking about.
Built and shipped products that directly improved our key audience
growth and engagement metrics.
Simplified the organization to be more focused and efficient, and
eliminated investment in non-core areas of our business.
As a result of these efforts, in the fourth quarter we drove accelerating rates
of growth in our average daily active usage (DAU) for the third consecutive
quarter, led by product improvements, as well as marketing and organic
trends. We also saw continued, strong double-digit engagement growth on a
year-over-year basis across Tweet impressions and time spent on Twitter in
the fourth quarter and we expect this momentum to continue.
In 2017, we are:
•
•
•
•
Building and shipping product changes more rapidly to make Twitter safer.
Investing in our core use case and in new product areas — such as
live streaming video, among others — that further strengthen Twitter’s
unique position as the best and fastest place to see and talk about what’s
happening in the world.
Simplifying and differentiating our revenue products to drive sustainable
long-term revenue growth.
Focusing on making progress toward GAAP profitability in 2017.
* For a reconciliation of non-GAAP financial measures to their corresponding GAAP measures,
please refer to the reconciliation table at the end of this letter.
2
$2,248
$1,994
FY’15
FY’16
Net Income / Loss
$Millions
GAAP Net Income / Loss
Non-GAAP Net Income / Loss*
$406
$277
$-457
$-521
FY’15
FY’16
Adjusted EBITDA
$Millions
Adjusted EBITDA*
Adjusted EBITDA Margin
30%
25%
$558
FY’15
$751
FY’16
In Q4, and fiscal year 2016 specifically:
•
•
•
•
•
•
•
•
•
•
•
2016 revenue totaled $2.5 billion, an increase of 14% year-over-year.
2016 GAAP net loss of $457 million and non-GAAP net income of
$406 million.
2016 GAAP diluted EPS of ($0.65) and non-GAAP diluted EPS of $0.57.
2016 adjusted EBITDA of $751 million, up 35% year-over-year,
representing an adjusted EBITDA margin of 30%, versus 25% in 2015.
Q4 revenue totaled $717 million, an increase of 1% year-over-year.
• Advertising revenue totaled $638 million, down slightly year-over-year.
Mobile advertising revenue was 89% of total advertising revenue.
• Data licensing and other revenue totaled $79 million, an increase of
14% year-over-year.
• US revenue totaled $440 million, a decrease of 5% year-over-year.
• International revenue totaled $277 million, an increase of 12%
year-over-year.
• Total ad engagements were up 151% year-over-year.
• Cost per engagement (CPE) was down 60% year-over-year.
Q4 GAAP net loss of $167 million and non-GAAP net income of $119 million.
Q4 GAAP diluted EPS of ($0.23) and non-GAAP diluted EPS of $0.16.
Q4 adjusted EBITDA of $215 million, up 12% year-over-year, representing
an adjusted EBITDA margin of 30%, versus 27% in 2015.
Average monthly active users (MAUs) were 319 million for Q4, up 4%
year-over-year and compared to 317 million in the previous quarter.
• Average US MAUs were 67 million for Q4, up 3% year-over-year
and flat compared to 67 million in the previous quarter.
• Average international MAUs were 252 million for Q4, up 5% yearover-year and compared to 250 million in the previous quarter.
Mobile MAUs represented 83% of total MAUs.
DAU grew 11% year-over-year, an acceleration from 7% in Q3’16,
5% in Q2’16, and 3% in Q1’16.
We’re focused on driving value across three key areas of our service: audience,
content, and revenue. We believe these areas will have the biggest impact on
our ability to create shareholder value. Let’s go through each in more detail.
3
Monthly Active Users (MAU)
Millions
US
International
317
319
67
67
250
252
Q3’16
Q4’16
Daily Active Users (DAU)
Y/Y Growth Rate
7%
11%
Q3’16
Q4’16
Audience
Strengthening our core use case as the best and fastest place to see what’s
happening in the world and what people are talking about, and making
Twitter safer, are critical to growing our audience. We saw accelerating rates
of growth on a year-over-year basis for DAU for the third quarter in a row.
That acceleration is broad based — in the fourth quarter, we saw accelerated
rates of DAU growth in eight of Twitter’s top 10 largest global markets. Tweet
impressions and time spent on Twitter also remained strong, each increasing
by double digits on a year-over-year basis in the fourth quarter. Increases in
both audience and engagement were driven in part by product improvements,
including better relevance in both the timeline and notifications.
In the fourth quarter, we made major strides in the Home timeline, launching
a number of features designed to show people the most important Tweets
first — news and commentary they would have wanted to see but may
have missed. We also improved the relevance of notifications to increase
engagement and bring people back to Twitter. These changes improved
retention for both monthly active and daily active usage, as well as increased
Tweet impressions and time spent on the service.
Relevant Content
To build on this progress, we expect to apply machine learning more broadly
across our service in 2017. Machine learning is critical for us to better identify
and personalize content that people want to see and deliver it to them, faster.
To strengthen our approach, we’ve combined our efforts under one leader
who will help us build a foundation of machine learning across our consumer
and revenue-generating products and create a more focused and data-driven
approach to product development.
We also recognized the importance of simplifying and creating a single
destination for people to discover what’s happening on Twitter. Already
in the first quarter of 2017, we launched Explore on iOS, which brings
together trends, Moments, search, and the best of live video. We intend to
continue integrating new, dynamic, and personalized content into the Explore
experience this year.
Explore
Lastly, we took important steps to make Twitter safer last quarter by reinforcing
our policies and launching features that gave people more control over their
experience, like muting notifications for keywords and conversations. Making
Twitter safer is a primary focus in 2017, and we are approaching safety with
a greater sense of urgency. We’ve rolled out a number of product changes
already in the first quarter, and this focus will continue until we’ve made a
significant impact.
Safety
4
600
Hours
In the fourth quarter, we streamed more than 600 hours of live premium video
from content partners across roughly 400 events, attracting 31 million unique
viewers in our first quarter of operations. Of these hours, 52% were sports,
38% were news and politics, and 10% were entertainment.
400
52%
Events
31M*
Unique
viewers
~50
We’re providing significant value to our live premium content partners,
helping them extend their reach globally with approximately 33% of unique
viewers outside the US, and helping them reach a younger audience
with approximately 50% of viewers under the age of 25. In 2016, we also
onboarded nine syndication partners and four over the top partners to further
expand live content distribution.
Last quarter, we also made significant improvements to our live streaming
video experience. We introduced docking for iOS, which allows people to
continue to watch select live videos while simultaneously accessing other
content on Twitter. We also experimented with multi-curated timelines
experiences, featuring expert commentators and top Tweets, and we further
improved video quality with the introduction of our proprietary technology
in SuperResolution.
In live sports, our 10-week NFL #TNF programming was the major highlight
of the fourth quarter. We completed the #TNF season with great success,
exceeding the high end of our reach expectations, generating more than
3.5 million unique viewers on average, per game. In news and politics, we
partnered with Bloomberg, BuzzFeed News, and PBS NewsHour to offer
Twitter users comprehensive live coverage of the 2016 presidential and vice
presidential debates, election night, and the inauguration. Viewership of the
presidential debates grew steadily, reaching approximately 4.2 million unique
viewers during the final debate, and we reached approximately 7.5 million
and 8.6 million unique viewers for election night and the inauguration live
streams, respectively. Our live entertainment initiatives have included original
productions for Twitter, such as the successful live Rogue One Q&A with cast
* All unique viewership counts referenced herein are based on unique user ID and the MRC video view standard as
defined by the IAB (50% in view for 2 seconds). Previously, the NFL and Twitter reported 3.1 million unique viewers on
average for all 10 weeks of TNF programming which used a higher measurement standard (100% in view for 3 seconds).
5
38%
of live video
Content
Live streaming video drives conversation, connection, and engagement on
Twitter, reinforcing our position as the best and fastest place to see what’s
happening in the world and what people are talking about. Our live streaming
content focuses on Twitter’s key areas of strength — news and politics,
live sports and eSports, and live entertainment — for a global audience.
Additionally, people from all over the world now broadcast live content from
a variety of devices, including phones, drones, and GoPros, powered by
Periscope.
10%
News + politics
Sports
Entertainment
Hours of live programming
per week with 25 hours of regularly scheduled programming.
~33% ~50%
International
viewers
Global reach
Viewers
under 25
Young audience
Viewership of final debate,
election night and inauguration
4.2M
Final debate
7.5M
Election night
8.6M
Inauguration
Unique viewers
3.5M
Unique viewers
on average
per game
~55%
~25%
~12%
Under age 25
International
Logged out
and crew, as well as a successful collaboration with dick clark productions on
the Golden Globes, our first red carpet event in the first quarter of 2017, which
reached approximately 2.7 million unique viewers.
Also in the fourth quarter, we broadcasted 6.6 million hours of live video
through Periscope. We continued to ship significant product updates, building
more of Periscope’s technology into Twitter itself, and creating new, immersive
video formats like 360 video. We introduced the ability to create and Tweet live
video from the Twitter app — powered by Periscope — and we’re seeing both
individual creators and a number of brand partners experiment with this new
way to bring people inside a live video experience.
Revenue
We believe advertisers recognize Twitter’s unique value proposition as the
best and fastest place to see what’s happening in the world and what people
are talking about. This gives them the ability to reach audiences in the right
context, at the right time. Our team has built deep relationships with our
advertisers and they are encouraged by Twitter’s continued accelerated growth
in daily active usage and strong engagement metrics for the third consecutive
quarter. However, and as we’ve previously stated, revenue growth will
continue to lag audience growth in 2017 and could now be further impacted
by escalating competition for digital ad spending and the re-evaluation of our
revenue product feature portfolio, which could result in the de-emphasis of
certain product features.
Periscope 360
For example, revenue from our direct response ad formats, on the whole,
declined on a year-over-year basis in the fourth quarter due to decreases in
our owned-and-operated mobile application download and website click ad
formats. We haven’t made the progress we anticipated over the last year in
some direct response ad formats, both in terms of improvements to existing
product features as well as the impact of new product features. We have
also seen increased competitive pressure resulting in a decline in our original
Promoted Tweet engagement ad format.
As we re-evaluate our revenue product features and roadmaps, we are
applying the same focused approach that drove renewed monthly and daily
active usage growth in 2016 to simplify our portfolio and our buying process
for advertisers. We’ll focus our investment in revenue product features
that differentiate Twitter and capitalize on our unique value proposition for
advertisers, including video and more organic ad formats.
Video is our largest revenue-generating ad format. During the fourth quarter,
we improved the buying experience for video advertisers with the launch
6
Live Campaigns:
Dynamic Ad Insertion
of reservation buying and the ability to buy video ads on a CPM basis. We
also delivered dynamic ad insertion with 15- and 30-second ads across a
wide range of live events, including NFL #TNF, the presidential debates, the
Melbourne Cup, and Bloomberg daily shows. Our live video ads are attractive
to advertisers with sound on and our completion rates are over 95%. Our
live video ads have been a key differentiator with advertisers, especially
when packaged with our Twitter Amplify video product, and have contributed
significantly to year-over-year growth in video-related advertising revenue.
Building on the success of our custom Twitter Amplify program, we began a
broad beta of Twitter Amplify open video in the US which will further increase
our unique value to contributing content partners and advertising partners.
We plan to continue to improve the buying experience for advertisers and
scale Twitter Amplify open video as we expand the current beta to select
international markets in the first half of 2017 and move toward general global
availability by the end of 2017. We will also continue to innovate with our live
video product, introducing more partners in more countries, and continuing to
scale our pre-roll and mid-roll ad formats.
In addition, we believe we can more aggressively grow our data licensing
revenue with a more brand-centric approach to channels, markets, products,
and pricing. This approach will position both Twitter and our key channel
partners for greater growth and monetization. We are investing in deeper
partnerships with a few select solution providers (including Sprinklr, Sprout
Social, and Conversocial) to help brands realize greater value from our data
and platform. As an example, our new Sprinklr channel partnership is focused
on driving marketing innovation for large enterprises. This partnership is a
multi-year deal, totaling more than $90 million, with collaboration in product
development, sales, and marketing.
7
Amplify Open Video
+
Q4 and Fiscal Year 2016 Financial and
Operational Detail
2016 Overview
Fiscal Year 2016
2016 was a year of transformation for Twitter. Disciplined execution across our
strategic priorities resulted in improved audience and engagement growth, and
we achieved greater operating leverage as we streamlined our cost structure
and increased our focus on profitability.
$Millions
(continued)
Adjusted Free Cash Flow*
$444
$5
Total revenue for 2016 reached $2.5 billion, up 14% year-over-year. Adjusted
EBITDA for the full year improved by nearly $200 million, reaching $751 million
with a 30% margin and exceeding our guidance range of $700 to $715 million
and our initial guidance range of 25-27%. We also generated significantly
more adjusted free cash flow, with more than $440 million generated in 2016
compared to less than $5 million in 2015. We ended the year with $3.8 billion
in cash, cash equivalents, and marketable securities.
Finally, we continued to make meaningful progress in reducing our annual
stock-based compensation (SBC) expense on both an absolute basis and
as a percentage of revenue. SBC expense for the year (on an absolute basis)
decreased 10% year-over-year and declined over 600 basis points yearover-year as a percent of revenue, reaching 24% in 2016 down from 31%
in 2015 and 45% in 2014. We remain committed to reducing stock-based
compensation to high single digits as a percentage of revenue over time,
bringing us more in line with our peers.
Stock-based Compensation
$Millions
$682
$615
FY’16
FY’15
Q4 2016 Overview
Revenue
$Millions
Advertising revenue
Data Licensing & Other revenue
Q4’16 Performance
Revenue
In the fourth quarter, total revenue reached $717 million, up 1% year-overyear. Total advertising revenue was $638 million, down slightly year-over-year.
Twitter-owned-and-operated advertising revenue was $553 million, down 1%
year-over-year. Strength in video was offset by year-over-year declines in
revenue generated from traditional Promoted Tweet and direct response ad
formats. Non-owned-and-operated advertising revenue reached $85 million,
or 13% of advertising revenue, roughly flat year-over-year. Significant gains in
revenue from the Twitter Audience Platform were offset by significant yearover-year declines in revenue from TellApart. We expect contributions from
non-owned-and-operated advertising revenue to face significant headwinds in
2017 from factors impacting TellApart.
FY’16
FY’15
$717
$710
$70
$79
$641
$638
Q4’15
Q4’16
Net Income / Loss
$Millions
GAAP Net Income / Loss
Non-GAAP Net Income / Loss*
$115
$119
As a reminder, during the fourth quarter, we reorganized our partnership,
sales, and marketing organizations to better align and execute against our
$-90
* For a reconciliation of non-GAAP financial measures to their corresponding GAAP measures,
please refer to the reconciliation table at the end of this letter.
8
$-167
Q4’15
Q4’16
key priorities. To better serve our ad partners, we reduced the number of
sales channels from three to two. Our advertising business continues to skew
toward large branded advertisers in the US and Canada with above-average
growth in a few select international markets.
Adjusted EBITDA
$Millions
Adjusted EBITDA*
Adjusted EBITDA Margin
30%
27%
By product, video continued to be our single largest revenue-generating ad
format. Strong growth in video, including in our live-streaming, Twitter Amplify,
and First View ad formats, was offset by year-over-year declines in traditional
Promoted Tweet and direct response ad formats. On a sequential basis, typical
seasonal growth from Q3 to Q4 was muted by a quarter-over-quarter decline
in revenue generated from mobile app promotions and single-digit sequential
growth in revenue generated from direct response ad formats.
$191
Q4’15
$215
Q4’16
Total Ad Engagements
Y/Y Growth Rate
Data licensing and other revenue totaled $79 million in the fourth quarter, up
14% year-over-year. Growth was driven by continued strength in our mobile ad
exchange services.
151%
91%
Advertising Metrics
Total ad engagements grew 151% year-over-year, driven primarily by a continuing
mix shift toward video ad impressions, as well as higher clickthrough rates (CTR)
across nearly all ad formats on a like-for-like basis. Average cost per engagement
(CPE) fell 60% year-over-year, again due to a higher mix of video engagements, as
well as significantly lower video CPE compared to the prior year.
On a sequential basis, total yield per impression improved compared to Q3 for
the second consecutive quarter, driven both by a mix shift toward higher yield ad
formats as well as higher CTR across several ad formats.
Costs
Total GAAP expenses in Q4 were $861 million, an increase of 11% yearover-year, driven by higher restructuring costs. On a non-GAAP basis, total
expenses in Q4 grew 1% year-over-year to $594 million. Reductions in sales
and marketing expense were offset by increases in cost of revenue due to
higher revenue share, infrastructure costs, and depreciation. Traffic acquisition
costs were $45 million or 52% of non-owned-and-operated advertising
revenue. This compares favorably to 61% in Q4’15 and 56% in Q3’16.
Q3’16
Cost Per Engagement
Y/Y Growth Rate
Q3’16
-60%
GAAP Expenses
$Millions
9
$861
$72
$92
$277
$261
$210
$218
$202
32%
Q4’15
* For a reconciliation of non-GAAP financial measures to their corresponding GAAP measures,
please refer to the reconciliation table at the end of this letter.
Q4’16
-44%
$778
SBC expense was $138 million, a year-over-year decline of 13% in the fourth
quarter, to 19% of revenue, down from $159 million, or 26% in the previous
quarter, and below our $150 to $160 million forecasted range. We ended the
quarter with more than 3,500 employees.
Q4’16
$306
Q4’16
Cost of
revenue
Research and
development
Sales and
marketing
General and
administrative
Income and Margin
GAAP loss from operations for Q4 totaled $144 million as compared to
$67 million for Q4’15. Adjusted EBITDA for Q4 improved to $215 million, or
30% of total revenue, an increase of 12% year-over-year. Adjusted EBITDA
excludes restructuring costs of $101 million. Approximately $22 million of
these restructuring costs were workforce related, in line with our guidance.
The remainder was due to lease write-offs as we’ve realigned our facility
footprint with current needs.
GAAP net loss in the quarter was $167 million, resulting in GAAP diluted EPS
of ($0.23). Non-GAAP net income was $119 million and non-GAAP diluted EPS
was $0.16.
Balance Sheet and Statement of Cash Flows
We ended the year with $3.8 billion in cash, cash equivalents, and marketable
securities. GAAP net cash provided by operating activities in the period was
$197 million. Adjusted free cash flow for Q4 was $111 million, compared to
approximately $12 million in Q4’15.
Audience
For the third consecutive quarter, product changes drove a direct improvement
in several key audience metrics with an acceleration of year-over-year growth
in DAUs for three quarters in a row. DAUs grew 11% year-over-year, compared
to 7% in Q3’16, 5% in Q2’16, and 3% in Q1’16. Other key engagement
metrics (including time spent and total Tweet impressions) remained strong
with double-digit year-over-year growth.
Stock-based Compensation
$Millions
$159
Q3’16
$Millions
$591
10
$594
$64
$54
$183
$233
$104
$107
32%
$198
Q4’15
$242
Q4’16
Cost of
revenue
Research and
development
Sales and
marketing
General and
administrative
Adjusted Free Cash Flow*
$111
$12
Q4’15
* For a reconciliation of non-GAAP financial measures to their corresponding GAAP measures,
please refer to the reconciliation table at the end of this letter.
Q4’16
Non-GAAP Expenses*
$Millions
Total MAUs for Q4 grew to 319 million from 317 million in the prior quarter.
Product improvements and organic growth again drove most of the change,
with additional lift provided by marketing initiatives. On a year-over-year basis,
MAUs grew 4% in Q4, an improvement compared to 3% year-over-year
growth rates seen in each of the three previous quarters.
$138
Q4’16
Outlook
At the end of each year, we revisit our approach to guidance and evaluate the practice of companies
across our industry as well as what’s appropriate for Twitter. As noted below, we are not providing
specific revenue guidance for the first quarter, but we have provided adjusted EBITDA, adjusted
EBITDA margin, and stock-based compensation expense guidance. As previously stated, we expect
advertising revenue growth to continue to lag that of audience growth in 2017. Advertising revenue
growth may be further impacted by escalating competition for digital ad spending and the reevaluation of our revenue product feature portfolio, which could result in the de-emphasis of certain
product features.
For Q1, we expect:
• Adjusted EBITDA to be between $75 million and $95 million
• Adjusted EBITDA margin to be between 17% and 17.5%
• SBC to be between $125 and $135 million
For FY 2017, we expect:
• Total non-GAAP expenses to be flat to down 5%, compared to full year 2016
• SBC to be down 15% to 20%, compared to full year 2016
• Capital expenditures to be between $300 and $400 million
Note that our outlook for Q1 and the full year 2017 reflects foreign exchange rates as of January 20, 2017.
For more information regarding the non-GAAP financial measures discussed in this letter, please see
“Non-GAAP Financial Measures” and “Reconciliation of GAAP to Non-GAAP Financial Measures”
below. Guidance for Adjusted EBITDA and Adjusted EBITDA margin excludes stock-based
compensation expense, depreciation and amortization expense, interest and other expense, net,
provision (benefit) for income taxes, and restructuring charges. We have not reconciled Adjusted
EBITDA guidance to GAAP net loss because we do not provide guidance on GAAP net loss or
the reconciling items between Adjusted EBITDA and GAAP net loss, other than stock-based
compensation expense, as a result of the uncertainty regarding, and the potential variability of, these
items. The actual amount of net loss and such reconciling items will have a significant impact on our
Adjusted EBITDA and Adjusted EBITDA margin. Accordingly, a reconciliation of the non-GAAP financial
measure guidance to the corresponding GAAP measure is not available without unreasonable effort.
11
Appendix
Webcast and Conference Call Details
Twitter will host a conference call today, Thursday, February 9, 2017, at 5am Pacific Time (8am Eastern
Time) to discuss financial results. The company will be following the conversation about the earnings
announcement on Twitter. To have your questions considered during the Q&A, Tweet your question
to @TwitterIR using #TWTR. To listen to a live audio webcast, please visit the company’s Investor
Relations page at investor.twitterinc.com. Twitter has used, and intends to continue to use, its Investor
Relations website and the Twitter accounts of @jack, @twitter, and @TwitterIR as means of disclosing
material nonpublic information and for complying with its disclosure obligations under Regulation FD.
About Twitter, Inc.
Twitter, Inc. (NYSE: TWTR) is the best and fastest place to see what’s happening and what people
are talking about all around the world. From breaking news and entertainment to sports and politics,
from big events to everyday interests. If it’s happening anywhere, it’s happening first on Twitter.
Twitter is where the full story unfolds with all the live commentary and where live events come to life
unlike anywhere else. Twitter is available in more than 40 languages around the world. The service
can be accessed at twitter.com, on a variety of mobile devices and via SMS. For more information,
visit about.twitter.com or follow @twitter.
Forward-Looking Statements
This letter to shareholders contains forward-looking statements within the meaning of Section 27A of
the Securities Act of 1933 and Section 21E of the Securities Exchange Act of 1934. Forward-looking
statements generally relate to future events or Twitter’s future financial or operating performance. In
some cases, you can identify forward-looking statements because they contain words such as “may,”
“will,” “should,” “expects,” “plans,” “anticipates,” “going to,” “could,” “intends,” “target,” “projects,”
“contemplates,” “believes,” “estimates,” “predicts,” “potential,” or “continue,” or the negative of these
words or other similar terms or expressions that concern Twitter’s expectations, strategy, priorities,
plans, or intentions. Forward-looking statements in this letter to shareholders include, but are not
limited to, statements regarding Twitter’s future financial and operating performance, including its
outlook and guidance, Twitter’s strategies, product and business plans, including strategies for
increasing shareholder value, the development of, investment in and demand for content, its products,
product features and services, including video, machine learning and data licensing, the behavior of
Twitter’s users and advertisers, Twitter’s expectations regarding the growth of its revenue, profitability,
audience, engagement and monetization, advertiser base and spending and ad engagements and
the impact of re-evaluating Twitter’s revenue product portfolio. Twitter’s expectations and beliefs
regarding these matters may not materialize, and actual results in future periods are subject to risks
and uncertainties that could cause actual results to differ materially from those projected. These risks
include the possibility that: Twitter’s user base and engagement do not grow or decline; Twitter’s
strategies, priorities, or plans take longer to execute than anticipated; Twitter’s new products and
product features do not meet expectations; advertisers reduce or discontinue their spending on
Twitter; data partners reduce or discontinue their purchases of data licenses from Twitter; and Twitter
experiences expenses that exceed its expectations. The forward-looking statements contained in
this letter to shareholders are also subject to other risks and uncertainties, including those more fully
12
described in Twitter’s Annual Report on Form 10-K for the fiscal year ended December 31, 2015, and
Quarterly Report on Form 10-Q for the quarter ended September 30, 2016, filed with the Securities
and Exchange Commission. Additional information will also be set forth in Twitter’s Annual Report
on Form 10-K for the fiscal year ended December 31, 2016. The forward-looking statements in this
letter to shareholders are based on information available to Twitter as of the date hereof, and Twitter
disclaims any obligation to update any forward-looking statements, except as required by law.
Non-GAAP Financial Measures
To supplement Twitter’s financial information presented in accordance with generally accepted
accounting principles in the United States of America, or GAAP, Twitter considers certain financial
measures that are not prepared in accordance with GAAP, including adjusted EBITDA, non-GAAP net
income, non-GAAP expenses, adjusted EBITDA margin, non-GAAP diluted EPS, and adjusted free
cash flow. Twitter defines adjusted EBITDA as net loss adjusted to exclude stock-based compensation
expense, depreciation and amortization expense, interest and other expenses, net, provision (benefit)
for income taxes, and restructuring charges; Twitter defines non-GAAP net income as net loss
adjusted to exclude stock-based compensation expense, amortization of acquired intangible assets,
non-cash interest expense related to convertible notes, non-cash expense related to acquisitions, the
income tax effects related to acquisitions, and restructuring charges; and Twitter defines non-GAAP
expenses as total costs and expenses adjusted to exclude stock-based compensation expense,
amortization of acquired intangible assets, non-cash expense related to acquisitions, and restructuring
charges. Adjusted EBITDA margin is calculated by dividing adjusted EBITDA by revenue. Non-GAAP
diluted EPS is calculated by dividing non-GAAP net income by non-GAAP share count. Non-GAAP
share count is GAAP share count plus potential common stock instruments such as stock options,
RSUs, shares to be purchased under employee stock purchase plan, unvested restricted stock, the
conversion feature of convertible senior notes and warrants. Adjusted free cash flow is GAAP net cash
provided by operating activities less capital expenditures (i.e., purchases of property and equipment
including equipment purchases that were financed through capital leases, less proceeds received
from disposition of property and equipment). Twitter is presenting these non-GAAP financial measures
to assist investors in seeing Twitter’s operating results through the eyes of management, and because
it believes that these measures provide an additional tool for investors to use in comparing Twitter’s
core business operating results over multiple periods with other companies in its industry.
Twitter uses the non-GAAP financial measures of adjusted EBITDA, non-GAAP net income, non-GAAP
expenses, adjusted EBITDA margin and non-GAAP diluted EPS in evaluating its operating results
and for financial and operational decision-making purposes. Twitter believes that adjusted EBITDA,
non-GAAP net income, non-GAAP expenses, adjusted EBITDA margin and non-GAAP diluted EPS
help identify underlying trends in its business that could otherwise be masked by the effect of the
expenses that we exclude in adjusted EBITDA, non-GAAP net income, non-GAAP expenses, adjusted
EBITDA margin, and non-GAAP diluted EPS. Twitter also believes that adjusted EBITDA, non-GAAP
net income, non-GAAP expenses, adjusted EBITDA margin, and non-GAAP diluted EPS provide
useful information about its operating results, enhance the overall understanding of Twitter’s past
performance and future prospects, and allow for greater transparency with respect to key metrics
used by Twitter’s management in its financial and operational decision-making. Twitter uses these
measures to establish budgets and operational goals for managing its business and evaluating its
13
performance. In addition, Twitter believes that adjusted free cash flow provides useful information to
management and investors about the amount of cash from operations and that it is typically a more
conservative measure of cash flows. However, adjusted free cash flow does not necessarily represent
funds available for discretionary use and is not necessarily a measure of our ability to fund our cash needs.
These non-GAAP financial measures should not be considered in isolation from, or as a substitute for,
financial information prepared in accordance with GAAP. These non-GAAP financial measures are not
based on any standardized methodology prescribed by GAAP and are not necessarily comparable to
similarly titled measures presented by other companies.
Contacts
14
Investors:
Cherryl Valenzuela
[email protected]
Press:
Kristin Binns
[email protected]
TWITTER, INC.
CONDENSED CONSOLIDATED BALANCE SHEETS
(In thousands)
(Unaudited)
Assets
Current assets:
Cash and cash equivalents
Short-term investments
Accounts receivable, net
Prepaid expenses and other current assets
Total current assets
Property and equipment, net
Intangible assets
Goodwill
Other assets
Total assets
Liabilities and stockholders’ equity
Current liabilities:
Accounts payable
Accrued and other current liabilities
Capital leases, short-term
Total current liabilities
Convertible notes
Capital leases, long-term
Deferred and other long-term tax liabilities, net
Other long-term liabilities
Total liabilities
Stockholders’ equity:
Common stock
Additional paid-in capital
Accumulated other comprehensive loss
Accumulated deficit
Total stockholders’ equity
Total liabilities and stockholders’ equity
15
December 31,
2016
$
$
$
$
December 31,
2015
988,598
2,785,981
650,650
226,967
4,652,196
783,901
95,334
1,185,315
153,619
6,870,365
$
122,236
380,937
80,848
584,021
1,538,967
66,837
7,556
68,049
2,265,430
$
4
7,224,534
(69,253 )
(2,550,350 )
4,604,935
6,870,365
$
$
911,471
2,583,877
638,694
247,750
4,381,792
735,299
141,015
1,122,728
61,605
6,442,439
134,081
283,792
88,166
506,039
1,455,095
59,695
2,978
50,585
2,074,392
3
6,507,087
(45,566 )
(2,093,477 )
4,368,047
6,442,439
TWITTER, INC.
CONDENSED CONSOLIDATED STATEMENTS OF OPERATIONS
(In thousands, except per share data)
(Unaudited)
Three Months Ended
December 31,
2016
2015
Revenue
Costs and expenses
Cost of revenue
Research and development
Sales and marketing
General and administrative
Total costs and expenses
Loss from operations
Interest expense
Other income (expense), net
Loss before income taxes
Provision (benefit) for income taxes
Net loss
Net loss per share:
Basic and diluted
Weighted-average shares used to
compute net loss per share:
Basic and diluted
16
$
717,206
2016
$
710,473
$
305,710
202,128
260,603
92,392
860,833
(143,627 )
(25,281 )
6,662
(162,246 )
4,808
(167,054 )
$
(0.23 )
713,618
Year Ended
December 31,
$
2,529,619
$
217,963
210,058
277,189
72,442
777,652
(67,179 )
(24,183 )
4,531
(86,831 )
3,405
(90,236 )
$
(0.13 )
681,424
2015
$
2,218,032
$
932,240
713,482
957,829
293,276
2,896,827
(367,208 )
(99,968 )
26,342
(440,834 )
16,039
(456,873 )
$
729,256
806,648
871,491
260,673
2,668,068
(450,036 )
(98,178 )
14,909
(533,305 )
(12,274 )
(521,031 )
$
(0.65 )
$
(0.79 )
702,135
662,424
TWITTER, INC.
CONDENSED CONSOLIDATED STATEMENTS OF CASH FLOWS
(In thousands)
(Unaudited)
Three Months Ended
December 31,
2016
2015
Cash flows from operating activities
Net loss
$ (167,054 )
Adjustments to reconcile net loss to net cash provided by
operating activities:
Depreciation and amortization
119,390
Stock-based compensation expense
138,095
Amortization of discount on convertible notes
19,070
Changes in bad debt provision
1,705
Deferred income tax
(4,833 )
Non-cash restructuring
25,934
Other adjustments
10,776
Changes in assets and liabilities, net of assets acquired
and liabilities assumed from acquisitions:
Accounts receivable
(74,160 )
Prepaid expenses and other assets
4,770
Accounts payable
19,179
Accrued and other liabilities
103,671
Net cash provided by operating activities
196,543
Cash flows from investing activities
Purchases of property and equipment
(48,105 )
Purchases of marketable securities
(630,884 )
Proceeds from maturities of marketable securities
485,374
Proceeds from sales of marketable securities
9,137
Changes in restricted cash
1,846
Purchases of investments in privately-held companies
—
Business combinations, net of cash acquired
(4,940 )
Other investing activities
—
Net cash used in investing activities
(187,572 )
Cash flows from financing activities
Taxes paid related to net share settlement of equity awards
(4,500 )
Repayments of capital lease obligations
(26,661 )
Proceeds from exercise of stock options
470
Proceeds from issuances of common stock under
8,610
employee stock purchase plan
Other financing activities
(360 )
Net cash provided by (used in) financing activities
(22,441 )
Net increase (decrease) in cash and cash equivalents
(13,470 )
Foreign exchange effect on cash and cash equivalents
(9,889 )
Cash and cash equivalents at beginning of period
1,011,957
Cash and cash equivalents at end of period
$
988,598
Supplemental disclosures of non-cash investing and financing
activities
Common stock issued in connection with acquisitions
$
697
Equipment purchases under capital leases
$
37,259
Changes in accrued property and equipment purchases
$
(2,041 )
17
$
$
$
$
$
(90,236 )
Year Ended
December 31,
2016
2015
$
(456,873 )
$
(521,031 )
87,446
158,249
18,046
5,405
(3,905 )
(3,194 )
(3,889 )
402,172
615,233
74,660
3,958
(4,775 )
25,934
20,150
312,823
682,118
69,185
5,765
(28,125 )
(3,194 )
1,438
(111,099 )
(37,486 )
85,866
(5,965 )
99,238
(22,969 )
7,101
(7,112 )
105,576
763,055
(216,585 )
(50,170 )
76,355
54,487
383,066
(80,464 )
(597,484 )
596,490
23,596
(709 )
—
—
(9,188 )
(67,759 )
(218,657 )
(2,908,611 )
2,518,631
183,154
(4,760 )
(81,502 )
(85,082 )
(1,181 )
(598,008 )
(347,280 )
(3,683,488 )
2,821,745
383,413
(3,549 )
(10,500 )
(51,644 )
(11,118 )
(902,421 )
(2,223 )
(26,170 )
8,911
(15,598 )
(100,558 )
7,540
(11,101 )
(117,535 )
17,361
17,695
24,431
39,295
6,999
5,212
36,691
(1,652 )
876,432
911,471
$
210
(83,975 )
81,072
(3,945 )
911,471
988,598
8,982
(62,998 )
(582,353 )
(16,900 )
1,510,724
$
911,471
$
$
$
1,341
100,281
5,738
$
$
$
—
6,979
8,282
516,538
31,215
3,902
TWITTER, INC.
RECONCILIATION OF GAAP TO NON-GAAP FINANCIAL MEASURES
(In thousands, except per share data)
(Unaudited)
Non-GAAP net income and net income per share:
Net loss
Stock-based compensation expense
Amortization of acquired intangible assets
Non-cash interest expense related to convertible notes
Non-cash expense related to acquisitions
Income tax effects related to acquisitions
Restructuring charges
Non-GAAP net income
GAAP diluted shares
(1)
Dilutive equity awards Non-GAAP diluted shares
Non-GAAP diluted net income per share
Adjusted EBITDA:
Net loss
Stock-based compensation expense
Depreciation and amortization expense
Interest and other expense, net
Provision (benefit) for income taxes
Restructuring charges
Adjusted EBITDA
Stock-based compensation expense by function:
Cost of revenue
Research and development
Sales and marketing
General and administrative
Total stock-based compensation expense
Amortization of acquired intangible assets by function:
Cost of revenue
Research and development
Sales and marketing
General and administrative
Total amortization of acquired intangible assets
Restructuring charges by function:
Cost of revenue
Research and development
Sales and marketing
General and administrative
Total restructuring charges
Non-GAAP costs and expenses:
Total costs and expenses
Less: stock-based compensation expense
Less: amortization of acquired intangible assets
Less: non-cash expense related to acquisitions
Less: restructuring charges
Non-GAAP total costs and expenses
Adjusted free cash flow:
Net cash provided by operating activities
Less: purchases of property and equipment
Less: equipment purchases under capital leases
Adjusted free cash flow
(1)
18
Three Months Ended
December 31,
2016
2015
$
$
$
$
$
$
$
$
$
$
$
$
$
$
$
(167,054 )
138,095
27,220
19,070
—
24
101,249
118,604
713,618
14,357
727,975
0.16
$
$
$
(167,054 )
138,095
119,390
18,619
4,808
101,249
215,107
$
6,511
81,840
27,751
21,993
138,095
$
8,027
53
19,140
—
27,220
$
49,018
15,929
30,350
5,952
101,249
$
860,833
(138,095 )
(27,220 )
—
(101,249 )
594,269
$
196,543
(48,105 )
(37,259 )
111,179
$
$
$
$
$
$
$
(90,236 )
158,249
15,418
18,046
—
240
12,902
114,619
681,424
21,496
702,920
0.16
Year Ended
December 31,
2016
2015
$
$
$
(90,236 )
158,249
87,446
19,652
3,405
12,902
191,418
$
8,360
94,707
36,750
18,432
158,249
$
10,405
64
4,949
—
15,418
$
1,087
8,746
2,741
328
12,902
$
777,652
(158,249 )
(15,418 )
—
(12,902 )
591,083
99,238
(80,464 )
(6,979 )
11,795
$
$
$
$
(456,873 )
615,233
69,338
74,660
—
2,342
101,296
405,996
702,135
13,009
715,144
0.57
$
$
$
(456,873 )
615,233
402,172
73,626
16,039
101,296
751,493
$
29,502
335,498
160,935
89,298
615,233
$
36,180
246
32,432
480
69,338
$
49,019
15,939
30,382
5,956
101,296
$
$
$
$
$
(521,031 )
682,118
54,659
69,185
926
(22,130 )
12,902
276,629
662,424
34,561
696,985
0.40
(521,031 )
682,118
312,823
83,269
(12,274 )
12,902
557,807
40,705
401,537
156,904
82,972
682,118
38,509
256
15,894
—
54,659
1,087
8,746
2,741
328
12,902
$ 2,896,827
(615,233 )
(69,338 )
—
(101,296 )
$ 2,110,960
$ 2,668,068
(682,118 )
(54,659 )
(926 )
(12,902 )
$ 1,917,463
$
$
$
763,055
(218,657 )
(100,281 )
444,117
$
383,066
(347,280 )
(31,215 )
4,571
Gives effect to potential common stock instruments such as stock options, RSUs, shares to be issued under ESPP,
unvested restricted stock and warrant. There is no dilutive effect of the notes nor the related hedge and warrant transactions.
@TwitterIR


© Copyright 2026