
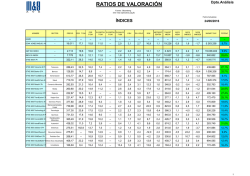
RATIOS IBEX-ESTX50m
Dpto.Análisis
RATIOS DE VALORACIÓN
Fuente : Bloomberg
(Ver nota explicativa pag.6)
Fecha Actualizac.
ÍNDICES
SECTOR
PRECIO
PER T12M
PER
F12M
NAME
--
--
--
--
--
--
DOW JONES INDUS. AVG
--
19.885
18,3
16,3
12,1
S&P 500 INDEX
--
2.281
21,0
17,2
IBEX 35 INDEX
--
9.474
20,1
ESTX € Pr
--
351,54
Telecoms
Bancos
Alimentación
NOMBRE
ESTX Telecomm € Pr
ESTX Banks € Pr
ESTX Food&Bevrg € Pr
EV/EBITDA EV/EBITDA EV/SALES
F12M
T12M
T12M
03/02/2017
P/BV
DIV YIELD
ROE
NETDEBT/
EBITDA
TARGET
MEDIA
%EPS
4SEM
%EPS
3MESES
%EPS
6MESES
MARKET CAP
POTENC
--
--
--
--
--
--
--
--
--
--
--
--
2,2
3,4
2,6
17,4
1,3
21.449
0,9
3,1
6,3
5.695.282
7,9%
13,1
--
2,4
3,0
2,2
12,9
1,7
2.516
0,8
2,6
4,7
20.383.072
10,3%
13,6
10,5
--
2,0
1,4
4,0
7,2
10,4
10.100
1,6
4,9
8,8
583.478
6,6%
21,3
14,3
9,7
--
1,4
1,6
3,4
7,7
5,9
375,5
0,9
2,8
5,4
5.101.264
6,8%
332,43
24,6
15,4
7,3
--
2,2
2,1
4,1
19,2
3,3
376,3
0,4
1,3
3,6
233.450
13,2%
120,54
14,6
11,0
--
--
--
0,7
4,4
5,1
--
122,6
1,1
2,5
7,0
561.195
1,7%
552,18
31,0
19,4
14,3
--
3,4
3,6
2,8
11,1
2,8
622,1
-0,3
3,4
5,9
346.500
12,7%
Salud
819,50
26,4
17,3
14,0
--
2,9
2,5
2,4
9,7
1,9
898,2
0,7
1,1
2,2
261.904
9,6%
ESTX Retail € Pr
Comercio Minorista
472,76
25,5
18,2
10,3
--
0,6
2,6
2,9
16,0
1,0
540,9
0,8
2,5
6,6
213.725
14,4%
ESTX Media € Pr
Media
213,89
20,1
16,2
10,3
--
2,5
2,6
3,9
12,4
1,4
241,8
0,6
3,3
3,8
136.300
13,0%
ESTX Insurance € Pr
Seguros
246,65
10,3
10,5
--
--
0,6
0,9
5,1
8,9
--
256,9
0,2
2,4
2,2
287.947
4,1%
ESTX Trav&Leisr € Pr
Viajes-Ocio
209,71
17,5
15,5
8,6
--
1,1
2,5
2,1
17,7
0,6
226,5
0,8
-6,9
-9,3
62.467
8,0%
ESTX FinanServc € Pr
Servicios Financ
370,31
37,1
17,2
8,4
--
1,0
1,7
3,2
7,0
3,2
375,1
0,9
-2,4
-1,6
56.874
1,3%
Bienes personalesHogar
749,5
1,6
5,7
6,4
484.104
6,9%
ESTX HealthCare € Pr
701,32
24,0
20,5
12,8
--
2,3
4,0
2,4
17,1
0,5
ESTX Technology € Pr
Tecnología
426,65
32,6
19,9
15,2
--
2,5
3,0
1,7
10,0
-0,2
447,7
0,3
2,7
4,9
294.665
4,9%
ESTX Chemicals € Pr
Químicas
1011,28
20,6
15,9
10,0
--
1,8
2,7
2,9
13,4
1,7
1037,2
1,4
2,4
4,5
345.258
2,6%
ESTX Constr&Mtr € Pr
ConstrucciónMateriales
416,58
23,0
16,3
9,9
--
1,1
1,9
3,0
9,0
2,7
445,6
1,2
1,8
7,6
170.408
7,0%
ESTX Auto&Parts € Pr
Automóvil
532,57
12,0
8,4
4,3
--
0,5
1,3
3,5
11,2
-0,1
564,0
2,0
3,7
7,4
319.439
5,9%
ESTX Utilities € Pr
Eléctricas
233,65
36,0
12,7
7,2
--
1,1
1,2
5,4
-2,6
2,9
270,2
0,6
1,3
0,4
290.859
15,6%
Recursos Básicos
233,18
--
15,5
14,4
--
0,9
1,3
2,6
-3,4
2,7
222,6
5,8
13,3
31,0
77.825
-4,6%
Petróleo-Gas
310,25
--
14,5
15,5
--
1,3
1,3
4,6
-2,8
3,0
338,9
-2,1
7,9
15,1
244.155
9,2%
Bnes-Svcs Industriales
712,49
20,9
16,7
10,5
--
1,3
3,1
2,9
17,6
1,3
745,5
1,4
3,5
5,9
619.954
4,6%
Inmobiliario
218,20
12,6
17,3
12,9
--
13,6
1,3
4,5
10,4
5,4
249,2
1,1
1,6
2,1
94.234
14,2%
ESTX Per&HouGds € Pr
ESTX BasicResou € Pr
ESTX Oil&Gas € Pr
ESTX InduGd&Ser € Pr
ESTX RealEstate € Pr
1
Dpto.Análisis
IBEX 35
NOMBRE
SECTOR
NAME
PRECIO
PX_LAST
PER T12M
PER
F12M
EV/EBITDA EV/EBITDA EV/SALES
F12M
T12M
T12M
P/BV
03/02/2017
DIV YIELD
ROE
NETDEBT/
EBITDA
TARGET
MEDIA
%EPS
4SEM
%EPS
3MESES
%EPS
6MESES
MARKET CAP
PE_RATIO BEST_PE_RATIO
EV_TO_T12M_EBITDA
BEST_EV_TO_BEST_EBITDA
EV_TO_T12M_SALES
PX_TO_BOOK_RATIO
BEST_DIV_YLD
RETURN_COM_EQY
NET_DEBT_TO_EBITDA
BEST_TARGET_PRICE
BEST_EPS_4WK_PCT_CHG
BEST_EPS_3MO_PCT_CHG
BEST_EPS_6MO_PCT_CHG
POTENC
PX_VOLUME
Banks
5,35
12,6
11,7
--
--
--
0,9
3,9
7,0
--
5,1
2,6
2,6
3,7
77.943
Banks
BANCO BILBAO VIZCAYA ARGENTA
6,19
12,1
10,2
--
--
--
0,9
4,5
7,3
--
6,6
-2,1
-3,7
-5,0
40.654
6,1%
CAIXABANK S.A
Banks
3,61
20,2
13,2
--
--
--
0,9
3,9
4,3
--
3,2
1,7
3,3
1,1
21.575
-10,4%
BANCO DE SABADELL SA
Banks
1,46
11,3
11,3
--
--
--
0,6
3,7
5,5
--
1,4
0,8
-0,6
-11,6
8.177
-2,7%
BANKIA SA
Banks
0,99
14,2
13,4
--
--
--
0,9
3,3
6,3
--
1,0
-0,1
1,1
-5,2
11.448
-3,5%
BANKINTER SA
Banks
7,59
13,9
14,8
--
--
--
1,7
3,3
12,4
--
7,0
2,4
2,9
2,6
6.821
-8,2%
Banks
0,90
--
9,7
--
--
--
0,3
1,7
-0,6
--
1,1
-10,1
-15,6
-33,0
3.769
17,4%
Insurance
2,87
12,8
10,8
--
--
0,5
1,0
4,8
7,8
--
2,6
0,8
3,7
8,5
8.844
-8,4%
Utilities
RED ELECTRICA CORPORACION
SA
16,70
14,5
13,5
11,2
9,2
8,6
3,3
5,5
23,5
4,0
19,1
-0,4
-0,5
-0,6
9.036
14,6%
GAS NATURAL SDG SA
Utilities
18,15
14,4
13,3
8,2
7,4
1,7
1,3
5,6
9,3
3,4
18,5
0,1
-0,6
-4,0
18.163
1,8%
ENDESA SA
Utilities
19,40
17,3
15,4
7,9
7,5
1,3
2,1
6,8
12,4
1,5
19,6
2,9
12,5
14,5
20.540
0,8%
ENAGAS SA
Utilities
22,81
13,0
12,5
12,8
11,1
9,5
2,2
6,4
17,1
5,3
27,2
0,7
0,4
1,7
5.446
19,0%
IBERDROLA SA
Utilities
5,87
14,5
13,6
9,2
8,8
2,4
1,0
5,3
6,9
3,7
6,7
0,3
0,7
2,4
37.894
14,4%
FERROVIAL SA
Construction & Materials
BANCO SANTANDER SA
BANCO POPULAR ESPANOL
MAPFRE SA
-4,2%
17,00
19,4
31,6
15,6
18,7
2,0
2,2
4,5
10,8
4,7
20,9
-3,1
-11,5
-19,7
12.450
23,1%
133,80
17,6
18,5
12,3
11,6
7,6
4,2
3,1
25,8
3,6
138,1
1,0
1,6
5,4
20.078
3,2%
13,37
16,3
15,1
--
8,1
6,2
2,0
5,8
12,4
--
14,6
1,2
0,7
3,0
13.236
9,3%
43,67
24,2
20,3
12,9
11,4
5,0
7,0
2,3
31,6
1,2
46,5
-0,1
0,5
1,9
19.161
6,5%
20,18
25,3
19,8
14,8
13,0
4,2
3,9
1,8
16,0
3,3
21,7
2,9
2,7
1,1
12.858
7,5%
Retail
DISTRIBUIDORA INTERNACIONAL
5,05
10,6
12,1
8,9
6,2
0,5
11,2
4,2
121,3
2,3
5,9
-0,8
-2,1
-5,5
3.145
17,2%
INDUSTRIA DE DISENO TEXTIL Retail
30,67
31,2
26,1
18,8
15,0
4,1
8,1
2,6
27,2
-1,1
36,5
0,1
-0,1
1,4
95.572
19,0%
& Gas
GAMESA CORP TECNOLOGICAOilSA
20,30
21,9
17,1
10,6
6,4
1,3
3,4
1,6
16,0
-0,3
22,6
1,1
6,0
7,4
5.669
11,5%
ACS ACTIVIDADES CONSConstruction
Y SERV & Materials
28,93
13,3
12,1
7,1
5,4
0,4
2,7
4,1
20,4
1,6
32,9
0,0
-3,4
-5,5
9.103
13,6%
ACCIONA SA
73,57
6,4
17,3
5,1
7,9
1,6
1,1
3,6
18,8
3,0
85,3
2,0
6,7
13,3
4.213
15,9%
8,04
--
23,1
17,2
8,5
1,3
4,0
0,0
-39,9
9,7
8,2
-0,1
-0,1
6,7
3.047
1,4%
CELLNEX TELECOM SAU Telecommunications
14,19
61,7
38,8
17,6
13,9
6,7
7,1
1,5
11,9
3,7
17,6
-2,7
-3,8
-5,7
3.288
23,8%
VISCOFAN SA
47,59
18,5
17,5
11,4
10,3
3,2
3,4
3,1
18,8
0,2
49,8
-0,7
-1,3
-3,9
2.218
4,6%
5,68
--
6,9
3,0
3,7
0,5
--
4,0
37,1
0,5
6,3
2,6
2,6
-5,5
12.048
10,7%
Industrial Goods &
Services
Industrial Goods &
ABERTIS INFRAESTRUCTURASServices
SA
Industrial Goods &
AMADEUS IT GROUP SA
Services
AENA SA
GRIFOLS SA
Health Care
Construction & Materials
Construction
& Materials
FOMENTO DE CONSTRUC
Y CONTRA
Food & Beverage
Travel & Leisure
INTL CONSOLIDATED AIRLINE-DI
11,43
20,8
18,0
7,3
13,1
3,5
4,1
5,1
18,2
-0,3
11,3
0,0
-1,3
-3,2
3.849
-0,8%
2,87
12,8
10,8
--
--
0,5
1,0
4,8
7,8
--
2,6
0,8
3,7
8,5
8.844
-8,4%
MERLIN PROPERTIES SOCIMIReal
SA Estate
10,30
7,7
15,4
--
23,7
21,0
1,1
4,9
14,9
--
11,8
7,7
7,4
4,5
4.839
14,9%
TECNICAS REUNIDAS SA
Media
MEDIASET ESPANA COMUNICACION
MAPFRE SA
INDRA SISTEMAS SA
Insurance
Oil & Gas
37,06
50,3
14,1
14,9
7,5
0,3
4,3
3,8
9,6
-5,0
36,1
1,3
3,9
3,8
2.071
-2,5%
Technology
10,43
--
13,5
29,8
8,2
1,0
5,0
0,8
-8,9
7,6
11,2
-2,2
-6,7
-10,8
1.711
7,6%
Oil & Gas
13,88
--
10,5
28,7
5,0
0,9
0,7
5,4
-3,2
11,4
14,0
5,0
12,1
6,4
20.770
0,8%
ACERINOX SA
Basic Resources
13,22
261,5
20,6
14,8
9,0
1,0
1,8
3,5
0,7
2,5
13,7
7,3
11,9
9,0
3.650
3,9%
ARCELORMITTAL
Basic Resources
7,40
--
13,4
36,8
5,3
0,6
--
1,3
-16,7
13,5
7,6
8,6
18,5
40,0
22.695
2,4%
TELEFONICA SA
Telecommunications
9,03
--
12,2
9,0
6,2
2,2
2,6
4,9
3,5
4,5
10,1
-0,1
-1,2
-5,2
45.496
12,3%
REPSOL SA
2
Dpto.Análisis
EUROSTOXX 50 (1ªparte)
PRECIO
PER T12M
PER
F12M
Food & Beverage
ANHEUSER-BUSCH INBEV SA/NV
98,00
43,8
21,7
16,1
14,0
KONINKLIJKE AHOLD DELHAIZERetail
N
20,01
18,3
15,1
9,9
Personal & Household
Goods
146,85
29,6
25,6
Chemicals
100,90
20,7
18,2
Industrial Goods &
Services
63,44
19,0
17,6
Insurance
158,25
11,0
10,3
--
--
0,9
1,0
4,9
ASML HOLDING NV
Technology
114,40
33,1
27,5
22,8
20,2
6,7
5,1
1,1
BASF SE
Chemicals
89,43
22,1
16,9
8,3
8,4
1,5
2,8
3,4
BAYER AG-REG
Chemicals
103,55
19,0
12,9
8,5
8,2
2,0
3,7
6,19
12,1
10,2
--
--
--
0,9
Automobiles
BAYERISCHE MOTOREN WERKE
AG& Parts
84,61
8,0
8,4
5,2
2,3
1,0
1,2
DANONE
Food & Beverage
58,97
20,7
17,2
12,9
11,4
2,2
Banks
61,11
11,4
10,2
--
--
--
Construction & Materials
33,12
28,5
17,8
10,7
9,4
Insurance
NOMBRE
ADIDAS AG
SECTOR
AIR LIQUIDE SA
AIRBUS SE
ALLIANZ SE-REG
Banks
BANCO BILBAO VIZCAYA ARGENTA
BNP PARIBAS
CRH PLC
EV/EBITDA EV/EBITDA EV/SALES
T12M
F12M
T12M
03/02/2017
P/BV
DIV YIELD
ROE
NETDEBT/
EBITDA
TARGET
MEDIA
%EPS
4SEM
%EPS
3MESES
%EPS
6MESES
MARKET CAP
POTENC
6,1
5,0
3,7
9,7
2,9
111,7
-1,2
-3,4
-6,0
197.886
14,0%
6,6
0,6
1,7
3,1
9,2
0,6
23,8
0,4
-1,6
2,9
25.632
19,1%
16,8
14,4
1,7
4,8
1,6
16,6
0,2
150,4
-0,1
0,1
0,0
30.723
2,4%
13,0
10,2
3,2
3,0
2,8
14,5
4,9
104,8
-1,5
-1,7
-2,0
39.240
3,8%
6,2
5,8
0,5
7,8
2,5
41,1
-1,2
70,3
-1,6
-2,8
-8,8
49.034
10,9%
10,0
--
168,5
0,3
-0,1
0,6
72.320
6,5%
16,2
-0,5
112,0
0,4
-0,1
-1,4
50.244
-2,1%
12,7
1,2
88,3
4,1
3,4
4,9
82.140
-1,3%
2,8
20,6
1,5
109,9
-0,4
-1,1
-0,1
85.630
6,1%
4,5
7,3
--
6,6
-2,1
-3,7
-5,0
40.654
6,1%
4,1
16,1
2,3
89,1
0,7
1,1
3,1
54.770
5,3%
3,1
3,0
14,2
2,3
68,3
0,8
0,7
0,6
38.678
15,9%
0,9
4,7
7,6
--
63,2
1,0
2,3
5,7
76.179
3,4%
1,1
2,2
2,1
7,6
2,6
34,6
0,2
-4,9
2,2
27.575
4,4%
23,10
9,5
9,6
--
--
0,3
0,8
5,3
8,5
--
25,7
-0,5
-0,5
-1,4
56.021
11,4%
DAIMLER AG-REGISTEREDAutomobiles
SHARES & Parts
67,93
8,5
7,9
2,7
2,7
0,3
1,4
5,2
15,8
-1,2
74,2
2,5
1,9
2,2
72.674
9,2%
Banks
DEUTSCHE BANK AG-REGISTERED
18,47
--
12,3
--
--
--
0,4
0,5
-3,0
--
15,5
-0,1
-5,8
-12,6
25.468
-16,1%
VINCI SA
Construction & Materials
66,54
17,2
14,7
9,2
8,2
1,4
2,6
3,3
14,4
2,6
74,9
0,3
0,3
0,4
39.253
12,6%
Industrial Goods &
Services
31,27
15,3
13,9
8,0
7,8
0,7
4,5
3,4
26,9
0,9
31,8
0,1
0,8
4,1
38.804
1,8%
74.643
9,0%
AXA SA
DEUTSCHE POST AG-REG
15,96
12,8
16,7
5,6
6,0
1,8
2,6
4,1
20,3
2,2
17,4
-1,6
-1,5
-5,5
Health Care
109,40
29,6
26,0
17,2
13,8
4,1
3,9
1,2
13,8
1,4
121,7
-0,2
-1,8
-3,8
23.905
11,2%
Utilities
3,92
13,5
11,1
6,8
6,3
1,4
1,1
5,5
8,5
2,7
4,7
0,3
3,7
1,9
39.833
18,9%
Utilities
11,09
--
11,7
47,0
5,4
1,0
0,6
6,3
-9,8
17,0
14,3
-3,1
-7,8
-12,5
27.007
29,0%
Oil & Gas
14,32
--
21,7
24,3
4,3
1,5
1,0
5,6
-18,7
6,3
16,6
2,4
-1,2
-12,3
52.042
15,9%
Telecommunications
DEUTSCHE TELEKOM AG-REG
ESSILOR INTERNATIONAL
ENEL SPA
ENGIE
ENI SPA
3
Dpto.Análisis
EUROSTOXX 50 (2ªparte)
SECTOR
PRECIO
PER T12M
PER
F12M
Utilities
6,95
46,84
74,38
46,00
5,87
13,78
2,22
30,67
28,0
30,6
26,9
9,4
14,5
10,8
16,7
31,2
13,0
11,9
21,4
10,3
13,6
11,5
10,3
26,1
2,7
11,0
11,4
-9,2
--18,8
7,8
5,8
10,1
-8,8
--15,0
LVMH MOET HENNESSY LOUIS Goods
VUI
188,50
23,8
20,7
10,5
Insurance
MUENCHENER RUECKVER AG-REG
176,20
10,1
11,5
--
NOMBRE
E.ON SE
TOTAL SA
Oil & Gas
FRESENIUS SE & CO KGAA
Health Care
SOCIETE GENERALE SA
Banks
IBERDROLA SA
Utilities
ING GROEP NV
Banks
INTESA SANPAOLO
Banks
INDUSTRIA DE DISENO TEXTIL Retail
Personal & Household
EV/EBITDA EV/EBITDA EV/SALES
T12M
F12M
T12M
03/02/2017
P/BV
DIV YIELD
ROE
NETDEBT/
EBITDA
TARGET
MEDIA
%EPS
4SEM
%EPS
3MESES
%EPS
6MESES
MARKET CAP
POTENC
0,2
1,2
2,1
-2,4
--4,1
31,3
1,3
3,5
0,6
1,0
1,1
0,8
8,1
3,9
5,2
1,0
4,7
5,3
5,2
9,1
2,6
-53,1
4,1
13,7
6,6
6,9
9,5
4,9
27,2
0,1
2,2
2,5
-3,7
---1,1
7,3
50,8
81,0
46,6
6,7
14,6
2,6
36,5
1,2
0,6
0,7
0,1
0,3
2,0
-1,0
0,1
2,1
-0,2
1,9
4,4
0,7
3,2
-0,9
-0,1
-9,2
-4,0
6,2
8,3
2,4
6,7
-0,9
1,4
13.895
114.925
41.164
37.155
37.894
53.426
37.163
95.572
4,8%
8,5%
8,9%
1,4%
14,4%
5,7%
19,2%
19,0%
10,3
2,5
3,6
2,4
15,7
0,3
203,4
3,7
4,5
5,0
95.593
7,9%
--
0,4
0,9
5,0
9,1
--
176,6
-0,6
-1,4
-1,9
28.378
0,3%
Technology
4,52
--
19,3
34,8
10,6
0,9
1,3
3,9
-4,4
-10,6
5,3
-11,3
-16,9
-30,4
26.391
16,5%
L'OREAL
Personal & Household
Goods
171,65
33,1
24,5
16,9
15,6
3,5
4,4
2,1
12,9
-1,6
174,3
0,6
1,0
0,7
96.443
1,5%
ORANGE
Telecommunications
14,37
16,1
13,3
5,9
5,0
1,6
1,2
4,5
15,4
2,3
17,4
0,0
-0,5
0,9
38.225
20,9%
Health Care
27,63
24,6
15,5
9,8
7,9
1,3
2,0
3,0
11,9
1,0
29,9
-3,4
-1,7
0,4
25.681
8,4%
Industrial Goods &
Services
63,76
16,7
16,4
8,0
8,4
1,5
3,8
3,0
24,2
0,5
69,8
-2,5
-3,3
-3,6
26.590
9,5%
Health Care
12,1
9,9
3,3
1,8
4,1
7,6
1,1
84,4
0,2
1,2
1,0
98.026
11,3%
NOKIA OYJ
KONINKLIJKE PHILIPS NV
SAFRAN SA
SANOFI
BANCO SANTANDER SA
SAP SE
75,87
24,3
13,5
Banks
5,35
12,6
11,7
--
--
--
0,9
3,9
7,0
--
5,1
2,6
2,6
3,7
77.943
-4,2%
Technology
85,88
28,3
19,9
16,5
13,5
4,8
4,0
1,6
14,6
0,5
89,7
-0,4
-0,9
-1,2
105.504
4,5%
2,0
47,3
1,0
0,2
0,9
25.762
2,0%
46,40
54,5
16,2
7,7
7,0
0,7
1,4
2,8
7,1
SIEMENS AG-REG
Industrial Goods &
Services
119,15
16,9
14,7
11,0
10,2
1,4
2,6
3,3
15,6
1,5
126,3
5,4
4,6
4,0
101.278
6,0%
SCHNEIDER ELECTRIC SE
Industrial Goods &
Services
68,42
25,8
17,0
11,3
10,6
1,4
2,0
3,2
7,5
1,7
68,3
0,7
0,7
0,8
40.539
-0,2%
Telecommunications
9,03
--
12,2
9,0
6,2
2,2
2,6
4,9
3,5
4,5
10,1
-0,1
-1,2
-5,2
45.496
12,3%
Real Estate
214,75
8,8
18,1
11,9
24,9
20,2
1,2
5,0
14,4
4,4
242,1
0,6
0,6
0,9
21.335
12,7%
Personal & Household
Goods
37,86
20,8
18,6
13,4
12,3
2,4
6,6
3,6
32,6
1,4
41,9
0,6
1,0
0,2
113.680
10,7%
Media
17,08
16,8
24,4
10,5
14,3
1,9
1,2
3,1
6,6
-1,3
19,7
1,1
5,4
11,1
21.983
15,1%
Construction & Materials
COMPAGNIE DE SAINT GOBAIN
TELEFONICA SA
UNIBAIL-RODAMCO SE
UNILEVER NV-CVA
VIVENDI
4
Dpto.Análisis
DOW JONES INDUSTRIAL 30
SECTOR
PRECIO
PER T12M
PER
F12M
NAME
0
3M CO
Industrial Goods &
Services
-174,18
37,68
76,51
41,18
22,72
162,26
-21,8
29,1
15,0
18,7
15,5
15,3
-20,0
25,6
13,4
13,9
12,8
17,2
-13,5
5,6
6,7
7,6
-12,4
-12,8
5,7
-7,0
-9,1
93,77
112,21
31,18
41,40
76,17
29,7
108,3
15,0
21,4
22,9
29,6
23,7
12,8
20,8
20,3
16,5
19,8
8,0
19,2
14,0
Oil & Gas
83,45
35,4
19,8
Industrial Goods &
Services
29,68
27,1
17,8
NOMBRE
ALCOA CORP
Basic Resources
AMERICAN EXPRESS CO Financial Services
AT&T INC
Telecommunications
BANK OF AMERICA CORP
Banks
Industrial Goods &
Services
Industrial Goods &
Services
BOEING CO/THE
CATERPILLAR INC
CHEVRON CORP
Oil & Gas
CISCO SYSTEMS INC
Technology
COCA-COLA CO/THE
Food & Beverage
DU PONT (E.I.) DE NEMOURS Chemicals
EXXON MOBIL CORP
GENERAL ELECTRIC CO
HP INC
HOME DEPOT INC
EV/EBITDA EV/EBITDA EV/SALES
T12M
F12M
T12M
03/02/2017
P/BV
DIV YIELD
ROE
NETDEBT/
EBITDA
TARGET
MEDIA
%EPS
4SEM
%EPS
3MESES
%EPS
6MESES
MARKET CAP
POTENC
-3,8
0,5
2,8
2,3
-1,0
-10,0
1,2
3,3
2,1
0,9
122,6
-2,7
0,5
1,7
4,8
1,7
3,5
-45,8
-0,2
25,4
10,6
6,3
136,8
-1,1
0,8
1,8
2,3
-0,0
-188,9
34,6
80,2
43,2
24,7
172,6
--0,3
82,1
0,6
-0,6
5,2
1,2
--0,5
681,7
0,9
-1,5
10,2
0,3
--2,5
-34,0
1,6
-2,2
12,4
-3,2
-104.763
6.893
70.026
252.886
229.587
100.141
-8,4%
-8,2%
4,8%
4,9%
8,8%
6,4%
15,7
6,9
6,6
16,7
11,6
1,5
2,3
2,4
4,8
2,7
4,2
1,4
2,5
6,8
6,7
3,3
3,9
3,6
3,6
2,1
-0,5
-1,0
17,2
27,7
25,7
1,1
3,2
-2,5
2,0
0,5
97,6
128,8
33,1
44,3
82,2
-1,1
-1,3
0,0
0,1
-0,2
-7,9
-1,1
-2,7
-0,7
-0,4
-12,3
-4,4
-2,5
-1,3
-0,8
54.862
211.827
156.516
178.557
65.855
4,1%
14,7%
6,1%
7,1%
7,9%
18,4
8,0
2,1
2,0
3,7
5,2
1,8
89,1
-1,1
-3,7
-5,0
346.042
6,8%
35,1
16,3
2,9
3,5
3,2
9,3
7,6
33,8
-1,3
-2,0
-4,7
262.561
13,7%
Technology
15,21
9,1
9,5
6,5
6,4
0,5
--
3,5
--
0,1
16,4
0,1
-0,2
-1,2
25.940
7,6%
Retail
136,95
22,1
19,1
11,3
11,5
1,8
29,7
2,3
116,1
1,3
149,0
0,0
0,1
-0,4
166.827
8,8%
174,58
12,4
12,6
12,1
10,3
2,4
9,1
3,3
73,0
2,1
165,7
-1,1
-1,6
-2,4
166.000
-5,1%
INTEL CORP
Technology
36,68
15,4
13,0
8,4
7,0
2,9
2,6
2,9
16,0
0,1
41,2
-0,5
-0,4
3,4
173.827
12,2%
JOHNSON & JOHNSON
Health Care
113,57
18,1
16,1
13,5
10,6
4,3
4,2
3,0
21,9
-0,6
125,6
-1,2
-1,5
-1,0
308.971
10,6%
Banks
84,59
13,9
12,8
--
--
--
1,3
2,5
10,0
--
91,5
1,7
5,4
6,3
302.685
8,2%
--
--
--
35,4
--
3,1
--
--
2,9
6,6
49,9
-0,9
-1,9
-0,1
--
--
Travel & Leisure
123,22
21,5
19,8
13,0
13,2
4,8
--
3,1
--
2,6
129,9
0,1
-0,2
0,3
102.327
5,4%
MERCK & CO. INC.
Health Care
64,18
22,1
16,6
13,5
11,3
4,6
4,1
2,9
12,3
0,9
68,7
-0,5
-1,2
-0,3
176.953
7,1%
MICROSOFT CORP
Technology
63,17
30,5
20,1
16,2
12,1
5,2
7,1
2,6
23,0
-1,4
68,6
-0,3
0,1
1,4
488.148
8,5%
PFIZER INC
Health Care
31,73
16,8
12,2
13,2
9,4
4,4
3,0
4,1
10,7
1,7
37,3
-1,5
-1,2
-2,3
192.549
17,6%
Technology
INTL BUSINESS MACHINES CORP
JPMORGAN CHASE & CO
Food & Beverage
KRAFT FOODS INC-CLASS A
MCDONALD'S CORP
Personal & Household
87,76
23,3
21,8
14,1
14,1
3,6
4,3
3,2
26,7
1,0
91,2
-0,2
-1,3
-1,2
224.356
3,9%
Insurance
117,63
11,6
12,3
--
--
1,5
1,4
2,4
12,8
--
120,6
-0,8
-0,5
-2,5
33.414
2,6%
Industrial Goods &
PROCTER & GAMBLE CO/THE Goods
TRAVELERS COS INC/THE
108,36
16,4
16,5
10,7
10,2
1,9
3,2
2,5
18,4
1,7
117,7
-0,9
-1,0
-5,7
89.224
8,6%
Telecommunications
VERIZON COMMUNICATIONS
INC
48,28
12,5
12,4
7,5
6,6
2,6
8,7
4,8
67,4
2,4
52,6
-3,3
-3,5
-4,1
196.820
8,9%
WAL-MART STORES INC
66,70
15,4
15,4
7,9
7,7
0,5
2,6
3,1
18,4
1,2
74,5
-0,1
-1,0
-2,8
204.982
11,6%
UNITED TECHNOLOGIES CORPServices
Retail
5
Dpto.Análisis
NOTA EXPLICATIVA SOBRE LOS CAMPOS EMPLEADOS
PER T12M
El precio de la acción dividido por los beneficios por acción antes de extraordinarios (ajustado) de los últimos 12 meses, es decir, de los últimos 4 trimestres publicados.
PER F12M
El precio de la acción divididido por los beneficios por acción antes de extraord. que el consenso de analistas proyecta para los próximos 12 meses, es decir, para los próx. 4 trimestres.
EV/EBITDA T12M
Es el Enterprise Value (Valor de la firma) dividido por el Ebitda de los útimos 12 meses o 4 trimestres. Relaciona el valor total de la firma (incluyendo deuda) con los rdos.operativos.
EV/EBITDA F12M
Es el Enterprise Value (Valor de la firma) dividido por la estimación de Ebitda del consenso de analistas para los próximos 12 meses, o 4 próx. Trimestres.
EV/SALES T12M
Es el Enterprise Value (Valor de la firma) dividido por las Ventas de los últimos 12 meses.
P/BV
Es el Precio de la acción dividido por su valor en libros, es decir, su valor contable.
DIV YIELD
Es la rentabilidad por dividendo esperada para el año actual. Es el resultado de dividir el dividendo por acción entre el precio de la acción.
ROE
Son los beneficios netos de los ultimos 12 meses (4 últimos trimestres publicados) (menos pagos de dividendos preferentes) dividido entre los Fondos Propios.
NET DEBT/EBITDA
Es la Deuda Neta (Deuda menos Liquidez) dividido entre el Ebitda.
TARGET MEDIA
Es la media del Precio Objetivo del consenso de analistas de Bloomberg.
% EPS 4 SEM
Es la variación porcentual que ha experimentado la estimación de Beneficio por Acción ajustado del consenso de analistas de Bloomberg en las últimas 4 semanas.
% EPS 3MESES
Es la variación porcentual que ha experimentado la estimación de Beneficio por Acción ajustado del consenso de analistas de Bloomberg en las últimos 3 meses.
% EPS 6MESES
Es la variación porcentual que ha experimentado la estimación de Beneficio por Acción ajustado del consenso de analistas de Bloomberg en las últimos 6 meses.
MARKET CAP
Capitalización de mercado.
POTENC
Potencial de revalorización. Es la diferencia porcentual entre el Precio Objetivo del consenso de analistas (Target) y el Precio actual de mercado.
6

© Copyright 2026