
Technical Meeting Discussion Materials
Technical Meeting Discussion Materials
November 16, 2016
Disclaimer
The Puerto Rico Fiscal Agency and Financial Advisory Authority (“AAFAF”), the Commonwealth of Puerto Rico (the “Commonwealth”), and each of their
respective officers, directors, employees, agents, attorneys, advisors, members, partners or affiliates (collectively, with AAFAF and the Commonwealth the
“Parties”) make no representation or warranty, express or implied, to any third party with respect to the information contained herein and all Parties expressly
disclaim any such representations or warranties.
The Parties do not owe or accept any duty or responsibility to any reader or recipient of this presentation, whether in contract or tort, and shall not be liable for
or in respect of any loss, damage (including without limitation consequential damages or lost profits) or expense of whatsoever nature of such third party that
may be caused by, or alleged to be caused by, the use of this presentation or that is otherwise consequent upon the gaining of access to this document by such
third party.
This document does not constitute an audit conducted in accordance with generally accepted auditing standards, an examination of internal controls or other
attestation or review services in accordance with standards established by the American Institute of Certified Public Accountants or any other organization.
Accordingly, the Parties do not express an opinion or any other form of assurance on the financial statements or any financial or other information or the
internal controls of the Commonwealth and the information contained herein.
Any statements and assumptions contained in this document, whether forward-looking or historical, are not guarantees of future performance and involve
certain risks, uncertainties, estimates and other assumptions made in this document. The economic and financial condition of the Commonwealth and its
instrumentalities is affected by various financial, social, economic, environmental and political factors. These factors can be very complex, may vary from one
fiscal year to the next and are frequently the result of actions taken or not taken, not only by the Commonwealth and its agencies and instrumentalities, but
also by entities such as the government of the United States. Because of the uncertainty and unpredictability of these factors, their impact cannot be included
in the assumptions contained in this document. Future events and actual results may differ materially from any estimates, projections, or statements
contained herein. Nothing in this document should be considered as an express or implied commitment to do or take, or to refrain from taking, any action by
AAFAF, the Commonwealth, or any government instrumentality in the Commonwealth or an admission of any fact or future event. Nothing in this document
shall be considered a solicitation, recommendation or advice to any person to participate, pursue or support a particular course of action or transaction, to
purchase or sell any security, or to make any investment decision.
By accepting this document, the recipient shall be deemed to have acknowledged and agreed to the terms of these limitations.
This document may contain capitalized terms that are not defined herein, or may contain terms that are discussed in other documents or that are commonly
understood. You should make no assumptions about the meaning of capitalized terms that are not defined, and you should consult with advisors of AAFAF
should clarification be required.
The following information is presented for discussion purposes only. Nothing herein shall be construed to represent any statement or position of the
Commonwealth on its rights and obligations with respect to revenues subject to “clawback” pursuant to Art. VI, Sec. 8 of the Puerto Rico Constitution or
subject to retention pursuant to Act 21-2016 or any debt service that may be payable during the current fiscal year. Nothing herein shall constitute a waiver of
any rights or defenses the Commonwealth and its instrumentalities may have with respect to the same, all of which are hereby expressly reserved.
1
Table of Contents
I.
Historical Indicators.................................................................................. Page 4
II. Commonwealth Liquidity........................................................................... Page 18
III. Fiscal Plan Projections............................................................................... Page 24
A.
Fiscal Plan Projection Approach.................................................................................
Page 25
B.
Fiscal Plan Base Projections........................................................................................
Page 32
C.
Fiscal Plan Principles and Measures...........................................................................
Page 55
IV. Appendix.................................................................................................... Page 78
A.
Additional Detail on Commonwealth Historical Reporting........................................
Page 79
B.
Additional Detail on Fiscal Plan Base Projections.......................................................
Page 92
C.
Additional Liquidity Details.........................................................................................
Page 102
D. Debt Service Disclosure................................................................................................
Page 110
E.
Page 118
Footnotes......................................................................................................................
2
Acronyms
Included below is a list of abbreviations/acronyms that may be used in the following
document
ADEA – Agriculture Enterprises Development
Administration
GSA – General Services Administration
HFA – Housing Finance Authority
AFICA –Industrial, Tourist, Educational, Medical and
Environmental Control Facilities Financing
Authority
HTA – Highways and Transportation Authority
APLA – Port of the Americas Authority
PBA – Public Buildings Authority
ASEM – Medical Services Administration
ASES – Health Insurance Administration
ASSMCA – Mental Health and Anti-Addiction Services
Administration
MBA – Metropolitan Bus Authority
CAE – Additional Special Tax (Municipal Property Tax)
COFINA – Sales Tax Financing Corporation
CTF – Children’s Trust Fund
ERS – Employees Retirement System of the
Government of Puerto Rico
GDB – Government Development Bank for Puerto Rico
GO – Direct General Obligation
JRS – Judiciary Retirement System
MFA – Municipal Finance Agency
PFC – Public Finance Corporation
PRASA – Aqueduct and Sewer Authority
PRCCDA – Convention Center District Authority
PREPA – Electric Power Authority
PRIDCO – Industrial Development Company
PRIFA – Infrastructure Financing Authority
PRIICO – Industrial Investment Company
SIF – State Insurance Fund
SRF – State Revolving Fund
TRS – Teachers Retirement System
UPR – University of Puerto Rico
VRDO – Variable Rate Demand Obligation
3
Section I –
Historical Indicators
4
Puerto Rico’s Declining Economy
Puerto Rico’s economy has experienced negative real GNP growth in every year but one since
2006
The GNP declines would have been even worse had it not been for large federal and local stimulus spending, such
as the ~$7.1 billion of funds allocated to Puerto Rico under the 2009 American Recovery and Reinvestment Act,
the creation of a $500 million “Local Stimulus Fund” funded from the Puerto Rico Sales Tax Financing
Corporation (“COFINA”) bond issuances in 2009 and 2010(1), and Affordable Care Act related funding
Real GNP Growth Rates – Puerto Rico vs. United States(2)(3)
Puerto Rico
4.0%
3.0%
2.9%
3.0%
2.9%
2.2%
2.0%
1.0%
United States
1.8%
1.7%
1.5%
0.5%
0.5%
0.0%
–
(0.1%)
(1.0%)
(0.6%)
(1.2%)
(2.0%)
(1.7%)
(3.0%)
(1.7%)
(2.9%)
(3.4%)
(4.0%)
(3.8%)
(3.6%)
(5.0%)
2006
(1)
(2)
(3)
2007
2008
2009
2010
2011
2012
2013
2014
2015
2011 Comprehensive Annual Financial Report p. 27.
Puerto Rico Fiscal Authority Agency and Financial Advisory Authority. Economic Activity Index (“EAI”) Reports for Puerto Rico GNP data and the U.S. Bureau of Economic Analysis for the United States GNP
data. Both Puerto Rico and U.S. fiscal data reported on a Puerto Rico fiscal year basis (July to June).
Puerto Rico values are based on real GNP calculated at 1954 prices; U.S. values are based on real GNP at 2009 prices.
5
Poor Job Prospects, High Unemployment and Widespread Poverty
As a result of the declining economy, today Puerto Rico’s residents face an economy with drastically fewer
private sector jobs than any U.S. state relative to its population. Driven in part by a lack of private sector
jobs, unemployment remains double the U.S. average and nearly half the population lives in poverty
Private Payroll Employment as a Percentage of Total Population by State – 2015(1)(2)
50%
45%
40%
35%
30%
25%
20%
15%
10%
5%
0%
Population below the Poverty Level (2014)(4)
Puerto Rico Unemployment Rate 2006-2015(3)
20%
50%
16.4%
14.4%
16%
12%
10.6%
12.1%
11.8%
40%
Puerto
Rico
30%
9.6%
8%
4%
14.2% 13.8%
8.1%
4.6%
22%
7.4%
5.8%
6.2%
5.3%
United
States
Average
20%
2006 2007 2008 2009 2010
2011
2012
2013
2014
2015
U.S. Department of Labor. Employment as of July 2016 and population as of July 2015.
U.S. Census Bureau.
16%
10%
0%
(1)
(2)
46%
(Highest State)
United States
(3)
(4)
Mississippi
Puerto Rico
Bureau of Labor Statistics (Non-Farm Payroll Employment Survey).
U.S. Census Bureau. Current Population Survey, Annual Social and Economic Supplement, 2015
United States data. Puerto Rico poverty level based on 2014 American Community Survey 1-Year
estimates.
6
Significant Outmigration
Driven by poor economic prospects, approximately 9% of Puerto Rico’s residents moved from
the island between 2006 and 2015 and the rate of outmigration only appears to be increasing
Puerto Rico Population 2006 to
Puerto Rico Net Outgoing Air Passenger Traffic
(Total on a Rolling Last Twelve Month Basis)(2)
2015(1)
(millions)
325
321
320
3.8
U.S.
315
310
Puerto
Rico
305
300
298
9-Year Growth
United States: 7.7%
Puerto Rico: (8.7%)
2006 2007 2008 2009 2010 2011 2012 2013 2014 2015
Puerto Rico lost approximately 331,000 people
in the period from 2006 to 2015
U.S. Census Bureau, Population Division. Yearly data shown as of July 1.
Puerto Rico Institute of Statistics.
120,000
3.9
100,000
3.8
80,000
3.7
60,000
3.6
40,000
3.5
20,000
3.4
-
3.5
295
(1)
(2)
4.0
2006 2007 2008 2009 2010 2011 2012 2013 2014 2015 2016
Based on outgoing passengers less incoming
passengers, it appears the pace of those
migrating from the island may be increasing
7
Governmental Funds Deficiency
With a declining economy and shrinking tax base, Puerto Rico’s Governmental Funds, which
provide a view of the near-term financing needs for most of the basic services of the
Commonwealth, have experienced a deficiency of revenues under expenses averaging
approximately $4 billion per year since FY2009
Most of the Commonwealth’s basic services, including education, health, public housing and welfare, public
safety, economic development and general government expenses are included within these funds as well as most
tax revenues and federal grants collected by the Commonwealth
• The Governmental Funds focus on near-term inflows and outflows, as reported on a modified accrual basis,
which is useful in evaluating the Commonwealth’s near-term financing needs
As shown below, which includes audited financial results through FY 2014, expenditures have exceeded revenues
(before financing sources) every year since 2009
• Even if principal payments are excluded, expenditures have still exceeded revenues, implying the
Commonwealth has had to finance not only principal payments but also ongoing operating deficits
Governmental Funds Deficiency of Revenues Under Expenditures ($ billions)(1)(2)
2009
2010
2011
2012
2013
2014
(3.6)
(3.8)
2015 (3)
$0.0
($1.0)
($2.0)
Average
Principal
Repayment:
$1.7 billion
($3.0)
(3.5)
($4.0)
(3.8)
(4.3)
($5.0)
(5.2)
($6.0)
2014 includes an expense of approximately $1.9 billion
related to a loan repayment to GDB funded by the 2014 GO
offering; absent this payment, deficiency of revenues under
expenses would have been approximately $2 billion
(1)
(2)
(3)
(4.0)
Average Deficiency:
Excluding Principal: ($2.3) billion
Including Principal:($4.0) billion
Cumulative Deficiency:
Excluding Principal: ($16.0) billion
Including Principal: ($28.3) billion
Source: Commonwealth CAFR Statement of Revenue, Expenditures, and Changes in Fund Balances – Governmental Funds.
Includes payments made from the Primary Government to GDB. As both entities are considered within the Fiscal Plan and thus viewed on a consolidated basis therein, the numbers presented herein are not
directly comparable to the Fiscal Plan.
Preliminary and subject to change. Results for fiscal year 2015 do not account for the results of operation of various component units, such as ASES and GDB, which have historically been presented as
“Discretely Presented Component Units” in the Basic Financial Statements but that may, as part of the fiscal year 2015 audit, be re-characterized as “Blended Component Units” and thus incorporated into the
Governmental Fund financial statements.
8
Primary Government Change in Net Position
The Change in Net Position (e.g. assets less liabilities) of the Primary Government, which
includes not only the basic services of the Commonwealth as reported in the Governmental
Funds, but also business-type activities, indicate that the Commonwealth’s financial position
has been deteriorating materially since 2009
The Primary Government change in net-position is reported using a full-accrual method of accounting that
focuses on economic resources of the Commonwealth similar to a private sector business
Over time, the change in net-position can provide a useful indicator of whether the financial position of the
Commonwealth is improving or deteriorating
• The full accrual statement summarized below, which are also based on audited results, and the modified
accrual statements presented previously are both valuable and should be read in conjunction as they help the
reader understand the long-term impact of the government’s near-term financing decisions
Primary Government Change in Net Position/Assets ($ billions)(1)
2009
2010
2011
2012
2013
2014
$0.0
($1.0)
Average: ($4.0) billion
($2.0)
Cumulative: ($24.0) billion
($3.0)
(2.7)
(3.2)
($4.0)
(3.7)
(3.9)
($5.0)
(5.4)
($6.0)
(1)
(5.1)
Source: Commonwealth CAFRs Changes in Net Position.
9
Discrete Component Units Change in Net Position
The Discretely Presented Component Units have also seen a decline in net position over time
As of 2014, the “Discretely Presented Component Units” represent 48 legally separate entities from the
Commonwealth, including PREPA, PRASA, GDB, HTA and UPR among others, and their change in net position
is reported on an full accrual method of accounting
Discretely Presented Component Units Change in Net Position ($ billions)(1)
2009
2010
2011
2012
2013
2014
0.0
(0.6)
(0.6)
-0.5
(1.3)
(1.3)
(1.1)
(0.8)
Average: ($1.4) billion
Cumulative: ($8.4) billion
-1.0
-1.5
-2.0
(2.7)
-2.5
-3.0
Impact of GDB
(note that other
than in 2014, the
GDB does not
materially impact
the net amounts
shown)
-3.5
-4.0
(1)
Source: Commonwealth CAFRs Combining Statement of Activities – Major Component Units.
10
Deficits Were Run Despite Significant Austerity Measures
To try and address the financing needs outlined previously, the Commonwealth undertook
significant austerity measures
Extraordinary austerity measures taken in the last decade include:
Reducing government consumption by 12% in real terms from 2006 through 2015(1)
Reducing public administration headcount by approximately 25%(2)
Reducing or deferring critical capital expenditures
Implementing significant new revenue measures, including recent sales and petroleum products tax increases
generating approximately $1.4 billion annually
Reforming pensions, including converting
defined benefit plans to defined contribution
plans
Of particular note, as a result of the significant
decrease in headcount, the total public sector
employees in the Commonwealth relative to its
population size is now in line with the states
Puerto Rico Government Employees (thousands)(2)
325
↓ 76,000
(25%)
300
275
250
225
2006
2007
2008
2009
2010
2011
2012
2013
2014
2015
2016
Commonwealth & Municipal Government Employment as a % of Total Population (as of Dec. 2015) (2)
12.0%
10.0%
8.0%
6.3%
6.0%
4.0%
2.0%
–
(1)
(2)
Puerto Rico Planning Board. GDB Statistical Appendix – Table 3: Gross National Product in Constant 1954 Dollars. Government Consumption Expenditures.
U.S. Bureau of Labor Statistics, Seasonally Adjusted Government Employment. Represents state and local government employees. Change in public sector employment reflects change from January 2006 through September (preliminary figures)
2016.
11
Ongoing Deficits Contributed to Large Increases in Public Sector Debt
The austerity measures were not enough to eliminate deficits or return the island to economic
growth, and from 2006 to 2014 total public sector debt increased by approximately $29 billion.
The debt now roughly equals the size of the entire Commonwealth gross national product
Note that the current administration has actually decreased the public sector debt burden, even after accounting
for missed principal and interest payments
Puerto Rico Public Sector Debt and GNP(3)(4)
($ billions, as of June 30)
$75
70
$70
62
$65
70
72
71
69
64
1.4
Puerto Rico GNP
68
58
$60
53
$55
Public Sector Debt
$50
46
Includes
approximately $1.4
billion of principal
and interest
payments missed
in FY 2016(4)
43
$45
$40
$35
$30
2006
(1)
(2)
(3)
(4)
2007
2008
2009
2010
2011
2012
2013
2014
2015
7/31/16
Puerto Rico Planning Board. GDB Statistical Appendix – Table 3: Gross National Product in Constant 1954 Dollars. Government Consumption Expenditures.
U.S. Bureau of Labor Statistics, Seasonally Adjusted Government Employment. Represents state and local government employees.
Balances shown do not include the accreted value of capital appreciation bonds. Balances are on a Puerto Rico fiscal year basis (July to June) and sourced from the Total Gross Public Debt of Puerto Rico from the Commonwealth’s Debt Monthly
Report (Tiered Operational Management Information System) and non-recourse debt of the Commonwealth as provided by the Commonwealth. Values exclude GDB and MFA bond issuance and include loans from these entities to other
Commonwealth entities.
Does not assume interest on unpaid amounts, if any. Total missed amounts shown represent the amounts missed in FY 2016, including principal and interest payments due and missed through July 31, 2016.
12
Primary Government Cash, Deposits in Governmental Banks and Investments
Since reaching a peak in 2009, cash, deposits in Governmental Banks and investments of the
Primary Government have declined materially, in particular, when excluding cash held at
governmental banks such as GDB
Primary Government Cash, Deposits in Governmental Banks and Investments(1) ($ billions)
$7.0
6.5
$6.0
5.3
5.2
5.0
$5.0
4.1
6.5
$4.0
5.3
3.3
5.2
4.1
$3.0
4.4
4.1
5.0
4.1
4.4
4.7
2.2
3.3
2.4
$2.0
2006
2007
2008
2009
Primary Government
(1)
(2)
Cash, deposits in governmental
banks and investments declined
by $1.9 billion since its peak in
2009, and by $4.1 billion when
excluding cash at governmental
banks(2) as of 2014
2010
2011
2012
2013
2014
Cash Held at Governmental Banks
Source: Commonwealth CAFR Statement of Net Assets.
Note that while the approximately $2.4 billion of cash/reserves in 2014 when excluding cash at governmental banks is not directly comparable to figures in previous years, this amount is illustratively shown to show a
more accurate depiction of government liquidity in the face of Executive Order No. 2016-010 which, among other things, restricts the withdrawal, payment and transfer of funds held on deposit at GDB to those
necessary to ensure the provision of essential services. Government Development Bank for Puerto Rico Basic Financial Statements and Required Supplementary Information, June 30, 2014, page 51.
13
Underfunded Pensions
The Government has also been financing its annual deficits by cutting contributions to the
pension system such that the unfunded pension liability has grown drastically
Puerto Rico Primary Government Obligations to its Pensions (Net Pension Obligation)(1)
In addition to growing debt, the
Primary Government’s net pension
obligation (as actuarial determined
and distinct from the full unfunded
liability of the entire retirement
system) has increased by
approximately $10 billion over this
same period
($ billions)
$16.0
$14.0
$12.0
$10.0
$8.0
$6.0
$4.0
$2.0
$0.0
13.1
14.6
11.2
4.7
5.1
5.8
2006
2007
2008
8.0
6.8
2009
2010
9.3
2011
2012
2013
2014
Puerto Rico Unfunded Pension Liability Over Time (as of Fiscal Year End)(2)(3)
($ billions)
$60
$50
$40
JRS
0.3
0.3
$20
7
(3)
0.4
ERS
$30
$10
0.4
TRS
0.3
9
0.4
10
0.4
13
15
10
7
17
20
24
26
23
2009
2010
2011
2012
2013
30
33
2014
2015
The aggregate unfunded
pension liability of ERS,
TRS, and JRS grew by
$25 billion to ~$49
billion from 20092015(3)
$0
(1)
(2)
(3)
Commonwealth Comprehensive Annual Financial Reports.
Commonwealth of Puerto Rico Financial Information and Operating Data Report November 6, 2015.
Final net pension liability for JRS as of FYE2015 is to be determined, for purposes herein, illustratively shown as the same $442 million as of FYE2014. The aggregate unfunded pension liability of ERS, TRS
and JRS was $19 billion as of FYE 2007.
14
Liquid Pension Assets Will Soon Be Exhausted
Assuming no additional contributions, the last published pension system actuarial valuation
reports suggest that absent any further AUC and AAC payments,(1) the pension systems will
exhaust their liquid assets by FY 2018
End of Year Liquid Assets for ERS, TRS and JRS, assuming no further AUC or AAC as of the latest
published actuarial valuation reports(2)(3)
($ billions)
$1,800
30
JRS
$1,600
$1,400
TRS
ERS
512
$1,200
$1,000
$800
$600
1,154
15
131
$400
518
$200
$0
2016
(1)
(2)
(3)
2017
2018
“AUC” refers to the annual additional uniform contributions from the Commonwealth required to avoid having the projected gross assets of the system fall below $1 billion during any fiscal year with respect to
ERS. “AAC” refers to the annual additional contributions required by law to avoid having during any fiscal year projected gross assets fall below $300 million with respect to TRS and $20 million with respect
to JRS. See the Actuarial Valuation Reports for further detail.
Puerto Rico Government Employees Retirement System, June 30, 2015 Actuarial Valuation Report. Puerto Rico Teachers Retirement System, June 30, 2015 Actuarial Valuation Report. Puerto Rico Judiciary
Retirement System, June 30, 2014 Actuarial Valuation Report. Chart excludes illiquid assets of $762 million at ERS and $444 million at TRS.
Amounts assume that for ERS, as of June 30, 2015, past-due AUC amounts totaling $157 million 2013 – 2015 and $352 million for 2015-2016 and amounts going forward are not received. For TRS and JRS
projection excludes any amounts from the AAC.
15
Cost of Borrowing
Thanks to its declining economic position, the Commonwealth’s credit ratings have declined
and its cost of borrowing at numerous issuers reached unsustainable proportions
Yield to Worst of Illustrative G.O., GDB non-Guaranteed, HTA ’98 Senior and COFINA Senior and Subordinate Bonds(1)
50%
As of end of FY13:
5.2% GDB non-guaranteed ’26
5.5% HTA Senior ’98 due ’25
6.0% COFINA Subordinate ’42
5.0% G.O. ’33
5.25% COFINA Senior ’57
40%
30%
20%
YTW
6.4%
5.9%
5.7%
5.8%
5.3%
As of 6/30/16:
5.5% HTA Senior ’98 due ’25
5.2% GDB non-guaranteed ’26
6.0% COFINA Subordinate ’42
5.0% G.O. ’33
5.25% COFINA Senior ’57
10%
0%
12/31/11
YTW
30.2%
23.7%
13.3%
9.1%
8.1%
PROMESA signed on 6/30/16
6/30/12
12/31/12
6/30/13
12/31/13
6/30/14
12/31/14
6/30/15
12/31/15
6/30/16
S&P Credit Rating by Major Issuance(1)(2)
25
AA
20
BBB+
15
BB10
CCC5
GO
(1)
(2)
COFINA Sr
COFINA Sub
Source: Bloomberg.
Reflects the historical credit rating of the non-CAB CUSIP in each issuance with the longest time until maturity.
GDB Non-guaranteed
HTA Sr 1998
Jan-16
Jan-15
Jan-14
Jan-13
Jan-12
Jan-11
Jan-10
Jan-09
Jan-08
Jan-07
Jan-06
D 0
Jan-05
On $70 billion of debt, even just
an 1% increase in rates would
imply $700 million of
incremental interest expense,
and the latest G.O. offering in
March 2014 was done at a yield
of 8.73% versus issuances as
recent as 2012 made at
approximately 5% for debt of a
similar duration
HTA Sub 1998
16
Without Reasonable Access to the Capital Markets and Its Large Debt Service
Burden, Puerto Rico’s Liquidity Declined To Levels that Made it Impossible to
Pay its Debts
Without access to capital markets to fund its deficits and refinance its maturing debt, the Treasury
Single Account(1) balance fell to $244 million at the end of FY 2016 as compared to $780 million of
direct general obligation debt service coming due.(2) This decline in liquidity occurred even after
taking drastic liquidity measures that reduced appropriations to other Commonwealth borrowers
which caused payment defaults prior to the end of FY 2016. In all, the Commonwealth had to
default on approximately $1.4 billion of debt service due over the course of FY 2016(3)
Total Debt Service Payments Missed in FY 2016 (including July 1, 2016 payments)(3) ($millions)
GO
GDB(4)
PBA
PFC
PRIFA Rum
HTA (5)
T otal
Am ount
Due
Am ount
Paid
Am ount
Not Paid
$1 ,1 25
1 ,025
27 6
94
113
322
$346
664
251
1
–
31 8
$7 7 9
360
25
93
113
4
$2,955
$1,580
$1,37 5
Dates of Missed Pay m ents
July 1 , 201 6
May 1 , 201 6
July 1 , 201 6
August 1 , 201 5 to July 1 , 201 6
January 1 , 201 6 and July 1 , 201 6
July 1 , 201 6
Creditors had been clearly warned about such a possibility, not only by the clear decline in economic
activity, but also explicitly in Commonwealth offering documents. For example, in its 2014 Offering
Statement for the $3.5 billion of General Obligations bonds – the largest municipal offering of all time
– the Commonwealth warned explicitly that “If the Commonwealth’s financial condition does
not improve, it may need to implement emergency measures that may include a
restructuring, moratorium or other actions affecting creditors’ rights”(6)
(1)
(2)
(3)
The Treasury Single Account is the Commonwealth’s operational bank account in which it deposits receipts
from governmental funds except for blended component units (COFINA, PBA, PRIFA, etc.)
Approximately $780 million represents $1,125 million of total principal and interest due as of July 1, 2016.
Excludes PRASA Rural Development bonds (reached forbearance agreement ahead of its payment on July 1,
2016) and GO Notes (line of credit from GDB to Treasury whose debt service on July 1, 2016 was not paid).
(4)
(5)
(6)
Amounts not paid represents amounts not paid by the Commonwealth and has not been reduced by amounts paid by insurers.
GDB debt service due shown is net of the agreed upon extension of the $40 million principal payment originally due on May
2016 to May 2017.
Unpaid amounts for the HTA bonds reflect missed payment s on the 1998 Resolution Bonds, Series 1998 Subordinate Bonds.
March 2014 General Obligation Offering Statement.
17
Section II –
Commonwealth Liquidity
18
The Scope of This Liquidity Analysis is the Treasury Single Account (“TSA”),
Which Captures ~65% of the Commonwealth’s Cash Flow
Main Category of Inflows and Outflows - TSA
Inflows:
General Fund and
Other Funds Tax
Collections, Incl.
Pledged
Revenues(3)
Federal
Funds(1) (4)
Transfers from
Pension Funds to
Pay Net Pension
Benefits (4)
Lines of
Credit & Bonds (4)
Charges
for Services(3)
Other(3)
TSA
Outflows:
Payroll &
Related
Costs (2) (3)
Pension
Benefits(4)
Suppliers,
Welfare &
Operational
Expenditures
Debt
Service
Payments(3)
Capital
Outlays(4)
Pass-through
of Pledged
Revenues(4)
Tax
Refunds(5)
(2) (3)
Formulas
&
Other
Appropriations
Other(3)
(5)
(1)
(2)
(3)
(4)
(5)
Federal funds net of disbursement of the Puerto Rico Nutrition Assistance Program.
Includes disbursements of benefits reimbursed by federal grants.
Inflows and outflows are recorded in the General Fund or Special Revenue funds.
Inflows and outflows are recorded in the Special Revenue funds or Fiduciary funds.
Outflows are recorded only in the General Fund.
19
The Historical TSA Liquidity Trends Reflect the Impact of the Historical Deficits;
Stretching of AP Has Been a Major Source of Financing in the Past Three Years
Favorable/(Unfavorable)
Comparison to Prior Year
2014
2015
2016
($ in millions)
Actual
2013
Actual
2014
Actual
2015
Actual
2016
Non-Debt Inflows
$14,671
$15,864
$16,126
$16,222
$1,193
$262
$95
Payroll-Related
(4,069)
(3,853)
(3,632)
(3,574)
215
221
58
Suppliers, Welfare and Operating Expenses
(4,836)
(4,646)
(4,180)
(3,736)
189
466
444
Pension Benefits
(1,831)
(1,991)
(2,024)
(2,040)
(160)
(33)
(16)
(684)
(978)
(768)
(615)
(294)
210
152
(4,363)
(4,607)
(5,126)
(5,130)
(245)
(519)
(4)
(15,782)
(16,076)
(15,730)
(15,096)
(294)
345
634
(1,111)
(211)
396
1,125
899
607
729
Debt Related Inflows
4,085
7,292
2,625
1,050
3,207
(4,668)
(1,574)
Debt Related Outflows
(3,152)
(7,028)
(3,188)
(1,501)
(3,876)
3,840
1,687
933
264
(563)
(451)
(669)
(828)
113
Clawback Related Outflows
–
–
–
(443)
–
–
(443)
Clawback Cash Flows
–
–
–
(443)
–
–
(443)
($178)
$53
($168)
$231
$231
($221)
$398
Tax Refunds
Other
Non-Debt Related Outflows
Non-Debt Related Net Cash Flows
Debt Cash Flows
Net Cash Flows
20
The Commonwealth Will Deplete Its Liquidity by February Under Current Law;
The Total Financing Gap for FY 2017 is Approximately $2.2 Bn
The Commonwealth will not have sufficient liquidity to meet its obligations in
February 2017, when the moratorium expires
Excluding debt service, FY 2017 will have a positive cash balance of $71 million
Summary TSA Cash Movements – June-2016 to June-2017 (Projected) ($mm)
June 2016
$244
February 2017
$104
($1,318)
($141)
June 2017
($2,181)
($33)
($934)
Moratorium
Expires
($3,036)
($3,031)
June 2016 TSA Jun - Feb Net
Cash Balance
Operating
Cash Flow
Feb Cash
Balance
Before D/S
Note: See Appendix E for additional details and notes.
Debt Service
Due in
February
Mar - Jun Net
Operating
Cash Flow
Debt Service
Due in Mar Jun
June
2017P TSA
Cash Balance
Assuming payment of moratorium, clawback
revenues and other debt service
21
The Commonwealth has Implemented Measures to Improve Liquidity, Increase
Revenue and Reduce Expenditures
Key Takeaways
FY 2015/16 Liquidity Measures
2015
2016
Fiscal Year End (June 30)
(1)
Cash Balance After Measures
$14
$244
Long Term Loan from the State
Insurance Fund issued in June 2015
($100)
n/a
Deferral of TRANs Payment
($300)
Non-Payment of General Obligation
Debt Service (2)
n/a
Non-Payment of PFC Debt Service
n/a
In addition to the measures that impacted the cash balance at year-end, intra-year
measures provided relief during the fiscal year. The impact related to fiscal 2016
was:
n/a
•
Pension fund advancements from the Retirement Systems ($328 million)
•
Suspended set-asides for General Obligation debt service ($564 million)
•
Intergovernmental TRANs funded by the State Insurance Fund, AACA and the
Puerto Rico Labor Department’s Disability Fund ($400 million)
•
Transfers of Cash (Contributions) from the State Insurance Fund and AACA related
to Act 105 ($100 million)
($633)
Budgetary measures were also taken to increase revenue and reduce expenses
($94)
•
The extraordinary austerity measures taken in the last decade include:
Reducing government consumption by 12% in real terms from 2006 through
2015(a)
Non-Payment of PRIFA Dedicated
Rum Bonds Debt Service
n/a
($113)
Non-Payment of GDB Appropriation
Debt Service
n/a
($275)
Implementing significant new revenue measures, including recent sales and
petroleum products tax increases generating approximately $1.4 billion annually
Accounts Payable Deferral (3)
($89)
($231)
Reforming pensions, converting defined benefit plans to defined contribution
plans
Deferral of Payment to
Governmental Entities (4)(5)
($78)
($119)
Fiscal Year End (June 30)
Cash Balance Before Measures
Outstanding Checks at June 30
(5)
Unpaid Income Tax Refunds at June 30
Reducing public administration headcount by approximately 25%(b)
Reducing or deferring critical capital expenditures
•
These austerity measures have not eliminated deficits, which were ultimately
finances with a ballooning debt load during the period
•
Economic decline has also persisted, combined with emigration to the U.S.
mainland, as evidenced by Puerto Rico’s population declining by 9% over the decade
($553) ($1,221)
$429
$308
$295
$264
a)
b)
(1)
(2)
(3)
(4)
(5)
U.S. Bureau of Labor Statistics, Seasonally Adjusted Government Employment. Represents state and local government employees.
Change in public sector employment reflects change from January 2006 through September (preliminary figures) 2016.
Account balance includes the TSA operating account , reserve account bank cash balances and $44 million in restricted cash. also Clawback account balances are excluded.
The GO debt obligation of $779 million was reduced by $146 million which represents available amounts in the Clawback Account to pay General Obligation debt service. Amounts in the Clawback Account are not included in this analysis as the funds are unavailable for disbursement.
Accounts payable deferral is based on actual FY 2016 PRIFAS outflows as compared to the FY 2015 PRIFAS adjusted for the June 2015 deferral.
FY 2016 excludes approximately $111 million related to intra-governmental accounts payables.
For FY 2015, outstanding checks and restricted deposits used by the Commonwealth amounted to $506 million, the sum of outstand checks ($429mm) and deferral of payments to governmental agency ($78 mm); amounts do not add up due to rounding. FY 2016 outstanding checks includes $2
million in checks in transit not in possession of Treasury.
22
Risks and Issues to Consider
•
•
After the expiration of the moratorium period on January 31, 2017, $1.3
Bn of debt is due
The cash flow projections do not include litigation related expenses
ACA
Funds
•
Significant risk of $0.8 Bn in FY 2018, increasing to $1.5 Bn in FY 2019
Act
154
•
Significant risk of $0.5 Bn in FY 2018 (half year impact), increasing to
$1.0 Bn in FY 2019
•
Liquid assets of the pension system are expected to be exhausted in FY
2018, necessitating higher contributions to the pension system (the
"AAC" and "AUC") or, subsequently, a switch to a full "pay-go" system
with even higher future payments necessary to avoid an interruption in
retiree benefit payments
•
Continued lack of access to the credit markets will put further pressure
on the CW to fund unexpected cash flow deficits internally by stretching
its accounts payable
Moratorium
Expiration
Pension
Market Access
23
Section III –
Fiscal Plan Projections
24
Section III A –
Fiscal Plan Projection Approach
25
The Fiscal Plan’s Consolidated Projection Approach
The Fiscal Plan, like Krueger Report and the Fiscal and Economic Growth Plan (“FEGP”) developed by the
Working Group for the Fiscal and Economic Recovery of Puerto Rico (the “Working Group”), takes a
consolidated approach to projecting the Commonwealth’s revenues and expenses so as to provide a
holistic view of the Commonwealth’s fiscal challenges
As explained in the Krueger Report, which was authored by a team of former International Monetary Fund
economists headed by Anne Krueger, a focus solely on the General Fund budget(which is the Commonwealth’s
primary budgeted fund) does not adequately capture the total financing needs of the Commonwealth
For example, the General Fund budget does not include capital expenditures, certain non-budgeted funds nor
the full expenses of certain public corporations that are largely reliant on the Commonwealth for their
operating budgets
In the FEGP, the Working Group adopted the approach of the Krueger team and attempted to include not only
the General Fund, but the full array of central government revenues and expenditures and all debt issuers that
are reliant, either directly or indirectly, on the Commonwealth’s taxing power
The only entities included in the CAFR but excluded from the FEGP were the municipalities and those entities
that are financially independent or are financing vehicles with no recourse to tax revenues – including PREPA,
PRASA, HFA, and Children’s Trust
The Working Group appreciated that not only were the debt issuers included in the Fiscal Plan all reliant on tax
revenues, they had overlapping claims on those revenues
For example, certain revenues, such as those traditionally appropriated to HTA or PRIFA, are explicitly
“clawbackable” to pay General Obligation indebtedness
Similarly, the GO creditors have alleged sales and use tax (“SUT”) revenues allocated to COFINA should be
considered “available revenues” to pay the General Obligation indebtedness
Furthermore, the Working Group recognized that a material amount of the debt was held or insured by parties
that had exposure to multiple credits
As such, the FEGP was developed on a consolidated basis to provide a holistic view of the economic resources
available to pay all of the debt of the Commonwealth entities included in the projections
The FEGP approach, in and of itself, does not presume an allocation of economic resources to one credit or
another
The Oversight Board’s request of the entities to include in the Fiscal Plan mirrored the entities included in the
FEGP, and as such the same consolidated approach was taken in the Fiscal Plan
26
Debt of Entities Included in the Fiscal Plan
Per the Oversight Board, “the Commonwealth’s Fiscal Plan shall include all agencies,
departments, offices, administrations, programs and functions that are part of the central
government” as well as specifically enumerated bond issuer entities, as outlined below
Inclusive of missed interest payments and accrued interest on capital appreciation bonds (“CABs”, e.g., zero coupon bonds), these
entities have ~$50 billion of bonds and third-party loans outstanding (excluding GDB or other intergovernmental loans(1))
Note that the debt balances shown below are preliminary, unaudited estimates of debt outstanding, which are subject to continued
diligence and may change
Summary of Debt Outstanding for Plan and Non-Plan Entities(2) ($ millions)
Bond
Principal (2)
In addition to
these debt issuers,
all of the
Commonwealth’s
retirement
systems are also
incorporated into
the plan
Debt Issuers
Included in the
Fiscal Plan
1.
2.
3.
4.
Issuers Specifically Identified By the Board
GO
$1 2,47 0
COFINA
1 5,21 3
(7 )
HTA
4,253
PBA
3,995
5.
6.
7.
8.
GDB(8)
ERS
PRIFA (9)
PFC
9. UPR(1 0)
1 0. PRCCDA
1 1 . PRIDCO
Priv ate
Loans (5)
T otal Bonds
and Priv ate
Loans
Memo: Loans
from GDB/MFA/
& CW Entities (6)
Memo:
Total Entity
Indebtedness
$49
2,082
63
10
$353
–
1
–
$24
–
–
–
$1 2,896
1 7 ,294
4,31 7
4,005
$1 69
–
1 ,7 34
1 82
$1 3,066
1 7 ,294
6,051
4,1 87
3,81 1
2,948
1 ,926
1 ,091
–
1 93
1 60
–
–
–
72
57
204
–
–
–
4,01 5
3,1 41
2,1 58
1 ,1 47
–
–
49
–
4,01 5
3,1 41
2,207
1 ,1 47
496
386
1 54
–
–
5
–
–
–
0
–
–
496
386
1 59
76
1 45
78
57 3
532
237
Other Debt Issuers Prim arily Supported by Central Gov ernm ent Rev enues
1 2. AMA
–
–
–
1 3. Other Central Gov 't Entities (1 1 )
226
–
–
28
16
28
242
–
3,521
28
3,7 63
37
590
–
85
–
2,7 1 1
8,992
4,57 1
1 ,439
581
86
4,542
T otal Entities in Plan
Debt Issuers
Ex cluded
From the
Fiscal Plan
CAB
Missed Bond
Accretion (3)
Interest (4)
1.
2.
3.
4.
5.
6.
Debt Issuers Not Incl. in the Plan
PREPA (1 2)
PRASA (1 3)
Children's Trust
HFA
PRIICO
Municipality Related Debt (1 4)
T otal Entities Outside of Plan
T otal
$46,969
$2,561
$483
$27 2
$50,286
8,259
3,948
1 ,1 51
496
–
632
$14,485
–
28
288
–
–
–
$316
–
–
–
–
–
–
–
696
4
–
–
86
1 ,200
$1,986
8,955
3,981
1 ,439
496
86
1 ,832
$16,7 87
$61,454
$2,87 7
$483
$2,259
$67 ,07 3
Memo: Bridge to Public Sector Debt
Less: CAB Accretion
Less: Missed Bond Interest
Less: GDB Bonds (15)
Less: MFA Bonds
Plus: Loans From GDB/MFA/Other CW Entities
Public Sector Debt
(2,87 7 )
(483)
(3,7 66)
(61 8)
9,37 9
$68,7 07
Note: See appendix for footnotes. All debt balances shown are preliminary, unaudited estimates based on bonded debt outstanding as of July 2, 2016 and loan balances of June 30, 2016; as such, the amounts shown are subject to continued diligence
and subject to change. See the Commonwealth Operating Report to see additional details on what is and is not included in the definition of public sector debt.
27
Debt of Entities Included in the Fiscal Plan All Rely, Directly or Indirectly, on the
Commonwealth’s Taxing Authority
All of the entities included in the Fiscal Plan rely on the Commonwealth central government’s taxing
authority, either directly from tax revenues allocated by law or indirectly from appropriations included in the
Commonwealth’s General Fund (the Commonwealth’s primary operational fund)
Certain entities that have issued debt backed by allocated tax revenues have revenues that are either explicitly
“available revenues” that may be diverted to pay Commonwealth general obligations (HTA, PRCCDA, AMA,
PRIFA) or have been alleged in litigation by general obligation debt holders to be an “available revenue”
(COFINA)
Central Government Collected Revenues
General Fund Directly Pays Debt Service
General Obligation Debt
Reliant on General Fund Appropriations
Payable from Allocated Tax Revenues
COFINA
HTA
PRIFA
PRCCDA
AMA
PBA
93%(1) of revenues from the lease payments budgeted in the GF (also fully guaranteed by the CW)
GDB
Appropriations made to pay loans owed by CW entities to GDB, which GDB uses to pay its own debt
The Commonwealth is typically responsible for approximately 79%(2) of the total AUC contributions to ERS (of
which the central government contributes approximately 62%) and nearly all of the contributions to TRS and JRS
PFC
Directly reliant on appropriations to pay debt service; does not have any other revenues
UPR
Receives ~74%(3) of annual revenues from General Fund appropriations and allocated tax revenues
PRIDCO(4)
Receives withholding and rum taxes; rental revenue mostly from entities that receive tax subsidies
Consists of certain discretely presented non-major component units, including entities such as ADEA that receive
transfers from the central government
ERS
Other
(1)
(2)
(3)
(4)
Source: Conway MacKenzie PBA 5-Year Projections dated July 20, 2015. Percentage shown (93%) represents FY 2016 lease payments made by agencies in the General Fund (i.e., excluding agencies outside the General Fund and municipalities).
Percentages shown per ERS and includes the AUC contributions for component units that are included in the Fiscal Plan and does not include municipalities. (67% to 70%) represent special law, AUC, and employer contributions from the General Fund as a
percentage of total contributions, excluding investment income.
Source: Conway MacKenzie UPR projection included in FEGP dated January 18, 2016. Percentage shown (74%) represents FY 2016 Commonwealth appropriations and dedicated tax revenues including collections from slot machines (excluding federal transfers and
Pell Grant funding) as a percentage of total cash inflows (excluding debt proceeds which are non-recurring). Excluding slot revenues, UPR receives 70% of revenue from General Fund appropriations.
While PRIDCO receives appropriations for portions of the non-resident withholdings tax and rum excise taxes, such revenues are not specifically dedicated to the payment of debt service. However, PRIDCO’s rent revenues are attributable to its ability to provide tax
subsidies to private sector companies.
28
There is Significant Cross-Ownership of Commonwealth Debt
In addition to the reliance of many Commonwealth entities on a single tax base, it is also important to note
that there are many holders that individually own bonds of multiple Commonwealth entities
Puerto Rico has hired Bondholder Communications Group (“BondCom”) to develop a registry of Ultimate Beneficial
Owners (“UBOs”) of the Commonwealth’s bonds; to date over 350,000 UBOs have been identified, representing 68% of
the Commonwealth’s total bonded debt
Shown below is a select set of large mutual funds that own significant amounts of bonds of numerous Commonwealth
issuers, illustrating the large number of crossholdings
Estimated Holdings by Credit of Certain Large Funds(1) ($ millions)
Holdings ($ )(1)
Large Mut ual
Large Mut ual
Large Mut ual
Fund Holder #1 Fund Holder #2 Fund Holder #3
Ent it y
Holdings (%)
Tot al
Fiscal Plan Ent it ies
GO
$51 6
$1 ,045
$2 3 1
$1 ,7 93
GDB
–
<1
–
0
PBA
172
7 02
18
891
PFC
1 34
41 7
–
551
1 ,3 7 1
2 ,060
882
4,3 1 3
COFINA
PRIFA
9
41 1
6
42 7
(2)
–
1 96
–
1 96
PRCCDA
–
1
–
1
PRIDCO
–
–
–
–
HTA
–
3 92
27
41 8
ERS
2
–
–
2
MFA
–
59
–
59
UPR
Fiscal Plan Ent it ies Tot al
$ 2,205
$ 5,283
$ 1,164
PREPA
803
969
178
PRASA
–
42 0
21 6
63 6
CTF
61
1 ,068
–
1 ,1 2 9
HFA
6
<1
–
6
AFICA - Guay nabo
–
6
–
6
Ent it ies Excl. From Fiscal Plan Tot al
Tot al
(1)
(2)
$ 8,652
BondCom’s work is ongoing. In
addition to the three large mutual
funds shown here, over 7,300 other
retail and institutional investors
have been identified that own bonds
issued by five or more Puerto Rican
issuers. In aggregate, these crosscredit investors are estimated to
hold over $12.7 billion of debt issued
by various Puerto Rico issuers (in
addition to the holdings of the
mutual funds shown)
1 ,949
$ 87 0
$ 2,463
$ 394
$ 3,7 26
$ 3,07 5
$ 7 ,7 46
$ 1,557
$ 12,37 8
Information shown based on data provided by Bondholder Communications Group (“BondCom”). Balances as of September 28, 2016 and include CAB accretion as of June 30, 2016. Bondcom is in the midst of updating the
registry to October 2016, and it is also expanding the registry’s coverage beyond the 68% portion included currently. As a result, these amounts are subject to change. Note that some of these holdings may be insured.
Includes bonds issued by AFICA – Desarrollos Universitarios, a component unit of the University of Puerto Rico.
29
Insurance Providers Also Have Exposure to Multiple Issuers
In addition to the cross-holdings of individual holders, certain monoline insurers also have
significant exposure to multiple entities
Monolines insuring Commonwealth debt include:
AMBAC Assurance Corporation (“AMBAC”)
Assured Guaranty (“Assured”)
Financial Guaranty Insurance Company (“FGIC”)
MBIA Inc./National Public Finance Guarantee Corporation (“MBIA”)/(“National”)
Syncora Holdings (“Syncora”)
Note that the total insured amounts as shown below are as listed in the most recently available insurer financial
statements. Reporting methodology may vary materially across insurer
Estimated Select Insurer Exposure Summary ($ millions)
Assured (1)
Entity
Commonwealth (GO)
MBIA (2)
FGIC (3)
AMBAC (4)
Sy ncora(5)
$1,615
$7 95
$27 9
$56
$218
HTA
COFINA
PRIFA
PBA
1,27 9
27 0
18
188
7 15
684
–
190
437
–
349
8
47 2
805
503
191
7
–
–
–
PRCCDA
UPR
PRIDCO
164
1
–
–
89
7
97
–
–
137
–
–
–
–
–
$3,535
$2,480
$1,169
$2,163
$225
7 44
388
387
–
1,354
–
–
26
–
–
–
–
–
–
–
–
241
–
–
29
$5,054
$3,860
$1,169
$2,163
$494
T otal Exposure to Fiscal Plan Entities
PREPA
PRASA
MFA
All Other
T otal Exposure
Note: Insurer exposure shown herein based on 2Q 2016 company filings and/or investor presentations. Excludes CIFGNA, which is pending a merger with Assured as of March 31, 2016.
(1)
Values represent net par outstanding. Includes CABs that reflect gross par amount at time the policy was issued.
(2)
Values represent gross par outstanding.
(3)
Values represent net par in force.
(4)
Data derived from Ambac Financial Group document titled "Puerto Rico Exposure Second Quarter 2016." Amounts shown based on a net par basis (net of reinsurance), including CABs which are reported at the part amount at the time of issuance of the insurance policy.
(5)
Data derived from Syncora Guarantee Second Quarter 2016 Highlights Investor Presentation dated September 21, 2016. Includes reinsurance and bonds purchased for remediation (which are reported at GAAP carrying value for the insured bonds). Excludes total
interest outstanding of $104.7 million as of June 30, 2016.
30
Puerto Rico Residents are Estimated to Hold at Least $6 Billion of
Commonwealth Bonds and Have Additional Coops Exposure
While due diligence into the exact amount of local holdings remains ongoing, based on
BondCom’s work to date it is believed that a sizeable portion of Commonwealth debt is held
on-Island, with holdings across the Commonwealth credits, but particularly concentrated in
the bonds that are not triple-tax exempt issued by COFINA, ERS, GDB, and PFC
Current Estimate of Local Holdings as Identified by Bondcom(1)
($ millions)
Issuer
GO
COFINA
HTA
PBA
GDB
ERS
PRIFA (2)
PFC
UPR(3)
CCDA
PRIDCO
PREPA
PRASA
CTF
MFA
HFA
T otal
Local
Local
Coop Holdings Non-Coop Holdings
92
1 81
3
39
369
4
4
63
–
<1
15
55
52
–
–
<1
$87 6
T otal Local
Holdings
307
2,642
54
242
986
1 ,224
16
204
2
11
72
305
21 6
<1
3
91
399
2,823
57
281
1 ,356
1 ,228
19
267
2
11
86
360
268
<1
3
91
$6,37 6
$7 ,252
Market information indicates that the Coop systems have exposure
of approximately $1.1 billion of Puerto Rico debt; the numbers above
represent only those CUSIPs identified by BondCom to date
(1)
(2)
(3)
The large local exposure to
Commonwealth credits suggests
that any debt restructuring could
have a material impact on the
Commonwealth economy, which
each of the credits included in the
fiscal plan is ultimately dependent
upon for their debt service
payments given they depend on tax
revenues. When this fact is
combined with the fact that the
credits in the Plan have overlapping
claims on revenues, large cross
holders, and insurers with large
cross-exposure to multiple credits,
it becomes apparent that to fully
resolve the challenges facing each
credit on the island and to
determine a truly sustainable debt
service burden requires a holistic
understanding of the
Commonwealth’s fiscal position
Information shown above based on data provided by Bondholder Communications Group (“BondCom”). Balances as of September 28, 2016 and include CAB accretion as of June 30, 2016. BondCom’s investor database currently accounts for
68% of all current Puerto Rican bonded debt outstanding. Pending further diligence by BondCom regarding investors of Puerto Rican bonded debt, BondCom estimates reflected herein provide a lower bound of estimated debt by holder,
particularly local bond holders. BondCom is currently working to update the bond owner registry to October 2016.
Excludes PRIFA BANs.
Include bonds issued by AFICA – Desarrollos Universitarios, a component unit of the University of Puerto Rico.
31
Section III B –
Fiscal Plan Base Projections
32
2017 Fiscal Plan “Base” Projection - Revenues
The Fiscal Plan is presented first as a “Base Projection” that assumes no changes to current
laws or policies or additional “measures” by the Commonwealth or the U.S. federal
government. Applying the consolidated approach outlined previously, the FY 2017 “Base
Projection” begins with the FY 2017 General Fund budgeted revenues and then incorporates
tax and other non-tax revenues traditionally outside of the General Fund, as shown below
Base Revenue Components
Item
GF
Revenues
Additional
SUT
Details
GF includes a majority of taxes, such as income, withholding and
the GF portion of the sales and use tax; projection based on the FY
2017 budget
Includes additional SUT collections historically allocated to entities
outside the GF such as COFINA (the GF revenues include a portion
of SUT)
Other Tax
Revenues
GDB
Inflows
Other Tax Revenues recorded outside of the GF, including those
assigned to component units. The largest single amounts in this
group are Petroleum Products and Gas taxes, Cigarette Taxes, and
Casino Slot Revenues
Largest amounts of non-tax revenues relate to charges for services
such as tuition and fees at UPR, HTA revenues such as road and
train tolls and revenues from other entities with bonded debt
outstanding (i.e., PRIDCO and PRCCDA). Also includes net lottery
revenues as well as net revenues from select entities historically
producing surpluses (i.e., the State Insurance Fund and the
Automobile Accident s Compensation Administration).
Represents transfers from the Federal Government that are applied
to specific required expenditures and therefore are set equal to the
transfers out, resulting in a net zero impact on the financing gap
Represents GDB net loan and deposit inflows from entities
excluded from the Fiscal Plan; excludes intra-governmental
transfers from entities included in the Fiscal Plan (that is to say, a
payment from the GF to GDB is eliminated in the Plan as it just
moves assets from one entity in the plan to another and doesn’t
impact the Commonwealth’s overall fiscal position)
Other
Non-Tax
Revs.
Federal
Transfers
FY 2017 Fiscal Plan Base Revenues ($ millions)
FY 2017
General Fund Rev enues ("GF")
Additional Sales and Use Tax ("SUT")
Other Tax Rev enues
Other Non-Tax Rev enues
Fiscal Plan FY 2017 Adjusted Rev enues
Federal Transfers
GDB Inflows
Fiscal Plan FY 2017 T otal Rev enues
$9,045
844
1 ,342
598
$11,829
7 ,000
236
$19,065
33
2017 Fiscal Plan “Base” Projection – Expenses Before Debt Service
The consolidated approach expenses also start with the General Fund Budget for FY 2017,
adjusted to exclude debt service of certain entities reliant on General Fund appropriations and
contributions to the retirement system as those amounts are shown separately, and then
incorporates the expenses of entities and funds typically outside of the General Fund
Base Expenses Components (ex. Debt Service)
Item
Run-Rate Capex
Includes primary functions of the central government,
such as healthcare, public safety and education;
excludes debt service and shown after a reduction of
debt service for entities largely funded by
appropriations, such as PBA and UPR
Represents estimates, developed in conjunction with
actuarial work done by Milliman, of the legally
required AUC and AAC, as well as “catch-up” payments
Based on OMB FY 2017 Budget
Includes the operating expenses of component units
such as HTA and UPR, the net deficit of certain special
revenue funds (ex. tax revenues), the net result of
certain enterprise funds that have historically
produced a loss, and the net deficit of other major and
non-major component units; Based on individual
entity projections developed by Conway or entity
management
Special Revenue
Funds, Enterprise
Funds, Component
Units (See the
Appendix for a by-entity
breakdown in FY 2017)
Disbursements to
Entities Outside Plan
Includes tax and other revenues (such as cigarette
excise tax, rum excise tax and lottery related outflows)
sent to entities outside of the model (such as to the rum
producers and municipalities)
Oversight Board
Based on U.S. Congressional Budget Office estimate
Federal Programs
The expenses associated with Federal Transfers
GDB loan and deposit disbursements to entities
outside the model
GDB Outflows
(1)
(2)
FY 2017
Details
GF Budget
Incr. Retirement
System
FY 2017 Fiscal Plan Base Expenses ($ millions)
Includes certain component unit projections that were developed by consulting with management including: HTA,
(3)
ASEM, ASES, ADEA, Cardiovascular Center, PBA, PRITA, Ports Authority, UPR, PRCCDA, PRIDCO and Tourism
(4)
Company. Also includes non-major component units that were projected based on a review of available historical results. (5)
Incremental contributions represent the Annual Additional Contributions (“AAC”) required to be paid to the Teachers
(6)
and Judicial Retirement Systems and the Additional Uniform Contribution (“AUC”) required to be paid to the Employees
Retirement System based on estimates provided by the Commonwealth’s actuaries. The amount shown excludes
(7)
payments of certain past-due amounts from previous years, which are shown separately in the memo.
General Fund Budget (ex . Debt, AAC/AUC)
Incr. Retirement Sy s. Contributions ex . Catch-Up (2)
Estimated Run-Rate Capex (for FY 201 7 )
Special Rev . Funds, Enterprise Funds, Comp. Units (3)
Disbursements to Entities Outside Plan
Adj. Ex penses ex . Debt Serv . And Catch-Up
($8,1 02)
(642)
(283)
(855)
(330)
($10,212)
Ov ersight Board Costs
Federal Programs
GDB Outflows
(200)
(7 ,000)
(236)
Ex penses ex . Debt Serv . and Catch-Up
($17 ,648)
Memo: AAC/AUC Catch-Up
AAC/AUC Catch-Up Payment
Expenses ex. Debt Serv. Incl. Catch-Up
(405)
($1 8,052)
Mem o: Adjusted General Fund Budget
General Fund Budget
Plus: Deposit Amount Embedded in GF Budget
Plus: AAC/AUC in GF Budget (4)
Debt Service Adjustments
Plus: TRANs (5)
Plus: GDB (5)
Plus: UPR (6)
Plus: ERS (7)
Adjusted General Fund Expenses
($8,987 )
220
266
24
1 65
43
1 67
($8,102)
See the appendix for a more detailed by-entity breakout for FY 2017.
Backed out of General Fund Budget and illustratively shown in the “AAC/AUC” line.
Debt service has been eliminated as the flows are intragovernmental.
34
Illustrative as UPR receives a majority of its revenues from appropriations. Debt service is shown separately in the Fiscal
Plan and is thus excluded from the above exhibit.
Illustrative as ERS receives a majority of its revenues from appropriations. Debt service is shown separately in the Fiscal
Plan and is thus excluded from the above exhibit.
2017 Fiscal Plan “Base” Projection – Surplus/(Gap)
The FY 2017 Base Projection suggests that, prior to any “measures” (such as the payment of
past-due payables, tax refunds, contributions to the retirement system,(1) or incremental
capital expenditures) and prior to any debt service and past-due contributions to the pension
system, the Commonwealth would produce a surplus of approximately $1.4 billion in FY 2017.
After debt service and past-due amounts owed to the pension system, but still before any
measures, the Commonwealth would be expected to have a deficiency of revenues as
compared to expenditures (a “Financing Gap”) of $3.6 billion
FY 2017 Fiscal Plan Base Expenses ($ millions)
FY 2017
Total Rev enues
Total Ex penses ex . Debt Serv . and Catch-Up
1 9,065
(1 7 ,648)
FY 2017 Surplus pre-Debt Serv . ex . Catch-Up
$1,418
Less: AAC/AUC Catch-Up
FY 2017 Surplus pre-Debt Serv ice
Less: Current Contractual Debt Serv ice
Less: Past-Due Contractual Debt Serv ice
Plus: Use of Ex isting Reserv es
FY 2017 Financing Gap
(405)
Note that the annual AUC/AAC amounts
included in the Base Projections was
estimated assuming these past due amounts
were paid; to the extent these amounts are not
paid the future AUC/AAC could increase (or
the system could deplete its assets sooner)
$1,013
(3,622)
(1 ,37 5)
37 9
Represents missed principal and interest
payments to come due at the end of the
moratorium period
($3,605)
Memo: Financing Gap excl. Past-Due AUC and Past-Due Debt
FY 201 7 Surplus Pre-Debt Serv. ex. Catch-Up
$1 ,41 8
(2)
FY 201 7 Contractual Principal (ex. Past-Due)
(1 ,249)
FY 201 7 Contractual Interest (ex. Past-Due)
(2,37 3)
Financing Gap ex. Past-Due Amounts
(2,204)
(1)
(2)
Note that the AAC/AUC catch-up payment was included in the “Base” projection in the Fiscal Plan as it is required by law to be paid.
Includes TDF Guaranteed debt service, which in FY 2017 primarily consists of principal coming due on certain guaranteed loans.
35
FY 2017 Fiscal Plan “Base” Projection – Entity Basis
While the Fiscal Plan takes a consolidated approach, the same surplus prior to measures can
be ascribed to entities where revenues have historically been associated. For example, tax
revenues historically allocated to HTA would generate a surplus at HTA absent debt service.
The sources of the $1.4 billion surplus outlined previously on this basis is shown below, but it
must be noted that the presentation below does not suggest these entities are entitled to such
surplus as revenues may be subject to diversion to pay other essential services or other debt
service
Mem o: General Fund Breakout
General Fund Revenues
Adj. GF Expenses (see build below )
Net Inflows from Adj. GF
FY 2017 Net Surplus / (Deficit) ($ millions)
FY 2017
Net
General Fund ("GF") (ex . AAC/AUC and Debt Serv ice)
HTA (ex . Capex and Debt Serv ice)
PRIFA Rev enues Outside General Fund (6)
UPR Net Inflow / (Outflow) Outside GF Budget (ex . Capex )
GDB Net Inflow / (Outflow)
COFINA Pre-Debt Serv ice
PRCCDA Room Tax (Portion Equal to Debt Serv ice)
CRIM
AAC/AUC
Base Capex
Ov ersight Board Costs
ASES Net Inflow / (Outflow) Outside GF Budget (ex . Capex )
Other (8)
Surplus Pre-Meas. and Debt Serv . (per Fiscal Plan pg. 86)
Plus: AAC/AUC Catch-Up
Surplus Pre-Meas. and Debt Serv ice ex . Catch-Up
$943
525
1 57
99
–
7 24
30
1 04
(1 ,046)
(283)
(200)
(38)
(1 )
$1,013
$405
$1,418
Mem o: Adjusted General Fund Budget
General Fund Budget
Plus: Deposit Amount Embedded in GF Budget
Plus: AAC/AUC in GF Budget (1)
Debt Service Adjustments
Plus: TRANs (2)
Plus: GDB (2)
Plus: UPR (3)
Plus: ERS (4)
Adjusted General Fund Expenses
Mem o: HTA Breakout
Historically Associated Revenues (5)
Expenses
Net Inflows (ex. Capex, Debt Serv.)
Mem o: UPR Beakout Outside GF Budget
Revenues
Expenses
Net Inflows (ex. Capex, Debt Serv.)
Mem o: UPR Net Cost Incl. GF Appropriation
UPR Net Inflow / (Outflow) Outside GF Budget
Less: GF Appropriation ex. Debt Service (7)
Net Cost (Excluding CapEx, Debt Service)
Mem o: AAC/AUC in Base - Breakout
Annual Requirement Within GF Budget
Annual Requirement Outside GF Budget
Catch Up Payment
AAC/AUC in Base
Mem o: ASES Breakout Outside GF
Inflows
Outflows (ex. Capex)
Net Inflows from ASES
Mem o: ASES Net Cost Incl. GF Appropriation
ASES Net Inflow / (Outflow) Outside GF Budget
Less: GF Appropriation
Net Cost (Excluding CapEx)
(1)
(2)
(3)
(4)
(5)
(6)
(7)
(8)
Backed out of General Fund Budget and illustratively shown in the “AAC/AUC” line.
Debt service has been eliminated as the flows are intragovernmental.
Illustrative as UPR receives a majority of its revenues from appropriations. Debt service is shown separately in the Fiscal Plan and is thus excluded from the above exhibit.
Illustrative as ERS receives a majority of its revenues from appropriations. Debt service is shown separately in the Fiscal Plan and is thus excluded from the above exhibit.
Includes revenues that are historically associated with HTA, but may have been, and may continue to be, clawed back.
Represents the excise tax on petroleum products (“La Crudita”) allocated to PRIFA. Other excise taxes on petroleum products illustratively included under HTA.
Represents the general fund appropriation to UPR, excluding the portion equal to debt service, as debt service is shown separately in the Fiscal Plan and is thus excluded from the above exhibit.
Includes the net surplus / (deficit) of component units, the SIF, special revenue funds, and other line items. Line items in “other” may include large positive or negative figures but, in the aggregate, mostly net out.
$9,045
(8,1 02)
$943
($8,987 )
220
266
24
1 65
43
1 67
($8,102)
$7 7 1
(246)
$525
$1 ,27 5
(1 ,1 7 6)
$99
$99
(830)
($731)
($266)
(37 5)
(405)
($1,046)
$2,899
(2,937 )
($38)
($38)
(885)
($923)
36
FY 2017 TSA Net Cash Flow to Fiscal Plan Bridge
The FY 2017 projected surplus is consistent with the FY 2017 TSA projections (pre-debt
service) once the entities and other cash flows outside the TSA are accounted for
The bridge below is shown from the net cash flow for the TSA projection in 2017 to, first, the surplus before debt
service and past-due AUC amounts in the Plan and then to the gap after FY 2017 debt service (still excluding past
due AUC and debt service amounts, which are detailed further on the following page)
FY 2017 TSA Net Cash Flow to Fiscal Plan Liquidity Bridge ($ millions)
FY 2017
Net
FY 2017 TSA Net Cash Flow ex. Debt Service
Debt Service Savings at Entities Receiving Transfers from the TSA
TRANs (intragovernment)
GDB Loan Payment (intragovernment)
UPR Debt Service
ERS Debt Service
(2)
HTA Debt Service Associated Revenues
(2)
PRIFA Petroleum Debt Service Associated Revenues
PRCCDA Debt Service
(2)
PBA Revenues Associated with Debt Service
Total Debt Service Savings
($174)
(1)
24
165
43
167
334
64
30
72
899
COFINA PSTBA (Outside of TSA)
724
Component Units Outside of the TSA
183
Oversight Board Costs (Costs Excluded from TSA Net Cash Flow)
(200)
Capex (Outside of TSA) (3)
(283)
(4)
Estimated Past Due Tax Refunds / Payables
paid by TSA
Fiscal Plan Surplus Pre-Meas. and Debt Serv. ex. AAC/AUC Catch-Up
269
The largest drivers of the
variance between the TSA cash
flow and the FY 2017 fiscal plan
are: (1) the TSA has outflows to
certain component units that are
able to generate savings if debt
service is excluded and (2) the
TSA excludes COFINA revenues
While included in the Fiscal
Plan, payments are embedded in
the measures
Represents the estimated
surplus available to the
Commonwealth before debt
service, legacy liabilities, and
measures(5)
$1,418
Note: Additional diligence is being conducted on accounts payable and net cash flow attributable to Special Revenue Funds inherent in the TSA cash flows.
(1) Includes entities where the TSA was previously clawing back revenues.
(2) Revenues sent from the TSA to these entities.
(3) Diligence on the precise amount of the payables slated to be paid by the TSA that are significantly past due remains ongoing.
(4) Includes $8 million payable owed to the pension system.
(5) Note that certain component unit projection may contain past-due accounts payable payments.
37
Fiscal Plan Base Projection Beyond FY 2017
As shown in the Fiscal Plan Base Projections submitted to the Oversight Board on October
14, over the ten year period from FY 2017 to FY 2026 the Base Projection estimate a $59 billion
excess of expenses over revenues after debt service and past-due AUC/AAC amounts. Even
excluding debt service and the past-due AUC/AAC amounts, however, the Fiscal Plan
suggests a $23 billion excess of expenses over revenues, suggesting the $1.4 billion surplus
shown previously becomes a shortfall over the projection period. The driver of that decline in
surplus is driven primarily by the six items outlined below
Challenge
Loss of ACA Funding
(together with the 154
losses and the retirement
contributions shown
below, make up the three
“Fiscal Cliffs”)
Estimated Act 154 /
Foreign Company Tax
Losses
Incremental Retirement
System Contributions(2)
Expiration of Act 66
Healthcare Cost
Increases
Description
The Commonwealth received a set amount of Affordable Care Act funds that are expected to be exhausted by FY 2018. After
the exhaustion, the Commonwealth would still receive healthcare funding, but at levels far lower than those given to the
states (for example, Medicaid transfers are capped at approximately $300 million annually excluding the Children’s Health
Insurance Program)
Note that the Fiscal Plan calls on the U.S. Federal Government to correct this inequitable healthcare treatment, but in the
Base Projections, as it reflects current policies, it is assumed the ACA funding is not replaced and further that the
Commonwealth continues to fund its already struggling healthcare system
The Fiscal Plan provides and estimate for the loss of tax revenues from the conversion of the Act 154 excise tax to a modified
source income rule in FY 2018 (FY 2018 is a half year impact); the assumed loss is based on discussions with certain 154
excess tax payers and, in the measures, it is assumed there is no loss of funds (1)
The depletion of liquid assets in the retirement systems, expected to occur on or before FY 2018, will require increased
contributions to the pension system to avoid the interruption of benefit payments; the Base Projections assume these
contributions are based on the legally required AAC/AUC payments
Act 66 is currently scheduled to expire in FY 2018; note that in the measures Act 66 is assumed to be extended
Healthcare costs are projected to increase at a rate significantly higher than inflation over the Fiscal Plan’s ten-year
projection period (even before the loss of ACA funds) based on detailed projections developed by ASES in conjunction with
Conway and Milliman
The Base Projection assume a continued decline in the Commonwealth economy on a real basis of 1.7% average per year
(with inflation of approximately 1.8% per year(3)). The economic projections were developed by Dr. Rafael Romeu, a former
IMF economist hired by AAFAF who is the President and CEO of DevTech Systems, Inc. (“DevTech”), an international
economic consulting firm founded
Note that the real growth plus inflation drives most revenue projections past FY 2017 in the projections and inflation drives
many of the expense estimates past FY 2017
Economic Contraction
(1)
(2)
(3)
The projection assumes that Act 154 excise tax credit is not ruled to be uncreditable under U.S. tax law.
Incremental contributions represent the Annual Additional Contributions (“AAC”) required to be paid to the Teachers and Judicial Retirement Systems and the Additional Uniform Contribution (“AUC”) required to be paid to the Employees
Retirement System based on estimates provided by the Commonwealth’s actuaries incorporating updated assumptions regarding items such as changes in the size of the active membership and future payroll assumptions consistent with the
Fiscal Plan. The amount shown includes payments of certain past-due amounts from previous years, as such amounts are assumed to have been paid in work performed by the actuaries. Note that the AAC/AUC is intended to prevent the pension
systems’ liquid assets from being depleted. If the AAC/AUC is left unpaid, there may be savings in the early years of the projections, but higher payments in future years.
Inflation is projected to run at a CAGR of 1.8% from 2018 to 2021.
38
Fiscal Plan Base Projection Beyond FY 2017: FY 2017 to FY 2021
Driven in large part by the items outlined on the prior page, from FY 2017 to FY 2021, the $1.4
billion surplus before measures, past due AUC/AAC amounts and debt service declines to a
shortfall of $2.5 billion per year. The following page shows a further decline to a deficit of $4.4
billion per year by FY 2026
Note that the projections are shown before and after the estimated impact of economic contraction
The cumulative 5-year impact of economic contraction of $859 million is based on a decline in real GDP growth from
0% real GDP growth per year to negative 1.7%; for comparison purposes, inflation is held constant at a CAGR of 1.8%(1)
The size of the financing gap detailed below assumes no measures are taken to fill the gap; if the Commonwealth were
forced to only pursue austerity-type measures to address this shortfall, it is estimated real GDP contraction would intensify
Summary of Cumulative “Financing Gap” Under Current Laws and Policies from FY 2017 to FY 2026 ($ millions)(2)
2018P
2019P
2020P
2021P
Total
'17-'21
$19,065
–
–
$19,065
$19,282
(481)
(865)
$17,935
$19,545
(962)
(1,517)
$17,066
$19,785
(962)
(1,583)
$17,240
$20,052
(962)
(1,681)
$17,409
$97,728
(3,367)
(5,646)
$88,715
(16,083)
–
(923)
(642)
($17,648)
(16,492)
(178)
(807)
(572)
($18,049)
(16,603)
(257)
(835)
(1,172)
($18,867)
(16,758)
(336)
(944)
(1,172)
($19,210)
(16,915)
(416)
(1,008)
(1,172)
($19,510)
($82,851)
(1,187)
(4,517)
(4,729)
($93,284)
–
–
(139)
(281)
(438)
(859)
2017P
Revenues pre-Act 154 and ACA Funding Losses
Est. Act 154 / Foreign Company Tax Losses
ACA Funding Loss
Total Revenues
Expenses ex. Debt Serv. and Items Listed Below
Expiration of Act 66
Healthcare Expenses
Incr. Retirement Sys. Contributions ex. Catch-Up
Total Expenses ex. Debt Service
Less: Economic Contraction (3)
Base Fin. Gap pre-Debt Service ex. Catch-Up
$1,418
($114)
($1,941)
($2,251)
($2,540)
($5,427)
Memorandum:
Less: AAC/AUC Catch-Up
Base Fin. Gap pre-Debt Service
(405)
$1,013
–
($114)
–
($1,941)
–
($2,251)
–
($2,540)
(405)
($5,832)
(4,618)
($3,605)
(3,294)
($3,408)
(3,872)
($5,813)
(3,493)
($5,744)
(3,438)
($5,978)
Less: Debt Service Net of Existing Reserves
Fiscal Plan Base Financing Gap
(1)
(2)
(3)
(4)
(4)
(18,715)
($24,547)
Inflation is projected to run at a CAGR of 1.8% from 2018 to 2021.
Base Projections shown correspond to the revenues and expenses only of those entities included in the Fiscal Plan presented herein. See the "Fiscal Plan Projections" for greater details on entities included in the Plan.
The impact of economic growth vs a zero scenario was sized similar to how previous offers were sized, where the return to zero real growth was assumed to take until the second year from the start of the projections. To the extent a comparison to
zero real growth was used in FY 2018, it would not change the overall financing deficit, but simply increase the revenues before economic contraction which would then be offset by an increase in the economic contraction amount.
Note that for illustrative purposes, debt service excludes loans from GDB and certain bonded indebtedness of Commonwealth entities held by GDB. Numbers also include past due amounts and are net of debt service reserves.
39
Fiscal Plan Base Projection Beyond FY 2017: FY 2022 to FY 2026
Driven in large part by the items outlined previously, from FY 2017 to FY 2026, the $1.4 billion
surplus before measures, past due AUC/AAC amounts and debt service declines to a shortfall
of $4.4 billion per year
Note that the projections are shown before and after the estimated impact of economic contraction
The cumulative 10-year impact of economic contraction of $5.5 billion is based on a decline in real GDP growth from
0% real GDP growth per year to negative 1.7%; for comparison purposes, inflation is held constant at a CAGR of 1.8%(1)
The size of the financing gap detailed below assumes no measures are taken to fill the gap; if the Commonwealth were
forced to only pursue austerity-type measures to address this shortfall, it is estimated real GDP contraction would
intensify
Summary of Cumulative “Financing Gap” Under Current Laws and Policies from FY 2022 to FY 2026 ($ millions)(2)
T otal
Rev enues pre-Act 1 54 and ACA Funding Losses
Est. Act 1 54 / Foreign Company Tax Losses
ACA Funding Loss
T otal Rev enues
Ex penses ex . Debt Serv . and Items Listed Below
Expiration of Act 66
Healthcare Expenses
Incr. Retirement Sys. Contributions ex. Catch-Up
T otal Ex penses ex . Debt Serv ice
Less: Economic Contraction
Base Fin. Gap pre-Debt Serv ice ex . Catch-Up
Memorandum:
Less: AAC/AUC Catch-Up
Base Fin. Gap pre-Debt Service
Less: Debt Service Net of Existing Reserves (3)
Fiscal Plan Base Financing Gap
(1)
(2)
(3)
2022P
2023P
2024P
2025P
2026P
'22-'26
'17 -'26
$20,31 1
(962)
(1 ,835)
$17 ,515
$20,57 7
(962)
(1 ,954)
$17 ,661
$20,853
(962)
(2,07 0)
$17 ,820
$21 ,1 34
(962)
(2,253)
$17 ,920
$21 ,440
(962)
(2,384)
$18,094
$1 04,31 5
(4,81 0)
(1 0,495)
$89,010
$202,043
(8,1 7 7 )
(1 6,1 41 )
$17 7 ,7 25
(1 7 ,334)
(664)
(1 ,260)
(1 ,1 7 2)
($20,430)
(1 7 ,652)
(7 52)
(1 ,37 8)
(1 ,1 7 2)
($20,954)
(1 7 ,7 44)
(845)
(1 ,463)
(1 ,1 7 2)
($21,224)
(1 6,91 9)
(497 )
(1 ,1 07 )
(1 ,1 7 2)
($19,694)
(1 7 ,086)
(57 9)
(1 ,1 85)
(1 ,1 7 2)
($20,023)
($86,7 35)
(3,337 )
(6,393)
(5,859)
($102,325)
($1 69,586)
(4,525)
(1 0,91 0)
(1 0,588)
($195,608)
(597 )
(7 58)
(920)
(1 ,082)
(1 ,245)
(4,602)
(5,460)
($2,7 7 7 )
($3,120)
($3,530)
($4,116)
($4,37 4)
($17 ,917 )
($23,344)
–
($2,7 7 7 )
(3,1 97 )
($5,97 4)
–
($3,1 20)
(3,1 38)
($6,258)
–
($3,530)
(3,554)
($7 ,084)
–
($4,1 1 6)
(3,055)
($7 ,1 7 1 )
–
($4,37 4)
(3,308)
($7 ,682)
–
($1 7 ,91 7 )
(1 6,252)
($34,1 68)
(405)
($23,7 48)
(34,967 )
($58,7 1 6)
Inflation is projected to run at a CAGR of 1.8% from 2018 to 2021.
Base Projections shown correspond to the revenues and expenses only of those entities included in the Fiscal Plan presented herein. See the "Fiscal Plan Projections" for greater details on entities included in the Plan.
Note that for illustrative purposes, debt service excludes loans from GDB and certain bonded indebtedness of Commonwealth entities held by GDB. Numbers also include past due amounts and are net of debt service reserves.
40
General Fund Revenues
(“GF Revenues”)
41
General Fund Revenue
Overview
General Fund revenues are estimated and collected by Puerto Rico Department of Treasury (“Treasury”)
The sources of revenue primarily include income, excise and sales & use taxes which are estimated to be $9.045 billion for FY 2017
Over 80% of the General Fund revenue is derived from 5 sources: individual and corporate income taxes, non-resident withholdings,
sales and use tax (“SUT”) and Act 154 as depicted below
The General Fund revenues below are presented on a budgetary basis and do not include federal grants and contracts, the portion of
taxes assigned to certain component units and private institutions, or revenues of agencies with independent treasuries.
General Fund Revenue ($ millions)
Total
Individual Income Taxes
Corporate Income Taxes
Non-Resident Withholdings
SUT
Act 154 / Foreign Company Tax Revenues
Alcoholic Beverages
Cigarettes
Motor Vehicles
Excises on Off-Shore Shipment Rum
Others
General Fund Revenue
2017P
2018P
2019P
2020P
2021P
2022P
2023P
2024P
2025P
2026P
$1,966
1,525
763
1,608
1,924
272
117
293
206
371
$1,972
1,565
763
1,586
1,924
273
117
294
168
382
$1,973
1,565
763
1,557
1,924
273
117
294
170
382
$1,972
1,565
763
1,525
1,924
273
117
294
171
382
$1,971
1,564
763
1,491
1,924
273
117
294
172
382
$1,970
1,563
763
1,456
1,924
273
117
294
174
382
$1,970
1,563
763
1,420
1,924
273
117
294
175
382
$1,970
1,563
763
1,384
1,924
273
117
294
176
382
$1,972
1,565
763
1,348
1,924
273
117
294
178
382
$9,045
$9,045
$9,018
$8,986
$8,951
$8,916
$8,880
$8,846
$8,815
5 Yr
10 Yr
$1,975
1,568
763
1,310
1,924
273
118
294
179
383
$9,854
7,784
3,815
7,767
9,620
1,363
586
1,469
887
1,900
$19,711
15,606
7,630
14,685
19,240
2,727
1,173
2,938
1,769
3,810
$8,787
$45,045
$89,288
42
General Fund Revenue
Bridge from Actual FY 2016 to FY 2017 Budget
The Office of Economic and Financial Affairs within Treasury is the
unit responsible for preparing revenue projections
FY 2017 revenue was projected based on actual revenue for FY 2016
using various approaches, including econometric techniques,
elasticity analysis, trend analysis, micro simulation models, and
consideration is given to the behavior of the tax base and changes in
tax law
A bridge from FY 2016 to FY 2017 is shown below
Treasury views as non-recurring for FY 2017, including tax
amnesty ($28 million), non-resident withholding ($46 million) and
corporate income taxes ($42 million)
•
Credits – reductions in revenue for FY 2016 from prior years that
are expected to be collected again in FY 2017 primarily related to
motor vehicles and Act 154
•
Run-rate adjustments – higher revenue from Act 154, cigarettes,
and permits fees and penalties partially offset by lower lottery
revenue
•
SUT – adjusted to include a full-year impact for SUT and B2B less
incremental amount of SUT allocated to COFINA
•
Non-recurring – includes revenue collected in FY 2016 that
•
Transfer pricing – Treasury estimates that $35 million related to a
transfer pricing tax was paid during FY 2016. Since the law was
deemed invalid by the court(1) this revenue is not included in FY
2017, and the projection assumes a credit of $35 million in
payments from FY 2016
•
Economic adjustment – the Puerto Rico Planning Board provides
estimates on GDP to Treasury for use in its revenue projections, the
impact during FY 2017 is estimated at $75 million lower than FY
2016
Further adjustments reducing revenue by $38 million were made for
FY 2018 to account for: increase in SUT allocation to COFINA ($29
million), reduction in rum cover-over from $13.25 to $10.50 ($39
million), property taxes ($5 million), partially offset by $35 million of
corporate income tax for non-recurring credits paid in FY 2017
Bridge from FY 2016 Actuals to FY 2017 Estimate ($ millions)
$14
$63
$9,175
Run-Rate
Adjustments
Credits
Impact
FY '16
(Non-Recur.
in FY '17)
Fiscal
2015-16
Prelim.
Actuals
$48
Increase of
SUT/B2B,
Net of COFINA
$5
Other
Variances
$309
$309
(1)
($116)
($70)
Non-Recurring
Revenues
(Tax Amnesty,
Royalties and
Corporate
Income Taxes)
($75)
Credits for
Transfer Pricing
Collected
in FY '16
(e.g. Wal-Mart)
$9,045
FY '17
Economic
Adjustment
(Planning Board)
Fiscal
2016-17
Projected
Wal-Mart Puerto Rico, Inc. v. Juan C. Zaragoza-Gomez, Case No. 3:15-CV-03018, declared this tax invalid.
43
General Fund Revenue
Presentation in the Fiscal Plan
General Fund revenue is presented on a budgetary basis in the Fiscal
Plan and consists primarily of income, excise and sales & use taxes.
The General Fund revenues do not include:
•
•
Federal grants and contracts, revenue assigned to certain
component units and/or private institutions
Motor vehicle license fees and fines; excise tax on gasoline, gas,
oil, diesel oil, and petroleum; portion of cigarette taxes;
compulsory vehicle insurance premiums; portion of non-resident
withholding income tax; portion of horse racing excise tax;
portion of sales and use tax allocated to COFINA; other charges
for services or revenues which are assigned by law for a specific
purpose, and revenues of agencies with independent treasuries
Income tax refunds are net of individual and corporate income taxes
SUT is presented net of COFINA, FAM and Cine
Presentation of SUT from the Fiscal and Economic Growth Plan
dated January 18, 2016(“Previous FEGP”) to Fiscal Plan
•
The Previous FEGP presented SUT in two areas – the general
fund revenue included only the previous 6% SUT collections and
the incremental increase of 4.5%, B2B and VAT were presented as
a measure.
•
SUT is included entirely within the general fund revenue for the
Fiscal Plan
(1)
Transition to Modified Source Income Rule
The Commonwealth is currently highly dependent on receipts from
the Act 154 excise tax (approximately 21% of General Fund
revenues), which is due to be replaced by a “Modified Source
Income Rule” tax in December 2017 (FY 2018)
Act 154’s transition in FY2018 to a tax based on the Modified Source
Income Rule is estimated to result in a loss of half of estimated tax
revenues(1). The Commonwealth proposes to temporarily extend Act
154 excise tax (2-3 years) to give the government sufficient time to
renegotiate individual tax grants and reform its tax code (assumes
no adverse decisions by the IRS during this interim period)
There is a measure which adds back the entire reduction that
assumes these companies transition to a new tax regime and pay a
similar amount through other income taxes.
Estimate developed based on discussions with PRIDCO.
44
General Fund Budget
(“GF Budget”)
45
General Fund Budget
Overview
The Office of Management and Budget, as part of the Commonwealth’s Fiscal Plan, developed a baseline budget through FY 2026
The Fiscal Plan General Fund projections has two components that, together, make up the projection: (1) baseline projections and
(2) baseline adjustments overlay
1.
Baseline Projection Methodology
•
Developed a normalized 2017 budget removing non-recurring expenditures that serves as a baseline or normalized expenditure
base to project FY’s 2018 – 2026
•
Adjusted FY 2017 approved budget for non-recurring or other normalizing adjustments: one-time GDB deposit funding (overlay
includes amounts for GDB debt service that can be used to free trapped funds in future years), one-time capital improvements,
non-recurring litigation settlement payments, restructuring costs, and others
•
Projected the normalized expenditures based on growth rates, legal requirements, and other inputs
2.
Baseline Adjustments Overlay
•
Non-recurring or extraordinary expenses were added to the normalized expenditure base as noted below:
GDB debt service payments, Special Education Fund costs, Non-General Fund payroll (related to Department of Education
special education services), accounting and financial system upgrades, restructuring advisor costs, restructuring-related
litigation and Non-General Fund litigation settlement payments, election-year related expenses; and Employment Incentive
Fund costs.
46
General Fund Budget
General Fund Budget Projections ($ millions)
Approved
2017
Formula Appropriations
Normal.
Adjs.
Adj.
Total
2017
2018P
2019P
2020P
2021P
2022P
2023P
2024P
2025P
2026P
5 Yr
10 Yr
$7,983
$16,064
$1,518
–
$1,518
$1,616
$1,616
$1,616
$1,616
$1,616
$1,616
$1,616
$1,616
$1,616
Pension Contributions
783
–
783
1,043
1,698
1,755
1,812
1,821
1,821
1,821
1,821
1,821
7,091
16,194
ASES Health Card & PBA Ops. Sub.
975
–
975
975
975
975
975
975
975
975
975
975
4,875
9,750
Municipal Subsidies
64
–
64
64
64
64
64
64
64
64
64
64
322
644
Legal Responsibility Fund
117
(49)
68
68
68
68
68
68
68
68
68
68
389
729
15
–
15
56
56
56
56
56
56
56
56
56
238
518
154
–
154
225
245
253
266
265
262
266
279
287
1,143
2,502
ASEM Retirement System Paydown
10
–
10
10
10
10
10
10
10
–
–
–
50
70
Police Social Security
25
–
25
36
36
37
38
38
39
40
40
41
172
370
Special Education Fund
Utilities (PREPA & PRASA)
TRANS & Other Debt
32
32
32
32
32
32
32
32
32
32
159
317
Payroll-Related Expenses
3,344
(4)
3,340
3,403
3,466
3,528
3,591
3,654
3,719
3,786
3,855
3,928
17,332
36,274
Other Operational Expenses
1,729
(314)
1,415
1,442
1,469
1,495
1,521
1,548
1,576
1,604
1,633
1,664
7,656
15,681
$8,767
($367)
Total Baseline Ex. Reserves
32
–
$8,400
$8,970
$9,735
$9,888
$10,048
$10,147
$10,237
$10,327
$10,440
$10,552
$47,409
$99,113
GDB Debt Agreement
–
$189
$189
$189
$189
$189
$189
$189
$189
$189
$756
$1,701
Employment Incentive Fund
–
13
13
13
13
13
13
13
13
13
51
116
Accounting & Financial System Costs
–
26
10
7
8
8
8
8
35
3
51
112
Special Education Fund - Non-GF Payroll
–
32
33
33
34
34
35
36
36
37
132
310
Restructuring-Related Litigation
–
30
30
–
–
–
–
–
–
–
60
60
Additional Litigation Costs
–
57
57
57
57
57
57
57
57
57
228
513
Profession & Consultancy Costs
–
33
25
1
1
1
–
–
–
–
60
61
Election-Year Expenses:
Election-Related Expenses
89
–
–
–
–
43
–
–
–
46
–
43
Liquidation of Trusted Employees
–
–
–
–
13
–
–
–
14
–
13
27
Election-Related Expenses Funded with External Resources in '17
–
–
–
–
–
27
83
–
–
–
–
–
–
29
89
–
–
27
83
56
172
Subtotal - Election-Year Expenses
–
–
–
–
–
Total Overlay Adjustment
–
–
–
$380
$357
$300
$384
$302
$302
$302
$418
$299
$1,421
$3,044
$99,113
Summary
Baseline Expenditures Ex. Reserves
Overlay Adjustments
Total Expenses Ex. Reserves
Budget & Emergency Fund Reserve
Total Expenses Incl. Reserves
$8,767
$8,400
$8,970
$9,735
$9,888
$10,048
$10,147
$10,237
$10,327
$10,440
$10,552
$47,409
–
($367)
–
–
380
357
300
384
302
302
302
418
299
1,421
3,044
$8,767
($367)
$8,400
$9,350
$10,092
$10,188
$10,432
$10,449
$10,539
$10,630
$10,858
$10,851
$48,830
$102,157
220
–
220
181
180
180
156
89
64
–
–
–
917
1,070
$8,987
($367)
$8,620
$9,531
$10,272
$10,368
$10,588
$10,538
$10,603
$10,630
$10,858
$10,851
$49,747
$103,227
$8,767
$9,350
$10,092
$10,188
$10,432
$10,449
$10,539
$10,630
$10,858
$10,851
$48,830
$102,157
General Fund Expenditures Ex Reserves
( – ) GDB/TRANs Debt Service
(189)
(213)
(213)
(213)
(213)
(213)
(213)
(213)
(213)
(213)
(1,041)
(2,106)
( – ) Additional Debt supported by appropriations - UPR/ERS
(209)
(209)
(209)
(209)
(259)
(276)
(282)
(216)
(218)
(212)
(1,095)
(2,300)
( – ) ERS Base Central Govt. & Munis Subsidy AUC Payable by GF
(100)
(30)
(630)
(630)
(630)
(630)
(630)
(630)
(630)
(630)
(2,020)
(5,170)
( – ) TRS Judiciary Base & Additional AUC
(166)
(443)
(443)
(443)
(443)
(443)
(443)
(443)
(443)
(443)
(1,937)
(4,149)
FEGP Adjusted General Fund Budget
$8,102
$8,456
$8,597
$8,694
$8,888
$8,887
$8,971
$9,128
$9,355
$9,354
$42,737
$88,432
47
General Fund Budget
Key Assumptions - Baseline
Key Assumptions – Baseline Overlay
Formula Appropriations - Projected based on General Fund
revenues and relevant legislation
GDB Debt Agreement - Based on Government Development
Bank/Central Gov't debt agreement
Pension Contributions - Based on Fiscal Plan retirement system
forecast
Employment Incentive Fund - Based on analysis from OMB
Accounting & Financial System Costs - Per Department of
Treasury/Microsoft forecast
Special Education Fund - Non-GF Payroll - Represents General
Fund absorption of payroll for the Department of Education special
education fund services historically funded non-GF funds; Amount
per non-GF funds analysis
ASES Health Card/PBA Operating Subsidy - Held flat throughout
forecast; See Independently Forecasted Component Units
Muni. Subsidies - Remains constant at 2017 approved budget
amount
Legal Responsibility Fund - Same as ‘17 after adjusting for nonrecurring milk litigation, additional costs included in overlay
Restructuring-Related Litigation - $30 million per year in FY 2018
and FY 2019 per OMB analysis
Sp. Education Fund - Based on Dept. of Education/OMB, $56mm
flat through forecast period
Utilities (Water/Power) - Based on projections from PRASA &
PREPA
Additional Litigation Costs - Based on OMB analysis to cover
litigation historically covered by non-GF funds (e.g., Health Centers
330, etc.)
Profession & Consultancy Costs - Based on FY ‘17 approved budget
amount in AAFAF operating expenses ($33 million); Phased out
same as PROMESA bill
ASEM Retirement System Paydown - Projected at $10 million per
year until payable is reduced to zero
Police Social Security - 18' adjusted for actual costs per input from
OMB; grown with payroll 19-26‘ (1)
Election-Related Expenses – Based on amounts in the FY ’17 budget
adjusted for inflation
TRANS and Other Debt - Includes USACE ($8 million), US Navy
($.5 million), and TRANs interest ($24 million)
Liquidation of Trusted Employees - Based on amounts in the FY ‘17
budget adjusted for inflation
Payroll-Related – Grown with inflation
Other Expenses - Grown with inflation
Election Expenses Funded with External Resources in '17 - Based on
OMB analysis; Represents General Fund absorption of electionrelated expenses historically funded by non-GF funds
(1)
Assumes referendum approving the participation in social security benefits is approved by the uniformed police officers.
48
General Fund Budget
Below is a description of adjustments made to remove non-recurring/extraordinary from the
FY 2017 approved budget to produce a normalized expenditure base to project FY’s 2018 –
2026
Adjustments to 2017 Approved Budget
Description
Fiscal Plan Line Item
Description of Adjustment
GDB Deposit Funding
GDB Appropriations
Removed from baseline; GDB debt service
added back in overlay
Health, Safety & Social Welfare
Capex
Appropriations managed by OMB
Milk Litigation
Payroll
Legal Fund
Other
Total
(4)
–
(161)
(165)
Non-recurring expenditure
–
–
(15)
(15)
Legal Responsibility Fund
Non-recurring expenditure
–
(39)
–
(39)
Restructuring-Related Litigation
Legal Responsibility Fund
Extraordinary expense; relevant amount added
back in overlay
–
(10)
–
(10)
Accounting & Financial System
Accounting and Financial System
Extraordinary expense; relevant amount added
back in overlay
–
–
(12)
(12)
AAF Consultancy Costs
Fiscal Agency Operating Expenses
Extraordinary expense; relevant amount added
back in overlay
–
–
(33)
(33)
GDB LOCs - Comp. Cancer Center
Expenses Formerly Funded by GDB
LOCs
Non-recurring expenditure
–
–
(40)
(40)
Election Expenses
Election Exp. (Inc. Liq. of Trusted
EE's)
Extraordinary expense; relevant amount added
back in overlay
–
–
(52)
(52)
(4)
(49)
(314)
(367)
Total Normalization Adjustments
49
GF Budget – Variance to Previous FEGP (Ex. AUC, PBA, ASES, Debt Service)
Variance from FY 2017 to FY 2025 (9-year variance) is equal to favorable $409 million (an decrease in the deficit). The total 10year variance of unfavorable $979 million driven largely by the variance between FY 2016 and FY 2026
($917)
($397)
($421)
($439)
$70,712
B
C
($102)
$943
$838
F
($185)
D
($253)
G
E
$423
$465
H
A
$454
I
J
$70,303
K
Prior FEGP,
Adjusted (1)
(2017 - 2025)
Appropriations
Managed
by OMB
Legal
Responsibility
Fund
Operational
Subsidies
Utilities
Expenses Not
Considered in
Prior FEGP
Legislature
Other
Increases
Pension
Contributions
(Ex. AUC)
Joint
Resolution
Payroll
Municipalities
Formula
Approp.
Changes in
Economic
Growth
Assumptions
Prelim. Updated
FEGP, Adjusted
(2017 - 2025)
Changes in General Fund Budget from 2017 - 2025
A.
A
B.
B
Primarily related to addition of recurring expenditures for uniformed police social
security contribution (~$35 million/yr.), federal matching funds (~$12
million/yr.) and in 2017 a non-recurring infrastructure projects related to issues
involving health, public safety and welfare ($15 million)
Addition of historically non-general fund legal costs ($57 million/yr.),
restructuring-related litigation in 2018 and 2019 ($30 million/yr.), removal of
non-recurring milk-related litigation costs post-2017 and other variances
C.
C
Primarily related to addition of expenditures for reduction of ASEM retirement
system payables from 2017-23 ($10 million), additional recurring 2017
appropriation for ASEM ($15 million) and additional recurring appropriation to
the Comprehensive Cancer Center ($8 million) and other variances
D
D.
Primarily related to elimination of utility reserve from 2016 ($105 million) and
unfavorable PREPA estimates ($304 million)
E.
E
Election expenses incl. liquidation of trusted employees ($226 million), funding
for costs historically covered by GDB LOCs ($178 million), fiscal agency opex and
restructuring professional costs ($159 million), funding for the accounting and
(1)
(2)
(3)
financial system ($121 million), special education fund (primarily non-general
fund payroll costs) ($232 million) not included in previous FEGP
F.
F
Primarily due to additional annual appropriation for public/private non-profit for
activities or provide services that lead to the development of programs for the
welfare ($21 million/yr.)
G.
G
See retirement system projections
H.
H
Payroll run-rates & changes in estimation of Act No. 66-2014 CBA impact in 2018
I.
I
Removed half of annual expense ($12 million/yr.) for muni. x-mas bonus
reimbursement, roll-forward of 2017 approved budget amount for municipal
subsidies ($15 million/yr.), categorical shift of muni. retirement subsidies ($20
million/yr. reduction)
J
J.
Due to unfavorable General Fund revenue estimates
K.
K
Changes due to inflation and growth drivers
Previous FEGP has been adjusted to reflect select attrition and other measures from Previous FEGP for comparison purposes.
Both the Previous FEGP and Prelim. Update FEGP 9-year totals, for comparison purposes, have removed the retirement system AUC contributions, PBA debt and operating subsidies, ASES health
card appropriation, and debt service.
Variances described in A – J represent variances assuming similar inflationary growth as assumed in Previous FEGP.
50
General Fund Budget – Additional Details
Bridge from FY 2016 GF Approved Budget to FY 2017 GF Approved Budget ($ millions)
($1,712)
$10,000
$9,500
$9,000
$260
$9,800
$8,500
$182
($43)
$25
$25
$52
$35
$144
Direct
Payroll &
Operating
Expenses
ASEM
Subsidy
Social
Security
Contribution Uniformed
Police
Election
Year
Related
Expenses
Other
Special
Assign.
Retirement
Contributions
$8,767
$8,000
FY '16 GF
Approved
Budget
Debt
Related
Act-105
Related
Expenses
GDB Deposit
Funding/
Expenses
Formerly
Funded
by GDB LOCs
FY '17 (1)
Approved
Budget (1)
General Fund Budget by Function Spending Category ($ millions)
Approved Budgets
Functional Category
Education
Security
Health
Retirement System
Prosecutor's Office
Entity Deposit Funding
Legislative Assembly
Social Welfare
General Government
Utilities
Infrastructure
Economic Development
Legal Responsibility Fund
Culture and Recreation
TRANs
Labor Affairs
Election Process
Legal
Debt and Other (ex. TRANs, PBA debt)
Totals
FY 2016
2017P (1)
Projected
2018P
2019P
2020P
2021P
2022P
Total
2023P
2024P
2025P
2026P
5 Yr
%
27%
18%
15%
12%
5%
4%
4%
4%
3%
3%
3%
1%
1%
1%
0%
0%
0%
0%
0%
$2,552
1,651
1,382
643
382
–
174
333
281
559
139
108
–
88
46
18
–
15
1,429
$2,552
1,656
1,411
787
452
258
205
342
278
170
242
115
117
81
24
18
40
14
4
$2,614
1,732
1,421
955
451
176
389
349
283
242
271
130
155
82
24
19
40
14
4
$2,646
1,757
1,430
1,311
453
474
393
355
288
262
259
132
155
84
24
19
32
15
4
$2,678
1,782
1,440
1,359
454
482
396
362
292
270
259
134
125
85
24
19
8
15
4
$2,710
1,807
1,450
1,408
456
573
400
368
297
284
262
136
125
86
24
20
8
15
4
$2,742
1,832
1,460
1,413
456
495
404
375
302
283
265
138
125
88
24
20
8
15
4
$2,775
1,858
1,470
1,413
457
496
407
381
307
280
268
140
125
89
24
20
7
16
4
$2,809
1,885
1,481
1,403
457
497
411
388
312
285
271
143
125
91
24
21
7
16
5
$2,844
1,913
1,491
1,403
458
587
415
395
317
298
301
145
125
93
24
21
8
16
5
$2,882
1,942
1,503
1,403
459
499
420
403
322
306
273
147
125
94
24
21
8
16
5
$13,200
8,733
7,152
5,820
2,265
1,963
1,783
1,776
1,439
1,228
1,294
646
677
418
120
94
128
73
21
$9,800
$8,767
$9,350
$10,092
$10,188
$10,432
$10,449
$10,539
$10,630
$10,858
$10,851
$48,830
100%
10 Yr
$27,252
18,164
14,557
12,853
4,553
4,536
3,840
3,718
2,999
2,680
2,673
1,359
1,302
873
240
197
166
152
43
$102,157
%
27%
18%
14%
13%
4%
4%
4%
4%
3%
3%
3%
1%
1%
1%
0%
0%
0%
0%
0%
100%
1) Approved budgets exclude budgetary and emergency reserve appropriations.
51
Puerto Rico Health Insurance Administration
(“ASES”)
52
Puerto Rico Health Insurance Administration
Overview
The Puerto Rico Health Insurance Administration (“ASES”) is responsible for contracting with insurance companies and providing
oversight to the Government Health Plan (“GHP”). ASES does not control:
•
Eligibility – Puerto Rico Department of Health through the Medicaid Office
•
Benefits – regulated by Centers for Medicare and Medicaid Services (“CMS”) and the Affordable Care Act (“ACA”)
•
Pricing – reimbursement rates are negotiated with insurance providers, and CMS is responsible for the federal matching rates
Over 1.5 million beneficiaries are enrolled in the GHP across 9 regions and 5 programs
Under newly established “Modified Adjusted Gross Income,” or “MAGI,” standards, the number of Commonwealth residents who
are Medicaid-qualified could be reduced and, if the Commonwealth were to continue providing these residents with coverage, their
healthcare costs would therefore need to be covered by the Commonwealth without federal reimbursement. The Puerto Rico Health
Department and its Medicaid office are responsible for establishing eligibility standards for the Government health plan and
therefore are responsible for implementing MAGI. PRHIA believes that it is still too early to determine the impact of MAGI
standards
Note that the Fiscal Plan Base Projections assume the depletion of ACA funds by FY 2018
Puerto Rico Health Insurance Administration ($ millions)
Total
Federal Funds Collections
Commonwealth Funds Collections
Administrative Collections
Total Cash Inflows
MCO and TPA Disbursements
Administrative Operating Disbursements
Total Cash Outflows
ASES Deficit Ex. Capex, Debt and
ACA Funding
( + ) ACA Funding
ASES Deficit Ex. Capex, Debt Service
2017P
2018P
2019P
2020P
2021P
2022P
2023P
2024P
2025P
2026P
5 Yr
10 Yr
$1,644
1,238
16
$904
1,239
16
$418
1,260
16
$418
1,239
16
$418
1,239
17
$418
1,239
17
$418
1,239
17
$418
1,239
18
$418
1,239
18
$418
1,239
18
$3,803
6,214
81
$5,892
12,406
169
$2,899
$2,159
$1,694
$1,673
$1,673
$1,673
$1,674
$1,674
$1,674
$1,675
$10,097
$18,468
(2,918)
(19)
(2,927)
(20)
(3,141)
(20)
(3,295)
(20)
(3,456)
(21)
(3,709)
(21)
(3,907)
(22)
(4,098)
(22)
(4,398)
(22)
(4,613)
(23)
(15,736)
(100)
(36,461)
(210)
($2,937)
($2,946)
($3,161)
($3,315)
($3,477)
($3,730)
($3,929)
($4,120)
($4,420)
($4,636)
($15,836)
($36,672)
($39)
($788)
($1,467)
($1,642)
($1,804)
($2,057)
($2,255)
($2,446)
($2,746)
($2,961)
($5,739)
($18,204)
–
865
1,517
1,583
1,681
1,835
1,954
2,070
2,253
2,384
5,646
16,141
($39)
$78
$50
($59)
($123)
($222)
($301)
($376)
($493)
($578)
($93)
($2,063)
53
Puerto Rico Health Insurance Administration
Key Assumptions - Cash Receipts
Federal reimbursement percentages are applied to MCO payments and will
depend on the applicable requirement as determined by CMS, as outlined
below:
•
Newly eligible Medicaid – 55.0% match from the federal government
•
Not-newly eligible Medicaid – 86.8% to 91.6% match from the federal
government
•
Children’s Health Insurance Program (“CHIP”) – 91.5% match from the
federal government
•
Platino – 55.0% match from the federal government
•
Commonwealth – no federal match is provided for these beneficiaries
•
The projections assume the add back of any losses related to ACA funds
depletion assumption policy will replace such funds
Based on the current projections, ACA funds are estimated to be
depleted as soon as December 2017. From its enactment through
2019, ACA provided the Commonwealth with $6.4 billion.1
Key Assumptions - Cash Disbursements
MCO Payments are driven by population and premium, which may vary
significantly during the projected period and material variance may be
expected as a result
•
Population is held constant during the projected period based on
average of the TTM population for FY 2016, except the Platino
enrollment, which increases by 1% annually
•
Insurance premiums are projected to escalated by a range of 5% to 7.5%
per year during the projected period
•
Platino program cost increases from $10 PMPM in FY 2017 to $15
PMPM in FY 2019 and finally to $20 in FY 2023. This assumes that dual
population will not shift from Platino to the Medicaid Population and
that as a result of prior decreases in the Medicare Advantage
reimbursement that the PMPM does not significantly increase
•
Additional costs for long-term care or other services beyond what is
currently provided are not included in these projections
Operating Expenses
•
Municipal contributions remain constant at approximately $140 million
per year, net of bad debt
Payroll expense is projected to remain consistent with historical runrates, but increased for higher retirement contributions and an annual
inflation factor of approximately 1.8%
•
Employee and employer contributions remain constant at $30 million per
year
Administrative expenses are projected using historical data and escalate
by an inflation factor of approximately 1.8% annually
•
Prescription drug rebates are projected at $180 million in FY 2017 through
FY 2026. This assumption does not consider any effect of the new CMS
outpatient Drug Rule
Debt service – payments on debt to GDB have been excluded from the
projection in the Fiscal Plan
Legislative appropriations (“local funds”) remain constant at $885 million
per year
Administrative Federal Funds and Joint Resolution/Stabilization Plan are
projected at $8.7 million and $6.9 million, respectively. These amounts
escalate by approximately 1.8% annually
Working Capital
•
Approximately $187 million of accounts payable related from the TPA
health model is projected to be paid during FY 2017 and FY 2018
Actual results may vary significantly from projections due to differences in the assumptions stated above
and changes in legislation that has not yet been quantified by ASES.
(1)
Source: https://www.medicaid.gov/medicaid-chip-program-information/by-state/puerto-rico.html - Section 2005 of the Affordable Care Act provided $5.4 billion in Medicaid funding to Puerto Rico for the
period of July 1, 2011 through September 30, 2019. Puerto Rico was awarded $925 million for its Medicaid program in lieu of establishing a health marketplace. Puerto Rico must exhaust its Affordable Care
Act (Section 2005) allotment prior to using these funds.
54
Section III C –
Fiscal Plan Principles and Measures
55
To Address the Base Financing Gap and Restore Economic Growth, the Fiscal
Plan Outlines the Following Seven Principles
After a decade of recession, Puerto Rico’s economy must grow for the government to provide essential services
to the 3.5 million Americans living in Puerto Rico, as well as to support a sustainable debt burden. Without
economic growth, any level of debt service will be unsustainable and Puerto Rico will continue to face fiscal and
economic crises
The past decade’s material austerity measures, ranging from layoffs to tax increases, have not abated the
Commonwealth’s fiscal and economic crisis. Further austerity will only exacerbate outmigration and
accelerate the Commonwealth’s economic decline
Minimize Impact
of Austerity on
The Commonwealth’s Fiscal Plan ensures that critical fiscal discipline does not come at the expense of
Economic
long-term economic growth
1
Growth
2
Improve
Budgetary
Controls and
Financial
Transparency
Puerto Rico has experienced persistent deficits, routinely overestimating revenue and failing to control
spending
New rules and regulations must be implemented to enforce budgetary discipline, including improving
recently instituted third-party revenue validation, budgeting in compliance with GAAP, mandating all
spending to be approved through the annual budgetary process and improving regular budgetary
reporting and tracking
The Commonwealth’s ability to properly monitor its fiscal position is hindered by obsolete financial,
accounting and payroll systems. This, in turn, impedes informed decision-making and the ability to
publish timely financial statements
To correct this, Puerto Rico must invest in new IT infrastructure, reform financial reporting processes
and centralize treasury functions
Finally, Puerto Rico must improve its regular economic and statistical reporting to enhance long-term
economic forecasting and tracking. Multi-year budgeting that reflects long-term economic forecasts
should be required
56
To Address the Base Financing Gap and Restore Economic Growth, the Fiscal
Plan Outlines the Following Seven Principles (cont’d)
3
Rationalize
Expenditures
and Tax Policy
to Promote
Efficiency
While further austerity is not the solution, the Commonwealth must stabilize its revenue base, improve its
revenue collections, and rationalize expenditures. The selection and structure of any fiscal measures, and the
timing of their implementation, must be designed to foster long-term growth and minimize negative
economic effects
The Fiscal Plan should focus on efficiency gains by prioritizing tax enforcement, consolidating agencies with
overlapping functions and underutilized schools, further centralizing procurement to create economies of
scale, reducing workforce through retirement and attrition, and eliminating automatic expenditure increases
where there is no demonstrated need. Savings due to such efficiency gains should be reinvested to promote
growth
The Fiscal Plan should also reform tax policy, including to transition the taxation of multinationals away
from the Act 154 excise tax in a manner that minimizes the impact on the Commonwealth’s revenue base
4
Enact
Structural
Economic
Measures and
Invest in
Growth
5
Protect
Vulnerable
Stakeholders
Although Puerto Rico does not control U.S. federal policies that have a significant impact on its economy, the
Fiscal Plan must implement structural reforms within Puerto Rico’s control. Overhauls are needed to local
policies to boost labor participation and productivity and create a business-friendly environment and attract
private investment
The Plan includes investment to maintain existing infrastructure and invest in strategic growth-promoting
projects. Public-private partnerships must be leveraged to achieve efficiency gains
The government must also catch-up on past-due payments to businesses and taxpayers, and build minimum
liquidity reserves to ensure government stability, another necessary predicate to growth
Shocks to Puerto Rico’s most vulnerable constituencies, including the elderly, young, disabled and lowincome residents, are likely to have a higher negative multiplier effect on the island’s already weak economy
Nearly half the island’s population lives in poverty and relies on a public healthcare system overburdened by
inequitable treatment under U.S. healthcare laws. Cuts to the system, even in the face of reductions in federal
transfers, would leave Puerto Rico residents without access to healthcare and promote outmigration and
further economic decline.
The underperformance of local schools, together with crime rates that remain higher than the U.S. states,
suggest investments in education and public safety must also be protected
Public pension plans must be adequately funded. The plans must build on prior reforms and ensure the
payment of an already meager average benefit that is only 53 percent of the average U.S. state
The Fiscal Plan must also protect credit union depositors, who are generally low-income, as well as the
cooperative banking system in general, subject to recapitalization plans and effective governance reforms
57
To Address the Base Financing Gap and Restore Economic Growth, the Fiscal
Plan Outlines the Following Seven Principles (cont’d)
Without a substantial debt restructuring resulting in a sustainable debt burden, Puerto Rico’s growth potential
will continue to be hindered by the fear of future defaults, lower public and private investment and further
outmigration
6
Create a
Sustainable
Debt Level
That Allows
for Growth
The sustainability of the debt burden must rely on objective criteria and realistic growth and fiscal
assumptions. The Fiscal Plan must provide the island with sufficient breathing space to guarantee the provision
of essential services, to implement smart, pro-growth fiscal and economic policies and to invest in its economy
The restructuring plan must also offer a holistic solution for the Commonwealth’s tax-supported debt burden,
which is reliant on the single Commonwealth economy. Individual restructurings would be extremely
challenging given the interrelatedness of holders, insurers and sources of credit support. Accordingly, the Fiscal
Plan includes the tax-supported central government agencies and component units, including those identified
by the Oversight Board for inclusion in the Fiscal Plan(1)
Finally, the debt proposal must include restrictions on the issuance of new indebtedness, including limitations
on the aggregate amount of tax supported debt, and must account for the impact on local holders
Even after Puerto Rico implements the measures within its control, fiscal and economic recovery will be
immeasurably more difficult if the U.S. government does not act affirmatively to address some of Puerto Rico’s
most conspicuous fiscal and economic inequities
7
Partner with
the Federal
Government
to Generate
Growth
The Commonwealth suffers from inequitable healthcare treatment relative to the U.S. states. Its Medicaid
reimbursement is capped
Affordable Care Act funds that helped alleviate this inequity are expected to be depleted in FY 2018. Thereafter,
only local funds will be available to cover shortfalls for Puerto Rico’s struggling healthcare system. If not
addressed by the U.S. government, this deficiency in funding would devastate the Commonwealth's fiscal
accounts and social safety net
The economic damage left by the repeal of Section 936 demonstrates the need for pro-growth federal policies
that are tailored to increase private-sector employment and investment, such as funding a Puerto Rico Earned
Income Tax Credit (“EITC”) and permanent, cost-effective tax incentives for business investment
(1)
See the list of entities specified by the Oversight Board for the first Fiscal Plan submission included in the document issued by the Board entitled “Covered Entities Under the PROMESA Act.”
58
Scope and Process for Developing Fiscal Plan Measures
The measures outlined on the following pages were developed to be consistent with the
principles outlined previously and target improving the Commonwealth’s fiscal position while
avoiding the drag on growth experienced following recent austerity type measures
The Fiscal Plan’s measures result mainly from the work performed in relation to the Commonwealth’s Fiscal and
Economic Growth Plan last published in January 2016 and focus on the following main areas:
• Improve Budgetary Controls and Financial Transparency
• Rationalize Expenditures and Tax Policy to Promote Efficiency
• Enact Structural Economic Measures and Invest in Growth
The measures draw on numerous other consultant reports and meetings with key Commonwealth officers and
officials
Additional details on the measures are provided on the following pages
• Notably, certain measures included in the previous FEGP, in particular the cut to the UPR subsidy that was
expected to generate $200 million of savings, was not included in the Fiscal Plan
59
Fiscal Plan Measures
Improve Budgetary Controls and Financial Transparency
60
Institute New Budgetary Rules and Practices to Impose Budgetary Discipline
Budgetary
Planning and
Implementation
Require Budgets to be prepared in accordance with “Modified Accrual Accounting Standards” (as defined by GASB)
Implement multi-year budgeting requirement to identify trends and enable long-term planning
Eliminate Commonwealth’s Special Revenue Funds, and account and budget for all revenue and expenditure transactions in the
General Fund (except for Federal Grants)
Improve revenue projections by relying on third-party validation process
Implement quarterly General Fund budgetary revision process based on actual revenues and expenditures in order to make timely
budgetary adjustments
Tax Expenditure
Inventory and
Budget
Require perpetual inventory of tax credits issued and outstanding in order to measure impact on revenue estimates
Require periodic reporting on cost/benefit analysis of tax expenditures
Require Annual Tax Expenditure Budget that prepares annual revenue estimates on a “gross basis”, then adjusts to reflect the impact
of existing and proposed tax exemptions, exclusions and deductions
Require annual budgetary approval of tax credits, like any other budget line item
Institute
Additional
Controls to
ensure
Accountability
Enact regulations so that OMB/Treasury can hold UPR, Legislative Assembly and dependent agencies and public corporations
accountable for their expenditures
Require periodic measurement and reporting of the capture rate of all taxes
Prohibit legislation with fiscal or budgetary impact to be approved during the fiscal year without new sources of revenues
Close all operating funds at the end of each fiscal year
Require Federal Funds reimbursement reconciliation on a monthly basis
Invest in Systems
to Develop and
Report Accurate
Financial Data
Strengthen
Economic and
Statistical
Analysis
Invest in new financial, accounting and payroll systems to streamline internal accounting and reporting processes and sharing of
information in order to provide real-time data and accelerate the preparation and publication of interim and audited financial
statements
Execute agency and public corporation consolidation plan (described in Section 3), which will reduce the number of reporting entities in
the Commonwealth’s financial statements and simplify related audit procedures
Consolidate agencies’ finance divisions, supplier payment processing and management of federal grants in a shared service center
Create Commonwealth Financial Reporting Office in order to properly coordinate the production and dissemination of fiscal and
financial data within the newly created Department of Treasury and Finance
Adopt the Institute of Statistics and the Planning Board’s five-year plan to strengthen the economic statistical system and analysis by
modernizing national accounts with an estimated investment of $3 million per year
Reorganize and expand Puerto Rico’s current five national accounts into seven accounts (Net Income and Gross Product, Personal
Income and Outlays, Government Receipts and Expenditures, Foreign Transactions-Current, Foreign Transactions-Capital, Gross
Savings and Investment and Private Sector Income)
Present national accounting statistics in accordance with the 2008 United Nations standards and publish full sets of quarterly statistics
Develop a new forecasting model for Puerto Rico’s national accounts with technical assistance from the U.S. Bureau of Labor Statistics
and the U.S. Bureau of Economic Analysis
61
Institute New Budgetary Rules and Practices to Impose Budgetary Discipline
Ensure all
Spending Flows
Through a Single
Treasury
Develop
Performance
Metrics
Reorganize Fiscal
and Economic
Decision Making
Structures
Establish by legislation centralized single treasury functions across Commonwealth agencies and dependent public corporations to
enhance visibility, reduce financing costs and improve cash flow management
Single Treasury account should be used for all spending to make sure it is controlled and consistent with the budget
Single Treasury account will also provide visibility into the Commonwealth’s consolidated fiscal position
Complete the development of performance metrics for the principal agencies and departments of the Government: Education, Health,
Police, Justice and Children and Families
Establish an electronic system to publish performance metrics in order to improve execution and enhance transparency
Consolidate the functions of the Treasury Department, OMB and AAFAF into new Department of Treasury and Finance to better manage
and coordinate fiscal and financial policy
Submit and pass legislation to implement new Department of Economic Development and Commerce organizational structure and
business plan
62
Fiscal Plan Measures
Rationalize Expenditures and Tax Policy to Promote Efficiency
63
Reduce Operating Costs
Overview
Despite significant efforts to reduce central government expenses through headcount attrition, freezing of formula-based appropriations, service costs and
collective bargaining agreements, among other measures, the Commonwealth’s upcoming fiscal challenges will require further expense cuts, a gradual
reduction in payroll expenses and the implementation of additional operational efficiencies aimed at consolidating overlapping agencies and benefiting from
economies of scale.
($ millions)
Total
2017P
Reduce Operating Costs
Achieve Operational Efficiencies
Establish Centralized Procurement System
Employee Attrition (incl. Department of Education)
Extend Law 66 / Implement Long-Term Budgetary Reform
Reduce Operating Costs
–
–
–
–
–
2018P
28
60
131
178
397
2019P
36
80
155
257
528
2020P
41
120
225
336
723
2021P
42
120
229
416
807
2022P
43
122
233
400
798
2023P
44
124
237
384
790
2024P
45
127
242
368
781
2025P
45
129
246
353
773
2026P
46
131
251
338
766
5 Yr
10 Yr
148
380
740
1,187
2,455
371
1,013
1,949
3,030
6,364
Key Projects
1. Achieve Operational Efficiencies
Continue implementing the Government Reorganization and Efficiency Plan (EO 2015-23), so as to consolidate local government offices and increase the use
of technology and shared services.
Redesign governmental structures, as proposed by OMB and UPR’s Public Administration Faculty, which will lead to the consolidation of approximately 48
government entities.
Estimated impact based on OMB’s analysis of savings in rent and utilities generated from these consolidations. Beyond FY2021, savings achieved grow at
projected inflation rate.
2. Establish Centralized Procurement System
The project’s focus will be on requiring that all purchases of materials and supplies greater than $25,000 (currently $195,000) be managed by a new, modern,
centralized procurement system in the Puerto Rico General Services Administration. Estimated impact based on achieving ~4% economies of scale of the
$3bn incurred in the purchase of materials and supplies. Beyond FY2021, savings achieved grow at projected inflation rate.
3. Employee Attrition
Reduce payroll costs by 2% until FY2020 through retirement or attrition. Estimated impact of the reduction in payroll costs based on OMB’s analysis of (i)
estimated number of employees eligible to retire under the provisions of Act 211-2015 (8,724) and average net savings per employee of $9,794; (ii) reduction
of 2,976 employees of the Department of Education with average savings per employee of $29,853; and (iii) reduction of 1,136 employees of the central
government with average savings per employee of $44,677.
4. Extend Act 66
Act 66, which froze hiring, salaries, collective bargaining agreements and formula-based appropriations, is due to expire in June 2017. The Fiscal Plan
proposes to extend through FY 2021 Act 66’s provisions. The impact of Act 66 is calculated as the difference of expenses under an Act 66 extension scenario vs
no Act 66 extension figures. After FY 2021 all expenses related to Act 66 extension are projected to increase at inflation rate based on previous year figures,
including formula based appropriations.
64
Right-Size Department of Education
Overview
Since 2005, enrollment at PR public schools has declined 37%, which has led to a reduction in school utilization and a decrease in the student to teacher ratio
to 12:1, as compared to the U.S. average of 16:1.
($ millions)
Total
2017P
2018P
2019P
2020P
2021P
2022P
2023P
2024P
2025P
2026P
–
–
28
57
85
113
115
117
119
121
123
283
14
14
14
14
14
15
15
15
15
56
130
–
42
71
99
127
129
131
134
136
139
339
1,008
5 Yr
10 Yr
Right-Size Department of Education
Execute School Consolidation Plan
Overhaul School-Based Management and Operations
Right-Size Department of Education
878
Key Projects
1. Execute School Consolidation Plan
Given the decline in enrollment and fall in school utilization, the PRDE will continue executing the School Consolidation Plan it has been carrying out over the
last three years (155 schools). Estimated impact based on BCG’s and PRDE’s plan that recommended the consolidation of an additional 425 schools by 2021
with average savings per school consolidated of $265,598. Beyond 2021, savings achieved grow at projected inflation rate.
2. Overhaul School-Based Management and Operations
Implementation of the remaining phase of PRDE’s ongoing restructuring plan, which requires consolidating PRDE’s 7 school regions into 4 Regional Service
Centers. Estimated impact based on BCG’s and PRDE’s projected savings of $14MM per year resulting from organizational restructuring. Beyond 2021,
savings achieved grow at projected inflation rate.
65
Control Health Care Costs
Overview
Puerto Rico’s public health care system is composed of a highly fragmented network of hospitals and a Government Health Plan that covers ~1.6MM
beneficiaries. Increases in health care costs along with expected budget cuts threaten the government’s ability to provide adequate care to Puerto Rico’s
residents.
($ millions)
Total
2017P
2018P
2019P
2020P
2021P
2022P
2023P
2024P
2025P
2026P
5 Yr
10 Yr
Control Healthcare Costs
Implement Functional P3s at State Hospitals
(2)
12
24
24
24
24
25
25
26
26
82
209
Integrate Government Hospitals into Single Organization
(2)
10
19
19
19
19
20
20
20
21
65
165
Implement STAR Ratings System and Scale Payments
–
8
15
15
15
15
16
16
16
16
53
132
Standardize Health Protocols and Impose Uniform Fee Schedules
Reduce Number of 330s as IPAs Under Mi Salud
–
30
30
30
30
31
31
32
32
33
120
278
Control Healthcare Costs
–
5
5
5
5
5
5
5
5
5
20
46
(4)
65
93
93
93
95
96
98
100
102
340
830
Key Projects
1. Implement Functional P3s at State Hospitals
Implement functional P3s at state hospitals to bring best in class practices, centralize functions and streamline processes. Estimated impact based on
benchmarks of P3s at other state hospitals: (i) centralize billing and reimbursement system management ~$10MM; (ii) centralize admissions operations
~$5MM; (iii) centralize laundry, food, security and facilities/building maintenance services ~$3MM; and (iv) achieve leaner operations ~$12MM.
2, Integrate Hospitals into Single Organization
Initiative entails creating the PR Medical Center Campus organized around specialty institutions by integrating all government hospitals into a single
organization. Initial focus would be on merging the operations of ASEM, HOPU and UDH considering all administrative functions. Estimated impact based on
a 5% reduction in ASEM, UDH and HOPU’s combined operating budget of $385MM.
3. Implement STAR-like Ratings System and Scale Payments
ASES is developing a PMG quality monitoring program that would allow the agency to monitor quality, utilization and cost of the Government Health Plan
with the PMGs as the unit of measurement. ASES is proposing an iterative outlier improvement algorithm that targets PMGs with measures outside of an
appropriate spread for the population they serve. This algorithm will begin with the most extreme cases and work itself towards the mean. Estimated impact
based on achieving a 0.5% reduction in the cost of the Government Health Plan (~$2.8bn).
4. Standardize Health Protocols and Impose Uniform Fee Schedules
Create uniform guidelines in order to: (i) standardize the treatment given across physicians and medical facilities for every type of illness and procedures; and
(ii) standardize the medical fee for service charged for each medical procedure included in the guidelines. Estimated impact based on achieving a 1% reduction
in the cost of the Government Health Plan (~$2.8bn).
5. Reduce Number of 330s as IPAs under Mi Salud
Total costs of ~$40MM per year related to health care centers receiving grants from Section 330 of the Federal Pubic Health Service Act could be lowered by:
(i) using actual data as opposed to estimates in the calculation of the wrap-around payment formula and for services rendered by these centers to beneficiaries
of the Government Health Plan; and (ii) rationalizing the number of federally qualified health care centers that are located near existing hospitals or clinics
that are contracted by the Government’s Health Plan. Estimated impact based on the adjustments to the formula used to calculate the wrap-around payments
made to 330s for “Mi Salud” patients.
66
Cut Governmental Subsidies
Overview
The central government’s precarious fiscal situation is exacerbated by sizable subsidies to governmental entities, including municipalities, as well as generous
benefits legislated through special laws
($ millions)
Total
2017P
2018P
2019P
2020P
–
–
–
47
50
100
200
300
300
300
300
300
350
46
45
44
43
42
41
40
39
182
387
–
47
96
145
244
343
342
341
340
339
532
2,237
2021P
2022P
2023P
2024P
2025P
2026P
5 Yr
10 Yr
Cut Governmental Subsidies
Reduce Subsidies to Municipalities
Modify Special Laws Benfits
Cut Governmental Subsidies
1,850
Key Projects
1. Reduce Subsidies to Municipalities
Initiative entails enacting legislation to gradually adjust subsidies provided to the municipalities by the central government, while also empowering the
municipalities with the proper legal, administrative and operational tools to offset such a decrease. Subsidy cuts will occur in a four-year phase out period
($300MM cut by FY2021) so that municipalities can gradually adjust and implement corrective measures. Estimated impact based on Working Group’s
decision with regards to the municipalities’ abilities to generate revenue and reduce expenses. Beyond FY2021, the Fiscal Plan permanently fixes these
appropriations at their FY 2021 levels and only allows them to grow at the rate of the previous FY’s inflation
2. Modify Special Laws Benefits
Modify special laws benefits granted to the PRDE’s employees that retired before 2014, including Christmas bonus, medicine bonus and medical insurance
plan contributions, which are in addition to the benefits related to pensions. Estimated impact based on the actuarial projections of these costs
67
Implement and Enforce Tax Policy
Overview
The Commonwealth lacks an effective tax administration infrastructure, resulting in significant tax evasion and high administrative and compliance costs. In
addition, it is currently highly dependent on receipts from Act 154 excise tax, which is due to be replaced by a “Modified Source Income Rule” tax in December
2017 (FY 2018)
($ millions)
Total
2017P
2018P
2019P
41
25
55
481
602
56
25
70
962
1,113
2020P
2021P
2022P
2023P
65
25
67
25
67
25
67
25
81
962
1,133
77
962
1,131
75
962
1,129
72
962
1,125
2024P
2025P
2026P
5 Yr
10 Yr
67
25
69
962
1,123
67
25
66
962
1,120
67
25
64
962
1,118
239
100
283
3,367
3,989
574
225
629
8,177
9,605
Implement and Enforce Tax Policy
Leverage Tech and Training to Incr. Capture Rates and Improve Tax Admin
Restrict Use of Tax Amnesties and Closings
Implement and Enforce Tax on Video Lottery Games
Address Upcoming Act 154 Revenue Cliff
Implement and Enforce Tax Policy
10
–
–
–
10
Key Projects
1. Improve Integrated Merchant Portal System (PICO)
PICO allows merchants to perform various transactions related to the payment of the SUT. Programming errors in PICO resulted in reporting some declined
SUT payments as collected (errors for August 2015 ~$2MM). Programming improvements to PICO minimized the risk of undetectable declined payments.
Estimated impact represent ~1% of the $2bn in SUT collections
1. Implement new Internal Revenue Integrated System (SURI)
Treasury will be replacing its current 1998 systems with a fully integrated system for the payment and collection of taxes that will supersede PICO system. It
would also facilitate efficiencies in audits, processing of tax returns, payments and collection of taxes, among others. The project is expected to be fully
implemented by FY 2019
3. Implement Automated System for Customs Data (ASYCUDA)
ASYCUDA is a computer system that assists customs authorities to automate core processes and obtain timely and accurate information regarding manifests
and customs declarations, providing for greater oversight of values in merchant’s declarations. Estimated impact is based on an increase of ~0.5% in the
current capture rate of the ~$12bn of taxable imports at a tax rate of 10%
4. Expand alternative delivery and payment channels’ capabilities
Increase the amount of transactions and services available online, through a call center and in banks and credit unions. These initiatives reduce processing
costs, improve quality of information and facilitate the auditing process. Estimated savings based on a reduction of 70% in processing hours
5. Transform Collection Centers into Integrated Service Centers
Treasury plans to transform its 89 collection centers into 27 Integrated Service Centers in 9 service regions throughout the island by FY2020. Estimated
impact based on savings of $100K per collection center closed
6. Joint-ventures for Sales and Use Tax (SUT) oversight
Joint-ventures between the Central Government and municipalities will allow for the timely exchange of SUT compliance information and greater oversight. It
is expected that alliances with municipalities will add over 155 auditors for SUT oversight. Estimated impact for the first year based on an increase of 1% in the
current capture rate on ~$2.3bn of taxable sales for 2 municipalities (Caguas and Guaynabo)
68
Implement and Enforce Tax Policy (cont’d)
Key Projects
7. Office of Tax Return Compliance
Currently, there are 1,650 W-2 forms from individuals with incomes higher than $50K identified that haven’t been reported in individual tax returns. The
estimated tax debt for these individuals, including interests and penalties is approximately $11MM. Treasury assumes that it will be able to collect
approximately one third of the debt
8. Office of Transfer Pricing Policies
Concerns about base erosion through aggressive transfer pricing is best addressed by comprehensive audits of entities that are suspected of engaging in this
activity. Estimated impact assumes that Treasury is able to adjust approximately $650MM in property and service purchases of related entities by 1-2%. This
would result in an additional $13MM subject to PR’s effective 39% tax rate for an additional $5MM in revenues
9. Restrict use of tax amnesties and closing agreements
Ability to collect taxes has been hampered by a long history of generous amnesties and settlement schemes. Act 159-2015 limits the probabilities for tax
avoidance by tightening definitions and parameters for offering closing agreements and prohibiting prepayment requests. It is estimated that revenues from
closing agreements are ~$100MM annually. Assuming a 25% tax rate, the potential tax forgone would be $25MM annually
10. Video Lottery
Tackle the widespread use of illegal video lottery machines that erode Puerto Rico’s tax base by implementing and enforcing tax on, and regulating, video
lottery games. Estimated revenues based on 35% of net wins, net of cannibalization of casino slot revenues, payments to CRIM (Act 10-1989) and
implementation and litigation risk
11. Extend Act 154
Act 154’s transition in FY2018 to a tax based on the Modified Source Income Rule is estimated to result in a loss of half of estimated tax revenues. This
measure is projected to match the estimated loss from not extending Act 154
69
Fiscal Plan Measures
Enact Structural Economic Measures and Invest in Growth
70
Structural Economic Measures
Labor Reform
The Puerto Rico private labor market is subject to federal labor regulations and unique local regulations such as 8-hour work days
based on calendar days (instead of 24-hour periods) and mandatory Christmas bonus and severance payments
For Puerto Rico to increase its competitiveness and labor participation, and cognizant of the fact that Puerto Ricans can move freely to
the mainland, the Commonwealth must review its labor laws in order to pursue two dual objectives:
Preserve its revenue base ; Increase labor participation rates
Establish EITC
Establish an EITC that targets families with children, headed by working age persons, to stimulate employment among low-wage
workers, reduce informal economy activities, bring families into the tax system and offset sales tax regressivity
Invest ~$150 million per year in EITC program
Welfare Reform
Reform Nutritional Assistance Program (“NAP”) Benefits
Apply to US Department of Housing and Urban Development (“HUD”)’s “Moving to Work” program to receive waivers of rules that
govern public housing and federal Section 8 voucher program
Apply to HUD’s “Jobs Plus Pilot Program”
Enact Permit
Reform
Centralize permit application processes in the Office of Management of Permits (“OGPe”), providing a single access point and electronic
permit interface for all agencies and municipalities
Provide for a 7-day agency response period for “Categorical Exclusions” (e.g., minor lot designation variations for low impact
environmental construction works); applications deemed granted if agency has not ruled on permit during said period
Require municipalities to adopt simplified uniform general permitting regulations (“Reglamento Conjunto”)
Adopt a joint general construction permit and expedited application procedure for “low impact” construction projects
Consolidate Environmental Quality Board, Solid Waste Authority and Natural and Environmental Resources Department in order to
simplify and streamline the environmental review process
Implement Pro
Growth
Corporate Tax
Regime(1)
Enact legislation to amend Puerto Rico’s Internal Revenue Code to implement flatter, lower-rate corporate tax regime for both new and
existing companies
Reduce nominal corporate tax rates; Eliminate inefficient corporate deductions and tax credits; eliminate or reduce alternative
minimum tax; Enact legislation, after dialogue with existing multinationals, to retain and attract foreign direct investment
Enact Reform to
Stabilize Energy
Rates
Develop a holistic island-wide energy strategy to reduce and control energy rates to increase Puerto Rico’s competitiveness and decrease
the cost of doing business
Reduce
Transportation
Costs
(1)
Ask U.S. Congress to repeal Jones Act’s application to the Commonwealth in order to reduce maritime transport costs to the island
Review current ground transportation regulatory framework and associated costs
Impact of this measure is not incorporated in the model, as reform is being designed. But it presents another risk on the revenue projections of the Commonwealth.
71
Capital Expenditures
The Fiscal Plan includes spending on capital projects required to catch-up on deferred maintenance on
roads, bridges, buildings and other critical infrastructure
PREPA and PRASA are not included in the Fiscal Plan and incremental capital expenditures at those entities is also
necessary
Additionally, the amounts shown below are only for maintaining the Commonwealth’s current infrastructure and
complying with current regulatory regimes; the totals shown do not include new infrastructure projects aimed at
improving growth, which are discussed elsewhere
The “Base Capital Expenditures” shown below in FY 2017 are based on the OMB budget after deducting estimated
federal funding. FY2018-2026 in the Base Projections are based on a review of recent historical data, while spending on
existing infrastructure in the measures is based on a set of specifically identified projects needed for maintenance and
judgement related capital expenditures. The grey amounts correspond to the incremental total spending required for
the specific projects over the Base Capital Expenditures
Projected Necessary Base Capital Expenditures and Incremental Non-Growth Capital Expenditures, 2017-2026
$1,000
($ millions)
$900
Incremental Non-Growth Capital
Expenditures
$800
Base Capital Expenditures
$700
$528
$397
$600
$273
$500
$400
$300
$104
$106
$108
$110
$112
$141
$200
$100
$103
$400
$407
$415
$422
$429
$437
$445
$453
$462
2018
2019
2020
2021
2022
2023
2024
2025
2026
$283
2017
72
Capital Expenditures (cont’d)
Puerto Rico’s economic growth will be driven by investing in significant infrastructure projects that improve
and facilitate transportation (roads and highways), modernize airport and port facilities and boost strategic
economic development sectors (e.g. life sciences, knowledge services, research, tourism)
($ millions)
Transportation
Ports/Airports
Industrial
Research/
Education
Tourism
Total
Complete large-scale strategic projects to improve accesses and competitiveness
including the Northwest Corridor (PR-22 highway from Hatillo to
Aguadilla), the redevelopment of Roosevelts Roads, and the Caguas
Commuter Rail
1,406
Attract economic development, private investment, and tourism by expanding the Port
of the Americas value added zone, improving the Aguadilla airport, and
expanding the Panamericano docks to attract Quantum-like mega cruise ships
234
To effectively compete in the world stage, strategic investments are needed in
industrial parks and key economic sectors including Aerospace and Defense,
Life Sciences, Knowledge Services, Agriculture and other sectors
408
Establish the UPR as a prominent scientific research center to provide a boost to the
local economy (Molecular Science Complex, Mayaguez Campus, Medical
Science Campus, Other)
289
235
Position Puerto Rico as one of the premiere travel destinations of the world for local,
domestic and foreign travelers by supporting the financing of 9 hotel construction
projects currently on hold
2,57 2
73
Shown Below are the Estimated Impact of Financial Measures Resulting from
Following the Principles Outlined in the Fiscal Plan
As illustrated below, the measures resulting from the principles outlined previously would be
expected, before the benefit of a change in the trajectory of the Commonwealth economy, to
reduce the Base Financing Gap by $10 billion
Annual Summary of Measures ($ millions)
2017 P
Meas. Aimed at Impr. Budg. Controls and Fiscal & Econ. Dec.-Making
Adopt Institute of Statistics / Planning Board Fiv e-Y ear Plan
Install New Accounting and Financial Sy stems
Im prov e Budg. Controls and Fiscal & Econ. Dec.-Making
Meas. Aimed at Rationalizing Ex ps. and Tax Policy to Promote Effic.
Expense Measures
Reduce Operating Costs
Right-Size Department of Education
Control Healthcare Costs
Cut Gov ernmental Subsidies
Total Expense Measures
Revenue Measures
Improv e Tax Enforcement and Administration
Address Upcoming Act 1 54 Rev enue Cliff
Total Revenue Measures
T otal Rationalizing Ex ps. and T ax Policy
Meas. Aimed at Enacting Structural Reform and Growth
Establish a Local EITC Program
Pay Local Businesses for Past Serv ices and Pay Tax Refunds
Build Deposits to Prov ide Confidence
Inv est in Incr. Main. Capex ov er Run-Rate
Inv est in Economic Growth Projects
T otal Enacting Struct. Reform and Growth
Meas. Aimed at Protecting Vuln. Stakeholders
Implement Pension Sy stem Reform (1 )
T otal
10 Y r
2018P
2019P
2020P
($3)
(30)
($3)
–
($3)
–
($3)
–
($3)
–
($3)
–
($3)
–
($3)
–
($3)
–
($3)
–
($1 5)
(30)
($30)
(30)
(33)
(3)
(3)
(3)
(3)
(3)
(3)
(3)
(3)
(3)
(45)
(60)
–
–
(4)
–
(4)
397
42
65
47
551
528
71
93
96
7 88
7 23
99
93
1 45
1 ,059
807
1 27
93
244
1 ,27 1
7 98
1 29
95
343
1 ,365
7 90
1 31
96
342
1 ,359
7 81
1 34
98
341
1 ,354
773
1 36
1 00
340
1 ,349
7 66
1 39
1 02
339
1 ,346
2,455
339
340
532
3,665
6,364
1 ,008
830
2,237
1 0,439
10
–
10
1 21
481
602
1 51
962
1 ,1 1 3
17 1
962
1 ,1 33
1 69
962
1 ,1 31
1 67
962
1 ,1 29
1 63
962
1 ,1 25
1 61
962
1 ,1 23
1 58
962
1 ,1 20
1 56
962
1 ,1 1 8
622
3,367
3,989
1 ,428
8,1 7 7
9,605
1,153
1,901
2,192
2,403
2,494
2,485
2,47 0
2,464
7 ,655
20,044
6
2021P
2022P
2023P
2024P
2,47 7
2025P
2026P
5 Yr
–
(565)
(21 4)
(1 41 )
(54)
(1 50)
(27 2)
(21 4)
(528)
(400)
(1 50)
(27 2)
(21 4)
(397 )
(466)
(1 50)
(27 2)
(21 4)
(27 3)
(47 6)
(1 50)
(27 2)
(21 4)
(1 03)
(353)
(1 50)
–
–
(1 04)
(31 6)
(1 50)
–
–
(1 06)
(1 87 )
(1 50)
–
–
(1 08)
(1 1 3)
(1 50)
–
–
(1 1 0)
(1 03)
(1 50)
–
–
(1 1 2)
(1 03)
(600)
(1 ,653)
(1 ,069)
(1 ,442)
(1 ,7 49)
(1 ,350)
(1 ,653)
(1 ,069)
(1 ,983)
(2,57 2)
(97 4)
(1,564)
(1,499)
(1,385)
(1,091)
(57 0)
(443)
(37 1)
(363)
(366)
(6,514)
(8,627 )
(1 66)
(1 66)
(1 1 6)
(1 1 6)
(1 1 6)
(1 1 6)
(1 1 6)
(1 1 6)
(1 1 6)
(1 1 6)
(681 )
(1 ,263)
(166)
(166)
(116)
(116)
(116)
(116)
(116)
(116)
(116)
(116)
(681)
(1,263)
T otal Measures Im pact
($1,167 )
($581)
$283
$687
$1,193
$1,804
$1,922
$1,987
$1,987
$1,97 9
$415
$10,094
Memo: Estimated Impact on Economic Growth
Change in Economic Trajectory
Total Measures incl. Change in Economic Trajectory
–
($1 ,1 67 )
202
($37 8)
340
$623
501
$1 ,1 88
718
$1 ,91 0
939
$2,7 43
1 ,1 85
$3,1 08
1 ,427
$3,41 4
1 ,61 2
$3,599
1 ,7 82
$3,7 61
1 ,7 61
$2,1 7 6
8,7 07
$1 8,801
T otal Protecting Vulnerable Stakeholders
Memo: Macroeconomic Assumptions
Real Revenue Growth
Inflation
(1)
N/A
N/A
0.6%
2.1%
(0.3%)
2.0%
(0.1%)
1.9%
0.2%
1.9%
0.2%
1.9%
0.4%
2.0%
0.3%
2.1%
(0.0%)
2.0%
(0.2%)
1.9%
Illustratively includes the reduction in the estimated portion of AUC as result of the exclusion of debt service, which amounts to approximately $80 million over the 10-year projection period.
74
As Shown Below, the Fiscal Plan Targets an Efficient Allocation of Spending as
Opposed to Austerity
The Fiscal Plan is not intended to be an austerity plan, but rather largely redirects spending
from inefficient uses towards uses more likely to produce economic growth
As illustrated below, excluding (1) certain measures aimed at maintaining current revenues and spending (such
as reforms to the corporate tax code to replace Act 154 revenues and an extension of Act 66) and (2) the build in
deposits, the Commonwealth’s revenue reforms and expenditure cuts largely fund the incremental spending the
Commonwealth projects to stimulate growth in the economy
The spending is highest in the early years so as to jumpstart growth and stop outmigration as the Commonwealth
implements structural reforms
Annual Summary of Incremental Savings / (Spend) from Measures ($ millions)
T otal
T otal Measures Im pact
Less: Measures Aimed at Maintaining Current Rev s./Ex ps.
Address Upcoming Act 1 54 Rev enue Cliff
Ex tend Law 66 / Implement Long-Term Budg. Reform
Measures Aimed at Maintaining Current Rev s./Ex ps.
Plus: Deposit Build
T otal Increm ental Sav ings / (Spend) from Measures
2017P
2018P
2019P
2020P
2021P
2022P
($1,167 )
($581)
$283
$687
$1,193
$1,804
$1,922
$1,987
$1,987
$1,97 9
$415
–
–
–
(481 )
(1 7 8)
($659)
(962)
(257 )
($1 ,21 9)
(962)
(336)
($1 ,298)
(962)
(41 6)
($1 ,37 8)
(962)
(400)
($1 ,362)
(962)
(384)
($1 ,346)
(962)
(368)
($1 ,330)
(962)
(353)
($1 ,31 5)
(962)
(338)
($1 ,300)
(3,367 )
(1 ,1 87 )
(4,554)
$21 4
$21 4
$21 4
$21 4
$21 4
($953)
($1,026)
($7 23)
($397 )
$28
–
$443
2023P
–
$57 6
2024P
–
$656
2025P
–
$67 2
2026P
–
$67 9
5 Yr
10 Yr
$10,094
(8,1 7 7 )
(3,030)
(1 1 ,207 )
$1 ,069
$1 ,069
($3,07 1)
($44)
75
Annual Fiscal Plan Projections Including Measures
The following shows the annual projected financing surplus/(gap) after incorporating the
measures outlined previously
As shown below, in all years of the plan a deficit remains even after excluding all debt service and after incorporating the potential
benefits of economic growth
The larger deficits in the early years are driven by the large capital expenditures made during the period as well as the payments of
past-due payables
Note that the growth rate is estimated only based on the potential surplus available to fund these spending amounts (i.e., Puerto
Rico is assumed only be able to spend up to the amount until the surplus goes to zero); no external financing is assumed to fund
the deficits shown and further financing could increase future deficits due to associated debt service costs
Given the spending above the available surplus amount is assumed to not take place in the growth projection, the Financing Gap
before debt service shown below could potentially be eliminated by reducing the amount proposed to be spent in the Fiscal Plan
on stability and growth measures (though only up to the amount of spending that exceeds the available surplus, as any further
cuts would reduce the projected growth rate)
Assuming average real GDP growth that averages 0.1% between FY 2018 and FY 2026 as compared to negative 1.7% in the base,
there is still projected to be a deficit of $5.7 billion over ten years
Annual Summary of Financing Gap in the Post-Measures Projections from FY 2017 to FY 2026 ($ millions)
T otal
Fin. Gap Pre-Measures after Debt Serv .
2017P
2018P
2019P
2020P
2021P
2022P
2023P
2024P
2025P
2026P
($3,605)
($3,408)
($5,813)
($5,7 44)
($5,97 8)
($5,97 4)
($6,258)
($7 ,084)
($7 ,17 1)
($7 ,682)
5 Yr
($24,547 )
10 Yr
($58,7 16)
Plus: Debt Serv ice (1 )
3,909
3,294
3,87 2
3,493
3,438
3,1 38
3,554
Fin. Gap Pre-Measures before Debt Serv .
$304
($114)
($1,941)
($2,251)
($2,540)
($2,7 7 7 )
($3,120)
($3,530)
($4,116)
($4,37 4)
($6,541)
($24,457 )
(33)
6
(97 4)
(1 66)
(1 ,1 67 )
(3)
1 ,1 53
(1 ,564)
(1 66)
(581 )
(3)
1 ,901
(1 ,499)
(1 1 6)
283
(3)
2,1 92
(1 ,385)
(1 1 6)
687
(3)
2,403
(1 ,091 )
(1 1 6)
1 ,1 93
(3)
2,494
(57 0)
(1 1 6)
1 ,804
(3)
2,485
(443)
(1 1 6)
1 ,922
(3)
2,47 7
(37 1 )
(1 1 6)
1 ,987
(3)
2,47 0
(363)
(1 1 6)
1 ,987
(3)
2,464
(366)
(1 1 6)
1 ,97 9
(45)
7 ,655
(6,51 4)
(681 )
41 5
(60)
20,044
(8,627 )
(1 ,263)
1 0,094
($863)
($694)
($1,658)
($1,563)
($1,347 )
($97 2)
($1,197 )
($1,543)
–
202
340
7 18
939
($863)
($492)
($1,318)
($629)
0.2%
1 .9%
Measures Impact
Impr. Budg. Controls & Fiscal and Econ. Dec.-Making
Rationalize Ex p. and Tax Policy to Promote Effic.
Enact Struct. & Econ. Measures and Inv est in Growth
Protect Vulnerable Stakeholders (2)
Total Measures Impact
Fin. Gap Post-Meas. ex . Debt Serv . & Econ. Im pact
Est. Incr. Inc. from Econ. Dev . and Struct. Reforms
Fin. Gap Post-Meas. incl. Growth ex . Debt Serv .
501
($1,063)
3,1 97
3,055
3,308
1 8,007
34,258
($2,129)
($2,395)
1 ,1 85
1 ,427
1 ,61 2
1 ,7 82
($6,126)
–
1 ,7 61
($14,363)
–
8,7 07
($34)
($12)
($116)
($517 )
($613)
($4,365)
($5,656)
0.2%
1 .9%
0.4%
2.0%
0.3%
2.1 %
Memo: Macroeconomic Assumptions
Real Revenue Growth
Inflation
(1)
(2)
N/A
N/A
0.6%
2.1 %
(0.3% )
2.0%
(0.1 % )
1 .9%
(0.0% )
2.0%
(0.2% )
1 .9%
Includes principal and interest payments that may have been missed in FY 2016 and FY 2017. Debt service shown net of existing reserves used to pay debt service. Note that for illustrative purposes, debt service excludes debt held by GDB and
excludes revenues otherwise allocated to COFINA FY 2017 debt service.
Illustratively includes the reduction in the estimated portion of AUC as result of the exclusion of debt service, which amounts to approximately $80 million over the 10-year projection period.
76
A Replacement for ACA Funding Could Materially Improve Puerto Rico’s Fiscal
Position
Given a financing gap remains even after Puerto Rico implements the measures in its control,
it is essential that the U.S. Government become a partner in promoting economic growth in
Puerto Rico through items such as equitable healthcare treatment to replace ACA funding
Shown below is the illustrative impact of the U.S. Government providing the Commonwealth with more equitable
healthcare treatment, which is assumed to at least replace the loss of ACA funding
Even with actions of the U.S. Federal Government, there are still negative cash flows in the early years of the
projections driven by large capital expenditures and past-due payable payments that may potentially require
either delay or new, interim financing (for illustrative purposes no incremental financing cost is assumed)
By FY 2018, however, these actions combined with the measures outlined previously and the potential benefit of
incremental economic growth that would result from the elimination of the deficits that existed prior to ACA
funding could remove structural deficits and would produce a ten year financing surplus before debt service of
$18.9 billion
Note that this growth would not be possible without ACA type funding and that, even if ACA funding were
received, it may not be advisable to use as a level for setting fixed (vs. contingent) debt service given it would
be such a drastic turnaround for the Commonwealth economy
Annual Summary of Financing Gap After Select Federal Actions ($ millions)
T otal
Fin. Gap Before U.S. Gov 't Action
Replacement of ACA Funding
Fin. Gap After U.S. Gov 't Action
Change in Economic Trajectory
Fin. Gap After U.S. Gov 't Action & Econ. Im p.
2017P
2018P
2019P
2020P
2021P
2022P
2023P
2024P
2025P
2026P
5 Yr
10 Yr
($863)
($492)
($1,318)
($1,063)
($629)
($34)
($12)
($116)
($517 )
($613)
($4,365)
–
5,646
($5,656)
–
1 6,1 41
–
865
1 ,51 7
1 ,583
1 ,681
1 ,835
1 ,954
2,07 0
2,253
2,384
($863)
$37 4
$199
$520
$1,052
$1,801
$1,942
$1,954
$1,7 36
$1,7 7 1
$1,281
–
67
31 2
602
849
1 ,001
1 ,1 30
1 ,27 7
1 ,460
1 ,682
1 ,830
8,37 8
($863)
$441
$512
$1,122
$1,901
$2,802
$3,07 2
$3,231
$3,195
$3,452
$3,112
$18,863
(3,909)
($4,7 7 2)
(3,294)
($2,853)
(3,493)
($2,37 1 )
(3,438)
($1 ,538)
$10,485
Memo: Financing Gap After Debt Service
Inclusion of Debt Service (1)
Fin. Gap Incl. Debt Serv. After U.S. Gov't Action
(3,87 2)
($3,361 )
(3,1 97 )
($396)
(3,1 38)
($66)
(3,554)
($323)
(3,055)
$1 41
(3,308)
$1 44
(1 8,007 )
($1 4,895)
(34,258)
($1 5,395)
Memo: Macroeconomic Assumptions
Real Revenue Growth
Inflation
(1)
N/A
N/A
1 .3%
2.2%
1 .9%
2.7 %
1 .9%
3.1 %
1 .6%
3.1 %
1 .1 %
2.9%
1 .2%
2.6%
1 .3%
2.3%
1 .2%
2.0%
1 .2%
1 .6%
Includes principal and interest payments that may have been missed in FY 2016 and FY 2017. Debt service shown net of existing reserves used to pay debt service. Note that for illustrative purposes, debt service excludes debt held by GDB and
excludes revenues otherwise allocated to COFINA FY 2017 debt service.
77
Section IV –
Appendix
78
Appendix A –
Additional Detail on Commonwealth Historical
Reporting
79
Overview of Commonwealth Financial Reporting
In order to assess the Fiscal Plan relative to the Commonwealth’s historical operating results,
it is essential to first understand how the Commonwealth’s audited financial results are
reported in its Comprehensive Annual Financial Report (“CAFR”), last published for fiscal
year 2014
As shown below, the Commonwealth’s CAFR includes two types of audited financial statements –
(1) Government Wide Financial Statements and (2) Fund Financial Statements
Commonwealth of Puerto Rico Two Types of Financial Statements
1
Government Wide Financial Statements
•
•
•
•
Provides a broad view of the Commonwealth’s operations
in a manner similar to a private sector business
Statements are prepared using the economic resources
measurement focus and the full accrual basis of accounting,
meaning they take into account all revenue and expenses
connected with the fiscal year even if cash has not been received or
paid
Include two types of statements
1. Statement of Net Position – Presents all of the
government’s assets, liabilities and deferred outflows and
inflows of resources. The “Net Position” represents the
difference between (A) assets and deferred resource outflows,
and (B) liabilities and deferred resource inflows
2. Statement of Activities – Shows how the government’s
Net Position changed during the fiscal year (regardless of
cash flow timing)
Over time, increases or decreases of the Commonwealth’s Net
Position may serve as a useful indicator of whether the
financial position of the Commonwealth is improving or
deteriorating
2
•
•
•
•
Fund Financial Statements
A fund is a grouping of related accounts that is used to maintain
control over resources segregated for specific activities or objectives
Fund financial statements focus on individual parts of the
Commonwealth government, reporting certain of the
Commonwealth’s operations in more detail than the
government-wide financial statements (“GWFS”)
Information differs from the GWFS because the perspective and/or
basis of accounting used to prepare the statements differ
There are three broad fund types;
1. Governmental Funds – reports similar information to
parts of the GWFS, but focuses on near-term inflows
and outflows of expendable resources, using modified
accrual accounting, which may be helpful to evaluate nearterm financing requirements
2. Proprietary Funds – reports similar information to parts
of the GWFS but provides more detail; reported on a full
accrual accounting basis
3. Fiduciary Funds – provides the net position of funds where
the Commonwealth is a trustee or fiduciary, such as the
pension funds. Does not directly overlap with the
GWFS as funds cannot be used for other purposes.
80
Additional Detail on Government Wide Financial Statements
The Government Wide Financial Statements can be further divided into the Primary
Government, which in turn includes Governmental Activities and Business-Type Activities,
and Discretely Presented Component Units
1
Government Wide Financial Statements
A
i
Primary Government
(Full Accrual)
Governmental Activities
• Most of the Commonwealth’s
basic services are reported here,
along with the majority of its
revenues
• Inflows include items such as
income taxes, consumption and
use taxes, certain lottery revenues,
federal grants and debt proceeds
• Outflows include expenses such as
those related to education, health,
public welfare, public safety,
economic development and
general government interest on
long-term debt
• Also includes six blended
component units: (1) COFINA;
(2) PBA; (3) PRIFA; (4) CTF; (5)
MSA and (6) Special Comm. Perp.
Trust)
(1)
(2)
(3)
PR Sales Tax Financing Corporation (“COFINA”)
Public Buildings Authority (“PBA”)
PR Infrastructure Financing Authority (“PRIFA”)
ii
Business-Type Activities
• Activities typically intended
to recover all/most of their
costs through fees and
charges to external users of
provided goods and services
• Includes:
• Unemployment Insurance Fund
• Lotteries
• Medical Services Admin.
• 9-1-1 Governing Board
• Drivers Insurance Fund
• Disability Insurance Fund
• PR Water Pollution Control
Revolving Fund
• PR Safe Drinking Water Fund
(4)
(5)
(6)
Children’s Trust Fund (“CTF”)
PR Maritime Shipping Authority (“MSA”)
Special Communities Perpetual Trust
B
Discretely Presented Component Units
(Full Accrual)
• Although legally separate, these component
units are important to the Commonwealth
because the Commonwealth is financially
accountable for them or the nature and significance
of their relationship is such that their exclusion
would make the statements incomplete
• They are presented discretely primarily
because of the services they provide, the
Commonwealth’s ability to impose its will
(principally through appointment of governing
authorities) and because they provide specific
financial benefits to, or impose financial
burdens on, the Commonwealth
• “Major Component Units” include:
• Government Development Bank (GDB)
• Highways and Transportation Authority (HTA)
• Health Insurance Administration (HIA/ASES)
• University of Puerto Rico (UPR)
• State Insurance Fund Corporation (SIF)
• Aqueduct and Sewer Authority (PRASA)
• Electric Power Authority (PREPA)
• There are also 38 non-major component units
81
Additional Detail on Fund Financial Statements
The Fund Financial Statements can be further broken down into the Governmental Funds,
Proprietary Funds and Fiduciary Funds, each with sub-categories of funds as shown below
2
Fund Financial Statements
Governmental Funds
(Modified Accrual)
I
Finances most of the Commonwealth’s basic services.
Unlike governmental activities, these financial statements
emphasize a near-term focus on inflows and outflows
•
General Fund
•
•
Other
Governmental
Funds
Blended
Component
Units
(1)
•
•
•
•
•
•
•
•
•
General Fund Operating
Fund (the primary operating
fund of the Commonwealth),
Entities with Independent
Treasuries (OASA, PRPHA,
PRLDA, OIPs)
“Non-Budgetary “ Funds(1)
Debt Service Fund
Capital Projects Fund
COFINA Special Revenue
Fund
COFINA Debt Service Fund
PBA
PRIFA
Maritime Shipping
Authority
Children’s Trust Fund
Special Communities
Perpetual Trust
II
Proprietary Funds
(Full Accrual)
Shows operations comparable to commercial enterprises.
Shows similar information as business-type activities but
in more detail. Also referred to as enterprise funds.
III
Fiduciary Funds
(Full Accrual)
Funds where the CW is a
trustee/fiduciary over
pensions or special trust
PR Water Pollution
Control Revolving
Fund
9-1-1 Service
Governing Board
Employees’
Retirement System
(ERS)
Unemployment
Insurance Fund
Drivers Insurance
Fund
Teachers’ Retirement
System (TRS)
Lotteries
(Traditional and
Electronic)
Disability Insurance
Fund
Judiciary Retirement
System (JRS)
Medical Services
Administration
(ASEM)
PR Safe Drinking
Water Treatment
Revolving Loan Fund
Agency Fund (Special
Deposit Fund)
Includes:
a)
Special Revenue Funds – used to account for proceeds of specific revenue sources restricted or committed to expenditure for specified purposes other than debt service .
b)
Internal Revenue Funds – includes only the General Services Administration (“GSA”) and accounts for transactions within the Commonwealth.
c)
Other General-type Funds – includes expenses or accruals incurred, not appropriated in the General Fund budget and appropriations made by the Legislature without a specific revenue source.
82
Overlap Between Government Wide and Fund Financial Statements
The Government Wide Financial Statements and Fund Financial Statements have significant
overlap in regards to the Commonwealth entities they include, though the reporting may differ
in how the results for such entity are reported
1
ii
Governmental Activities
Business-Type Activities
2
Overlaps
With
I
Overlaps
With
II
Fund Financial Statements
Governmental Funds
Proprietary Funds
Commentary
Similar information, but
Governmental Activities reported
on full accrual basis while
Governmental Funds reported
using modified accrual
Both on a full accrual basis, but
Proprietary Funds provide greater
detail
A
Primary
Government
i
Government Wide Financial
Statements
Items without Overlap Direct Overlap Between Government Wide and Fund Financial Statements
Discretely Presented Component
Units
B
Fiduciary Funds
III
Fiduciary Funds are not included
in the government wide financial
statements, though the
government wide financial
statements do include the
accrued actuarial obligations to
the pension systems from the
entities included in the
Government Wide Financial
Statements
83
Combined Reporting Structure
The following presents the Government Wide Financial Statements and the related Funds as a
way to further illustrate the relationship between the two types of financial statements
Commonwealth of Puerto Rico Basic Financial Statements
Government Wide Financial Statements
Discretely Presented
Component Units
Primary Government
Business-Type Activities
Governmental Activities
Fund Financial Statements
Fund Financial Statements
General Fund
• General Fund Operating Fund
• Entities with Independent
Treasuries
• Non-Budgetary Funds
Other Governmental Funds
• Debt Service Fund
• Capital Projects Fund
Blended Component Units
• PR Sales Tax Financing
Corporation (COFINA)
• Public Building Authority (PBA)
• PR Infrastructure Financing
Authority (PRIFA)
• Maritime Shipping Authority
• The Children’s Trust
• Special Communities Perpetual
Trust
(1)
•
•
Government
Development Bank for PR
(GDB)
PR Aqueduct and Sewer
Authority (PRASA)
•
PR Water Pollution Control
Revolving Fund
•
•
Unemployment Insurance
Fund
PR Electric Power
Authority (PREPA)
•
•
Lotteries
− Traditional
− Electronic
State Insurance Fund
Corporation (SIF)
•
PR Highways and
Transportation Authority
(PRHTA)
•
Puerto Rico Health
Insurance Administration
(PRHIA)
•
University of Puerto Rico
(UPR)
•
38(1) Non-Major
Component Units
•
PR Medical Services
Administration (ASEM)
•
Other Proprietary Funds
− 9-11 Service Governing
Board
− Drivers Insurance Fund
− Disability Insurance Fund
− PR Safe Drinking Water
Treatment Revolving Loan
Fund
Fiduciary Funds
•
Employees Retirement
System (ERS)
•
Teachers’ Retirement
System (TRS)
•
Judiciary Retirement
System (JRS)
•
Agency Fund (Special
Deposit Fund)
The June 30, 2014 CAFR excludes the Ponce Ports Authority, Government Investment Trust Fund, and Municipal Finance Corporation (COFIM) from its presentation of the non-major component units. Adding back these
component units results in a total of 41.
84
Modified Accrual vs Full Accrual Accounting
To further clarify the relationship and differences between the various types of financial
statements, the following provides greater detail on the modified accrual vs full accrual
reporting approaches
The Governmental Funds financial statements use a modified accrual basis of accounting, which focuses on nearterm inflows and outflows of expendable resources and is best used to evaluate the government’s near-term
financing requirements
Conversely, the “Governmental Activities” included in the GWFS relate to the same activities included in the
Governmental Funds, but are reported using a full accrual basis of accounting, which focuses on economic
resources and records all revenue and expenses connected with the fiscal year even if cash has not been received
or paid
Both types of statements are valuable and, in combination they help the reader understand the long-term impact
of the government’s near-term financing decisions
The following(1) presents a high level overview of the two accounting approaches
Line Item
Modified Accrual
Full Accrual
Revenues
Governmental funds recognize revenues as cash is
received during or soon after the end of the year
and when it is earned and both measurable and
available
Expenses (ex.
Capex and Debt
Service)
In the absence of an applicable modification, Fund expenditures are recognized in the fiscal year in
expenditures are recognized in the fiscal year in
which the agency incurs a liability. Adjustments may
which they are expended or when they are subject
be needed to ensure the matching principle is
to accrual. Accruals are recorded when they are
followed.
expected to use expendable financial resources.
Recognize the expenditure at the acquisition date
Capex
Debt Service
(1)
Recognize the revenue in the fiscal year in which the
agency earns the revenue and it is measurable.
Availability is not a factor.
Recognize the cost of the asset and depreciate the
value over the expected useful life of the asset.
Recognize debt service expenditures only when Recognize the liability/expense in the fiscal year in
payment is due
which the agency incurs the liability/expense
Source: Texas Comptroller of Public Accounts. https://fmx.cpa.texas.gov/fmx/pubs/afrrptreq/gen_acct/index.php?section=overview&page=contrasts.
85
The Plan Includes Nearly All Governmental Activities and Governmental Funds
The Fiscal Plan presents a holistic view of the Commonwealth’s financial challenges, and as
such includes nearly the entirety of the activity included in Governmental Activities or
Governmental Funds
The lone exception is the Children’s Trust Fund, which is excluded as it is an independent financing vehicle
without recourse to Commonwealth tax revenues
Note that later in this presentation, important information is provided regarding how the projections for each of
the funds and component units outlined herein were developed and incorporated into the model
1
a
General Fund
Governmental Activities
Blended Component Units
Debt Service Fund
General Fund Operating Fund
Entities with Independent
Treasuries (OASA, PRPHA,
PRLDA, OIPS)
Non-Budgetary Funds (Special
Revenue Funds, Internal
Revenue Funds and Other
General-Type funds)
Other Governmental
Funds
Sales Tax Financing Corp.
(COFINA)
Maritime Shipping Authority
Public Building Authority
(PBA)
The Children’s Trust Fund
Infrastructure Financing Auth.
(PRIFA)
Special Communities Trust
Capital Projects Fund
Only Governmental
Activity that is Excluded
86
The Plan Also Includes Nearly All Of the Business Type Activities/Proprietary
Funds
The Fiscal Plan also includes virtually all of the Business Type Activities/Proprietary Funds
insofar as such funds are not associated with a debtor that is excluded from the Fiscal Plan
(e.g., PRASA)
1 b
Business-Type Activities
Major Proprietary Funds
Water Pollution Control Revolving Fund
Non-Major Proprietary Funds
The only
Proprietary
Funds excluded,
(considered
part of PRASA)
Safe Drinking Water Treatment Revolving
Loan Fund
Unemployment Insurance Fund
9-1-1 Services Governing Board
Lotteries Fund
(Traditional & Electronic)
Drivers
Insurance Fund
Medical Services Admin. (ASEM)
Disability
Insurance Fund
87
The Plan Includes The Vast Majority of Component Units, with PREPA and
PRASA being the Primary Exceptions
The majority of Component units on the island are either dependent on the Commonwealth’s tax revenues
(e.g., HTA, UPR, Health Insurance Administration) or have historically produced a surplus that could be
available to the Commonwealth to fund its operations (e.g., the State Insurance Fund). All of these types of
entities are included in the Fiscal Plan
Entities with independent revenues sources, such as PREPA and PRASA, are excluded from the Plan and it is
presumed, should these entities require a restructuring, that they could do so independently without requiring
the resolution of other Commonwealth credits
Discretely Presented Component Units
Government Development Bank for Puerto
Rico (GDB)
State Insurance Fund Corporation
HFA, a
subsidiary of
GDB, is a
blended
component unit
and is excluded
from the Fiscal
Plan
Puerto Rico Highways and Transportation
Authority (PRHTA)
Puerto Rico Health Insurance
Administration (PRHIA)
Puerto Rico Aqueduct and Sewer Authority
(PRASA)
University of Puerto Rico (UPR)
Puerto Rico Electric Power Authority
(PREPA)
38 Non-Major Component Units
PREPA, PRASA and MFA are excluded
from the Fiscal Plan as they have
independent revenue streams. COSSEC is
technically excluded though the Plan
recognizes that in any debt restructuring
the COOP system may need to be
recapitalized
(1)
2014 Change in
Net Position (1)
Public Corporation for the Supervision and Deposit
Insurance of Puerto Rico Cooperatives (COSSEC)
Puerto Rico Municipal Finance Agency (MFA)
$12.4mm
$(17.3)mm
2014 Comprehensive Annual Financial Report (“CAFR”), Combining Statement of Activities of Non-Major Discretely Presented Component Units.
88
Fiduciary Funds Are Incorporated Into the Plan Through the Funding Provided to
the Funds from Other Entities in the Plan
The retirement system fiduciary funds are incorporated into the Fiscal Plan through the
payment of employer contributions, special laws, and additional contributions that are
estimated to be needed to keep the pensions systems adequately funded
3
Fiduciary Funds
Employees Retirement System (ERS)
Teachers Retirement System (TRS)
Judiciary Retirement System (JRS)
Agency Fund (Special Deposit Fund)
Excluded from the Fiscal Plan as it is custodial
in nature (assets equal liabilities) and does not
involve a measurement of the results of
operations
89
Summary of Fiscal Plan Relation to Commonwealth Reporting
The Fiscal Plan includes the vast majority of Commonwealth funds, agencies, and component
units. The only debt issuers excluded are those with independent revenue sources or
financing vehicles without recourse to Commonwealth taxes (in red below)
Commonwealth of Puerto Rico Basic Financial Statements
Government Wide Financial Statements
Discretely Presented
Component Units
Primary Government
Business-Type Activities
Governmental Activities
•
•
Fund Financial Statements
Fund Financial Statements
General Fund
•
•
Other Governmental Funds
Blended Component Units
Virtually all governmental
activities are included in the
Fiscal Plan
•
•
•
PR Water Pollution Control
Revolving Fund
Unemployment Insurance
Fund
Lotteries
PR Medical Services
Administration (ASEM)
Other Proprietary Funds
Virtually all business-type activities
are included in the Fiscal Plan
Virtually all of the Primary Government (and the
associated funds) is included in the Fiscal Plan
(1)
(2)
•
•
•
•
•
•
Government Development Bank
for PR (“GDB”) (excl. HFA)
PR Aqueduct and Sewer
Authority (PRASA)
PR Electric Power Authority
(PREPA)
State Insurance Fund
Corporation
PR Highways and
Transportation Authority
(PRHTA)
Puerto Rico Health Insurance
Administration (PRHIA)
University of Puerto Rico (UPR)
38 Non-Major Component
Units(1) (excluding COSSEC and
MFA(2))
With the exception of PREPA
and PRASA, the largest
discretely presented component
units (and majority in number)
are included in the Fiscal Plan
Fiduciary Funds
•
•
•
•
Employees Retirement
System (ERS)
Teachers’ Retirement
System (TRS)
Judiciary Retirement
System (JRS)
Agency Fund (Special
Deposit Fund)
The Retirement Systems
are incorporated into the
Fiscal Plan through the
expense from the
Primary Government
and component units to
pay for full funding of
the retirement systems
(including the
AUC/AAC). This makes
the Fiscal Plan more akin
to the Government Wide
(and Governmental
Fund) financial
statements
The June 30, 2014 CAFR excludes the Ponce Ports Authority, Government Investment Trust Fund, and Municipal Finance Corporation (COFIM) from its presentation of the non-major component units. Adding back these component units results in a
total of 41.
EDB is included in the model, but assumed to have zero impact due to the way EDB reports its debt.
90
Overview of Fiscal Plan Projection Approach
Though greater details on how specific projections for the funds and component units
included in the Fiscal Plan will be provided in separate presentations, it is important to
understand the general methodology used to develop the projections. As explained further
below, the Fiscal Plan projections generally followed a modified accrual approach, with
certain exceptions for items that will require cash outflows from the Commonwealth
Revenues
• The General Fund revenue projections, which account for three quarters of the revenues in the Fiscal Plan
(excluding Federal Transfers), took as a starting point the FY 2017 budgeted revenues which are projected on a
cash basis and therefore would most closely resemble modified accrual as revenues that would be collected
outside the period would not be counted
• Other large revenue sources, such as the sales tax collections outside the General Fund and the petroleum and
gas taxes, were also projected based on estimates of the cash that would actually be collected each fiscal year
Expenses
• Debt service is included in the plan according to when principal and interest actually come due, consistent with
a modified accrual approach
• General Fund expenditures (excluding debt service) take as a starting point the General Fund budget, which is
projected on a cash basis inconsistent with modified accrual. However, where expenses, such as retirement
system contributions, were not accounted for in the General Fund budget they were added to the projections
• Capital expenditures were projected on as incurred basis and not expensed over time through depreciation ,
consistent with modified accrual
• Component unit expenses were informed by past results reported on an accrual basis, but apart from capex and
debt service, this generally corresponds to a modified accrual approach as well
Certain “Past Due” Amounts Included in the Plan and Other Non-Modified Accrual Elements
• Certain items, such as the payment of past due payables and tax refunds, were included in the Fiscal Plan as
they will require a cash outflow from the Commonwealth, though on a modified accrual basis they may have
been expensed in periods prior to those shown in the Plan
• Funding of an adequate working capital facility (the “deposit build”) would also not be an expense under
modified accrual
• The Commonwealth included these amounts as they will materially impact the actual cash available to pay debt
service (note these items are removed when analyzing against the Commonwealth’s historical results for
comparative purposes)
91
Appendix B –
Additional Detail on Fiscal Plan Base
Projections
92
Under Current Laws and Policies, Puerto Rico Will Have a Significant Financing Gap
Puerto Rico projects a cumulative shortfall of revenues as compared to expenditures (a
“financing gap”) of approximately $59 billion over the next ten years (the “Base Financing
Gap” or the “Base Projections”)
The Commonwealth’s current revenues are not sufficient to support existing current operations and debt service, despite the
Commonwealth’s recent extraordinary efforts to close the financing gap. Three approaching fiscal cliffs, with an estimated ten year
cumulative impact of $35.3 billion, will only further exacerbate the current crisis:
1. The depletion of Affordable Care Act (“ACA”) funds, which is estimated to occur in fiscal year (“FY”) 2018
2. The estimated loss of tax revenues from the conversion of Act 154 excise tax to a modified source income rule in FY 2018
3. The depletion of liquid assets in the retirement systems, expected to occur on or before FY 2018, will require increased
contributions to the pension systems to avoid an interruption of benefit payments
In addition, based on current policies and macroeconomic trends, economic contraction is expected to continue at an average rate of
approximately 1.7% per year, resulting in an increase to the financing gap of $5.5 billion over the next decade as compared to a case
in which the economy experiences 0% real growth(1)
The size of the financing gap detailed below assumes no measures are taken to fill the gap; if the Commonwealth were forced to only
pursue austerity-type measures to address this shortfall, it is estimated real GDP contraction would intensify
Summary of Cumulative “Financing Gap” Under Current Laws and Policies from FY 2017 to FY 2026 ($ millions) (2)
$30,000
$20,000
$17,023
$10,000
–
($10,000)
($20,000)
($34,967)
($17,944)
($30,000)
($16,141)
($40,000)
($50,000)
($60,000)
Based on Flat Real GDP
Base Revenue Before ACA, 154 Losses and Economic Contraction
Base Expenses Before Debt Serv. and Incr. Pension Contribution Req. by Current Law
Base Financing Gap Pre-Debt Serv. and Fiscal Cliffs
($70,000)
Base Fin. Surplus PreDebt Serv. and Fiscal
Cliffs
(1)
(2)
(3)
(4)
(5)
(3)
Debt Service
Base Fin. Gap Post Debt
Serv., Pre-Fiscal Cliffs
10 Yr
$202,043
(185,020)
$17,023
Loss of ACA Funding
($8,177)
($10,993)
($5,460)
Act 154 Losses
Incremental Pension Est. Impact of Economic
(5)
Contributions Req. by
Contraction
(4)
Current Law
($58,716)
Base Fin. Gap
Inflation is illustratively held constant under both real growth assumptions at an average rate of 1.8% from 2018 to 2026.
Base Projections shown correspond to the revenues and expenses only of those entities included in the Fiscal Plan presented herein. See the "Fiscal Plan Projections" for greater details on entities included in the Plan.
Note that for illustrative purposes, debt service excludes loans from GDB and certain bonded indebtedness of Commonwealth entities held by GDB. Numbers also include past due amounts and are net of debt service reserves.
Incremental contributions represent the Annual Additional Contributions (“AAC”) required to be paid to the Teachers and Judicial Retirement Systems and the Additional Uniform Contribution (“AUC”) required to be paid to the Employees
Retirement System based on estimates provided by the Commonwealth’s actuaries incorporating updated assumptions regarding items such as changes in the size of the active membership and future payroll assumptions consistent with the
Fiscal Plan. The amount shown includes payments of certain past-due amounts from previous years, as such amounts are assumed to have been paid in work performed by the actuaries.
Estimated impact of economic contraction corresponds to the estimated impact of real GDP growth going from 0% to an average of negative 1.7% from FY 2018 and FY 2026.
93
Shown Below Are the Building Blocks to the Cumulative 10-Year Fiscal Plan
Base Projections
BASE PROJECTION INFLOW BUILD ($ billions)
General Fund (“GF”)
Revenues
Additional Sales and
Use Tax (“SUT”)
Other Tax Revenues
Other Non-Tax
Revenues (Excl.
Fed. Grants and
GDB revenues)(1)
Base “Adjusted”
Revenues
$81.1
GF includes majority of taxes, such as
income, withholding and the GF portion
of the sales and use tax; projection based
on FY 2017 budget, generally grown at
Base Nominal Rate; note that the effect of
the expiration of the 154 excise tax is
included herein (reduces revenues by
$8.2 bn)
$9.9
Includes additional SUT collections
historically allocated to entities outside
the GF (the GF revenues include a portion
of SUT); projected based on actual FY
2017 GF revenue projections grown at the
Base Nominal Rate
$14.0
Other Tax Revenues recorded outside of
the GF, including those assigned to
component units. The largest single
amounts in this group are Petroleum
Products and Gas taxes ($ 6.5 bn),
Cigarette Taxes ($ 0.7 bn, and Casino Slot
Revenues ($1.5 bn)
$6.5
$111.5
Largest single amounts of non-tax
revenues relate to charges for services,
such as tuition and fees at UPR ($1.8 bn),
net lottery revenues ($0.5 bn), HTA
revenues such as road and train tolls
($2.6 bn)(1)
BASE PROJECTION OUTFLOW BUILD ($ billions)
$88.4
Includes expenses to fund the primary
functions of the central government, such as
healthcare, public safety and education;
projection based on FY 2017 budget
generally grown by inflation; excludes debt
service and shown after a reduction of debt
service for entities largely funded by
appropriations, such as PBA and UPR
AAC/AUC (“Incr.
Retirement System
Funding”)
$11.0
Represents estimates, developed in
conjunction with actuarial work done by
Milliman, of the legally required AUC and
AAC, as well as “catch-up” payments from
previous years, required to adequately fund
ERS, TRS and JRS retirement systems
Estimated Run-Rate
Capex
$4.2
GF Expenses
(Ex. Debt, AUC/AAC)
Special Revenue
Funds, Enterprise
Funds and
Component Units
$12.1
Cigarette, Rum, SUT
and Lotto
Disbursements to
Entities Outside Plan
$3.1
Base “Adjusted”
Expenses
$118.8
FY 2017 based on OMB Budget and FY
2018-2026 based on a review of recent
historical data
Includes the net result of blended and nonblended component units other than entities
such as PREPA and PRASA, which are
excluded from the plan; also includes
projections of Special Revenue(2) and
Enterprise Funds
Includes tax and other revenues (such as
cigarette excise tax, rum excise tax and
lottery related outflows) to entities outside
of the model (such as to the rum producers
and municipalities)(3)
Note: Revenues shown already reflect the economic contraction. Base Adjusted Expenses include retirement system “catch-up” payments.
(1)
Note that Federal Grants and GDB revenues are included in the Fiscal Plan, but they are excluded from “Base Adjusted Revenues.” Base Adjusted Revenues are developed as a metric that is meant to be comparable to state revenue collections
apart from Federal Funding as a proxy for the discretionary revenues a state has available. Federal Grant revenues are provided for specific purposes and generally could not be repurposed for something such as debt service (unless specifically
provided for debt service) which is only a very small portion of Federal Grants). GDB loan revenues have been excluded as they are not expected to be recurring since GDB is currently not extending new lines of credit.
(2)
Special Revenue Funds shown on a net operating deficit basis, excluding tax revenues which are shown separately under revenues. The revenues and expenses embedded in the cumulative ten-year $1.6bn net deficit related to Special Revenue
Funds include $4.7bn and $6.3bn, respectively. The Special Revenue Funds consist mostly of charges for services for public corporations and Commonwealth agencies
(3)
Includes, among others, estimated outflows of $1.3bn and $500mm to private rum producers and municipalities for rum and lottery related outflows, respectively. Other outflows include outflows related to cigarette excise taxes and other rum
excise tax outflows to other entities.
94
Shown Below Are the Building Blocks to the Cumulative 10-Year Fiscal Plan
Base Projections (cont’d)
BASE PROJECTION INFLOW BUILD ($ billions)
Adjusted
Revenues
GDB Inflows(1)
Federal Transfers
Before Loss of ACA
Funding
Loss of ACA Funding
Adjusted
Expenses
$111.5
$2.0
Represents GDB net loan and deposit
inflows from entities excluded from the
Fiscal Plan; excludes intra-governmental
transfers from entities included in the
Fiscal Plan
$75.1
Represents transfers from the Federal
Government that are applied to specific
required expenditures and therefore are
set equal to the transfers out, resulting in
a net zero impact on the financing gap
$16.1
$172.5
GDB Outflows
$118.8
$1.9
Represents GDB net loan and deposit
outflows to entities excluded from the
Fiscal Plan; excludes intra-governmental
transfers to entities included in the Fiscal
Plan
Federal Transfers
Before Loss of ACA
Funding
$ 75.1
Represents transfers from the Federal
Government that are applied to specific
required expenditures and therefore are set
equal to the transfers out, resulting in a net
zero impact on the financing gap
Oversight Board
Costs
$370
mm
Based on Congressional Budget Office June
3, 2016 Cost Estimate of H.R. 5278
(PROMESA), as ordered by the House
Committee on Natural Resources
Represents the estimated impact from
the depletion of ACA funding, estimated
to occur in FY 2018; the total size of the
impact grows over time based on the
assumed increase in healthcare expenses
Note that the impact of the ACA funding loss is illustratively shown as a
reduction of revenues. Federal Transfer associated expenses are not shown as
reduced, though in reality the Federal Transfer expenses would be reduced
and in its place the Commonwealth would have to expend more of its own
resources in order to continue operating its current healthcare system
Total Inflows
BASE PROJECTION OUTFLOW BUILD ($ billions*)
Outflows Excl.
Debt Service
*Except where otherwise noted.
(1)
Note GDB inflows include certain inflows related to TDF, though TDF payments on account of guarantees are included in debt service.
$196.2
95
Shown Below Are the Building Blocks to the Cumulative 10-Year Fiscal Plan
Base Projections (cont’d)
BASE PROJECTION OUTFLOW BUILD ($ billions)
BASE PROJECTION INFLOW BUILD ($ billions)
Total Inflows
Outflows Excl.
Debt Service
$172.5
$196.2
Total Inflows Less Total Outflows Excl. Debt Service Results In….
A Base Financing Surplus/(Gap) ex. Debt Service
Debt Service
Total Base Financing Surplus/(Gap)
(1)
$35.0
($23.7)
Includes bonded debt service of entities
included in the Fiscal Plan, including GO
(including GSA loans), GDB, PBA, PFC, PRIFA
(Bonds and BANs), UPR, PRCCDA, PRIDCO,
HTA, ERS, and COFINA; Note that missed debt
service payments from FY 2016 and 2017 are
assumed to be paid in FY 2017(1)
($58.7)
Note that for illustrative purposes, debt service excludes debt held by GDB and certain guaranteed debt including guaranteed debt of PRASA. Debt service is shown net of existing reserves.
96
However, After FY 2017 the Commonwealth Will Face a Myriad of Fiscal Cliffs
that Will Cause It to Experience Steep Fiscal Deficits Even Before Debt Service
The following presents a summary of the annual Base Projections from FY 2017 to FY 2026
The first subtotal represents the Base revenues and expenses before debt service, the three upcoming fiscal cliffs (ACA, Act
154 and retirement system asset depleting necessitating the AUC/AAC) and the payment of past due amounts and shows
that the Commonwealth initially produces a surplus before debt service. This surplus declines over time primarily due to:
•
The expiration of Act 66, which will be discussed further in the context of the General Fund Budget
•
Increasing healthcare expenses, which will be discussed further in the context of the ASES projections
•
And the combination of inflation, which drives costs and negative assumed real GDP growth, which, in combination
with inflation, drives revenue projections; the macroeconomic projections will be discussed further later in the
presentation
As the projections below illustrate, the more material driver of the decline in surplus/increase in the Base financing gap
are the three approach fiscal cliffs; absent these amounts the base projection is actually below historical averages
Summary of Base Projections ($ millions)
10-Y ear
2017 P
2018P
2019P
2020P
2021P
2022P
2023P
2024P
2025P
2026P
T otal
Average
$19,410
(17,700)
$19,515
(18,049)
$19,629
(18,354)
$19,735
(18,543)
$19,846
(18,878)
$19,965
(19,291)
$20,090
(19,821)
$20,238
(20,095)
$196,776
(185,213)
$19,678
(18,521)
1,710
1,466
1,275
1,192
968
674
270
143
11,563
1,156
(1,517)
(962)
(1,172)
(1,583)
(962)
(1,172)
(1,681)
(962)
(1,172)
(1,835)
(962)
(1,172)
(1,954)
(962)
(1,172)
(2,070)
(962)
(1,172)
(2,253)
(962)
(1,172)
(2,384)
(962)
(1,172)
(16,141)
(8,177)
(10,588)
(1,614)
(818)
(1,059)
(114)
(1,941)
(2,251)
(2,540)
(2,777)
(3,120)
(3,530)
(4,116)
(4,374)
(23,344)
(2,334)
(2,319)
(994)
(2,239)
(1,634)
(2,169)
(1,324)
(2,118)
(1,320)
(2,062)
(1,135)
(2,025)
(1,113)
(1,974)
(1,580)
(1,972)
(1,083)
(1,910)
(1,399)
(21,160)
(12,830)
(2,116)
(1,283)
(2,204)
(3,427)
(5,813)
(5,744)
(5,978)
(5,974)
(6,258)
(7,084)
(7,171)
(7,682)
(57,334)
(5,733)
Base Gap After Debt Service and Fiscal Cliffs
Past-Due Interest and Principal
(1,375)
Use of Legacy Reserves
379
Past-due AUC
(405)
–
19
–
(1,375)
398
(405)
(137)
40
(40)
($58,716)
($5,872)
Base Surplus Pre-Debt Serv. Fiscal Cliffs and Past Due Amts
Base Revenues (Excl. ACA and 154 Impacts)
$19,065
$19,282
Expenses Excl. Debt Service and AAC/AUC
(17,006)
(17,477)
Subtotal
2,059
1,805
Base Surplus/(Gap) Pre-Debt Service and Past Due Amts
Loss of ACA Funding
–
(865)
Reduction in Act 154 Revenues
–
(481)
Current Y ear AAC/AUC
(642)
(572)
Subtotal
1,418
Base Gap Before Past Due Amts. Embedded in Baseline
Current Y ear Interest
(2,373)
Current Y ear Principal(1)
(1,249)
Subtotal
Total
Memo: Macroeconomic Assumptions
Real GDP Growth (CAGR: -1 .7 % )
Inflation (CAGR: 1 .8% )
($3,605)
N/A
N/A
($3,408)
(1 .5% )
1 .9%
–
–
–
($5,813)
(1 .8% )
1 .8%
–
–
–
($5,744)
(1 .8% )
1 .8%
–
–
–
($5,978)
(1 .8% )
1 .8%
–
–
–
($5,974)
(1 .8% )
1 .8%
–
–
–
($6,258)
(1 .8% )
1 .8%
–
–
–
($7,084)
(1 .7 % )
1 .8%
–
–
–
($7,171)
(1 .7 % )
1 .8%
–
–
–
($7,682)
(1 .7 % )
1 .9%
97
Summary Page - Revenues
The following table presents a detailed summary of revenues included in the Fiscal Plan Base
Projections
T otal
2017 P
2018P
2019P
2020P
2021P
2022P
2023P
2024P
2025P
2026P
5 Yr
10 Y r
Rev enues before Measures
General Fund Revenues (incl. Act 1 54 / Excise Tax Losses)
1
Indiv idual Income Tax es
$1 ,966
$1 ,97 2
$1 ,97 3
$1 ,97 2
$1 ,97 1
$1 ,97 0
$1 ,97 0
$1 ,97 0
$1 ,97 2
$1 ,97 5
$9,854
$1 9,7 1 1
2
Corporate Income Tax es
1 ,525
1 ,565
1 ,565
1 ,565
1 ,564
1 ,563
1 ,563
1 ,563
1 ,565
1 ,568
7 ,7 84
1 5,606
7 63
7 63
7 63
7 63
7 63
7 63
7 63
7 63
7 63
7 63
3,81 5
7 ,630
1 ,924
(481 )
27 3
1 ,924
(962)
27 3
1 ,924
(962)
27 3
1 ,924
(962)
27 3
1 ,924
(962)
27 3
1 ,924
(962)
27 3
1 ,924
(962)
27 3
1 ,924
(962)
1 ,924
(962)
9,620
(3,367 )
1 9,240
(8,1 7 7 )
27 3
27 3
1 ,363
2,7 27
294
17 9
1 ,469
2,938
887
7 ,7 67
1 ,7 69
1 4,685
1 ,1 7 3
1 80
3
Non-Resident Withholdings
4
5
Act 1 54 / Ex cise Tax Rev enues
Estimated Loss of Act 1 54 / Foreign Company Tax Rev enues
1 ,924
–
27 2
6
Ex cise Tax es on Alcoholic Bev erages
7
Motor V ehicle Ex cise Tax es
293
294
294
294
294
294
294
294
8
Ex cise Tax es on Off-Shore Shipments Rum
General Fund Portion of 1 1 .5% SUT
206
1 68
17 0
17 1
17 2
17 4
17 5
17 6
294
17 8
1 ,608
1 ,586
1 ,557
1 ,525
1 ,491
1 ,456
1 ,420
1 ,384
1 ,348
1 ,31 0
117
117
117
117
117
117
117
117
117
118
18
18
18
18
18
18
18
18
18
18
586
90
9
10
11
Cigarette Ex cise Tax es
Casino Slot Rev enues
12
Lotteries
80
386
7 87
13
Other General Fund Tax Rev enues
117
112
112
112
112
112
112
112
112
113
566
1 ,1 28
Other General Fund Non-Tax Rev enues
17 1
17 2
17 2
17 2
17 1
17 1
17 1
17 1
17 1
17 2
14
15
65
General Fund Revenues (incl. Act 1 54 / Excise Tax Losses)
9,045
80
80
80
80
80
80
80
80
8,564
8,056
8,024
7 ,989
7 ,954
7 ,91 8
7 ,884
7 ,853
7 ,825
857
41 ,67 8
1 ,7 1 4
81 ,1 1 1
8,694
Additional Sales and Use Tax ("SUT")
16
COFINA Portion of 6% SUT
7 24
7 53
7 83
81 5
847
881
91 6
953
991
1 ,031
3,922
17
Portion of 1 1 .5% SUT - FAM
117
117
117
117
117
117
117
117
117
117
585
18
Portion of 1 1 .5% SUT - Cine
19
3
844
Additional Sales and Use Tax ("SUT")
3
87 3
3
904
3
935
3
967
3
1 ,001
3
1 ,036
3
1 ,07 3
3
1 ,1 1 1
3
1 ,1 51
1 ,1 7 1
16
4,523
32
9,897
Other Tax Revenues
59
59
59
59
59
59
59
59
59
59
295
590
17 4
1 36
1 37
1 38
1 39
1 40
1 41
1 42
1 43
1 44
7 24
1 ,436
20
Non-Resident Withholdings (Special Rev enue Fund)
21
Ex cise Tax es on Off-Shore Shipments Rum (Special Rev enue Fund)
22
Room Tax es
77
81
85
88
88
88
88
88
88
88
41 9
858
23
Cigarette Ex cise Tax es (Special Rev enue Fund)
67
67
67
67
67
67
67
67
67
67
337
67 4
24
Petroleum Products (Crudita) Ex cise Tax
Gas Oil and Diesel Ex cise Tax es
41 1
51 0
51 0
51 0
51 0
51 0
51 0
51 0
51 0
51 0
25
13
13
13
13
13
12
12
11
11
11
2,451
63
5,001
119
26
Gasoline Ex cise Tax Rev enue
1 51
1 46
1 45
1 46
1 48
1 43
1 39
1 34
1 29
1 26
7 36
1 ,407
27
V ehicle License Fees
93
93
93
93
93
93
93
93
93
93
463
927
28
Other Special Rev enue Fund Tax Rev enues
53
53
53
53
53
53
53
53
53
53
29
Casino Slot Rev enues
1 40
1 42
1 42
1 42
1 42
1 42
1 42
1 42
1 42
1 43
263
7 09
527
1 ,420
1 04
1 ,342
1 04
1 ,404
1 04
1 ,407
1 04
1 ,41 3
1 04
1 ,41 6
1 04
1 ,41 2
1 04
1 ,407
1 04
1 ,403
1 04
1 ,400
1 04
1 ,398
521
6,982
1 ,042
1 4,002
30
31
32
CRIM Property Tax Inflows
Other Tax Revenues
Other Non-Tax Revenues
Lotteries - Munis & Other
33
HTA Non-Tax Rev enues (ex . Teodoro Moscoso)
34
Teodoro Moscoso Bridge Rev enues
35
PRIDCO Rent and Other Non-Tax Rev enues
36
UPR Tuition, Fees and Other Non-Tax Rev enues
37
PRCCDA Rent and Other Non-Tax Rev enues
38
Net Income of Select Component Units (2)
39
40
41
42
43
44
45
(1 )
Other Non-Tax Revenues
T otal Adjusted Rev enue before Measures pre-ACA Funding Loss
GDB Loan Inflows
Federal Transfers
T otal Rev enues before Measures pre-ACA Funding Loss
Loss of Affordable Care Act ("ACA") Funding
T otal Rev enues before Measures post-ACA Funding Loss
(1)
(2)
38
46
48
50
56
56
55
55
55
62
239
522
240
245
249
252
252
252
252
252
252
253
1 ,238
2,500
1 20
–
–
–
–
20
20
20
20
20
20
20
67
67
69
71
71
71
71
71
71
71
344
699
1 69
17 1
17 4
17 6
17 8
1 80
1 83
1 85
1 88
1 90
868
1 ,7 95
4
80
4
80
4
80
4
80
4
80
4
80
4
80
4
80
4
80
4
80
20
399
40
7 99
598
61 2
623
633
661
663
665
667
67 0
680
3,1 28
6,47 4
$11,829
$11,454
$10,990
$11,005
$11,033
$11,029
$11,027
$11,028
$11,034
$11,055
$56,312
$111,484
236
233
233
21 1
1 86
1 83
1 81
1 81
17 8
17 6
1 ,098
1 ,998
7 ,000
7 ,1 1 4
7 ,226
7 ,337
7 ,448
7 ,561
7 ,67 6
7 ,7 94
7 ,91 7
8,046
36,1 24
7 5,1 1 8
$19,065
$18,801
$18,448
$18,553
$18,7 7 3
$18,884
$19,003
$19,128
$19,27 6
$93,534
$188,599
–
$19,065
(865)
$17 ,935
(1 ,51 7 )
$16,931
(1 ,583)
$16,97 0
$18,667
(1 ,681 )
$16,986
(1 ,835)
$16,939
(1 ,954)
$16,930
(2,07 0)
$16,933
(2,253)
$16,87 6
(2,384)
$16,893
(5,646)
$87 ,888
(1 6,1 41 )
$17 2,458
Excludes Federal Grants.
Represents the net income estimates of entities without bonded debt that have historically provided a surplus. Net numbers are shown as these entities generally receive independent revenues that would not be generated
absent the associated expenses. Note that numbers are shown excluding capital expenditures, which are shown elsewhere and forward estimates are based on a review of historical results.
98
Summary Page - Expenses
The following table presents a detailed summary of non-interest expenditures included in the
Fiscal Plan Base Projections
T otal
2017 P
2018P
2019P
2020P
2021P
2022P
2023P
2024P
2025P
2026P
5 Yr
10 Y r
Non-Debt Ex penditure before Measures
General Fund Expenses (ex. AUC /AAC and Debt Service)
44
Direct Pay roll
($3,27 1 )
($3,333)
($3,394)
($3,455)
($3,51 6)
($3,57 8)
($3,642)
($3,7 07 )
($3,7 7 5)
($3,847 )
($1 6,969)
45
Direct Operational Ex penses
(907 )
(924)
(941 )
(958)
(97 5)
(992)
(1 ,01 0)
(1 ,028)
(1 ,047 )
(1 ,066)
(4,7 05)
(9,848)
46
Utilities
(260)
(332)
(352)
(360)
(37 4)
(37 3)
(37 0)
(37 5)
(388)
(396)
(1 ,67 8)
(3,580)
47
Special Appropriations - UPR Formula
(7 91 )
(836)
(836)
(836)
(836)
(836)
(836)
(836)
(836)
(848)
(4,1 36)
(8,329)
48
Special Appropriations - Judicial Formula
(324)
(366)
(366)
(366)
(366)
(366)
(366)
(366)
(366)
(366)
(1 ,7 89)
(3,61 9)
49
Special Appropriations - Municipalities Formula
(361 )
(37 1 )
(37 1 )
(37 1 )
(37 1 )
(37 1 )
(37 1 )
(37 1 )
(37 1 )
(37 1 )
(1 ,845)
(3,7 01 )
50
Special Appropriations - Retirement Sy stems
(37 1 )
(424)
(480)
(536)
(543)
(535)
(529)
(595)
(593)
(587 )
(2,354)
(5,1 93)
51
Special Appropriations - Health Insurance
(885)
(885)
(885)
(885)
(885)
(885)
(885)
(885)
(885)
(885)
(4,425)
(8,850)
52
Special Appropriations - Other
(932)
(8,1 02)
(984)
(8,456)
(97 2)
(8,597 )
(926)
(8,694)
(1 ,021 )
(8,888)
(950)
(8,887 )
(962)
(8,97 1 )
(964)
(9,1 28)
(1 ,093)
(9,355)
(987 )
(9,354)
(642)
(642)
(57 2)
(57 2)
(1 ,1 7 2)
(1 ,1 7 2)
(1 ,1 7 2)
(1 ,1 7 2)
(1 ,1 7 2)
(1 ,1 7 2)
(1 ,1 7 2)
(1 ,1 7 2)
(1 ,1 7 2)
(1 ,1 7 2)
(1 ,1 7 2)
(1 ,1 7 2)
(1 ,1 7 2)
(1 ,1 7 2)
(1 ,1 7 2)
(1 ,1 7 2)
(283)
(283)
(400)
(400)
(407 )
(407 )
(41 5)
(41 5)
(422)
(422)
(429)
(429)
(437 )
(437 )
(445)
(445)
(453)
(453)
(462)
(462)
(1 09)
(5)
(1 04)
(1 7 5)
(204)
(3)
(6)
(246)
–
(1 1 8)
(5)
(1 05)
(1 37 )
(1 7 1 )
(3)
(6)
(234)
–
(1 29)
(5)
(1 06)
(1 43)
(21 3)
(3)
(7 )
(236)
–
(1 40)
(5)
(1 06)
(1 51 )
(331 )
(3)
(7 )
(238)
–
(1 51 )
(5)
(1 07 )
(1 7 3)
(402)
(3)
(7 )
(237 )
(4)
(1 62)
(5)
(1 08)
(1 95)
(504)
(3)
(8)
(241 )
(4)
(1 7 4)
(5)
(1 09)
(21 8)
(595)
(3)
(8)
(246)
(4)
(1 85)
(5)
(1 1 0)
(242)
(683)
(3)
(8)
(250)
(4)
(1 97 )
(5)
(1 1 1 )
(266)
(81 1 )
(3)
(9)
(255)
(5)
(209)
(5)
(1 1 2)
(280)
(908)
(3)
(9)
(259)
(5)
(3)
(855)
(3)
(7 81 )
(3)
(845)
(3)
(984)
(3)
(1 ,092)
(3)
(1 ,234)
(3)
(1 ,365)
(3)
(1 ,494)
(3)
(1 ,664)
(3)
(1 ,7 93)
(1 7 5)
(1 37 )
(1 38)
(1 39)
(1 40)
(1 41 )
(1 42)
(1 43)
(1 44)
(1 45)
(7 29)
(38)
(46)
(48)
(50)
(56)
(56)
(55)
(55)
(55)
(62)
(239)
(522)
(1 1 7 )
(330)
(1 1 7 )
(300)
(1 1 7 )
(304)
(1 1 7 )
(307 )
(1 1 7 )
(31 3)
(1 1 7 )
(31 4)
(1 1 7 )
(31 5)
(1 1 7 )
(31 6)
(1 1 7 )
(31 7 )
(1 1 7 )
(325)
(585)
(1 ,1 7 1 )
(1 ,553)
(3,1 39)
($10,212)
($10,508)
($11,326)
($11,57 1)
($11,887 )
($12,036)
($12,260)
($12,554)
($12,960)
($13,105)
($55,504)
($118,419)
(236)
(7 ,000)
(200)
(405)
(27 7 )
(7 ,1 1 4)
(1 50)
–
(31 5)
(7 ,226)
(5)
–
(308)
(7 ,337 )
(5)
–
(1 86)
(7 ,448)
(5)
–
(1 1 3)
(7 ,561 )
(5)
–
(1 1 4)
(7 ,67 6)
–
–
(1 1 5)
(7 ,7 94)
–
–
(1 1 5)
(7 ,91 7 )
–
–
(1 1 6)
(8,046)
–
–
(1 ,322)
(36,1 24)
(365)
(405)
(1 ,895)
(7 5,1 1 8)
(37 0)
(405)
($18,052)
($18,049)
($18,87 2)
($19,221)
($19,526)
($19,7 15)
($20,049)
($20,463)
($20,992)
($21,267 )
($93,7 20)
($196,206)
53
General Fund Expenses (ex. AUC/AAC and Debt Service)
($35,51 9)
(4,836)
(42,7 37 )
(9,7 92)
(88,432)
AAC/AUC
54
55
AUC and AAC ex . Catch-Up Pay ments (1 )
AAC/AUC
(4,7 29)
(4,7 29)
(1 0,588)
(1 0,588)
Maintenance Capital Expenditures
56
57
Run-Rate Capital Ex penditures (ex cl. growth Capex )
Maintenance Capital Expenditures
(1 ,928)
(1 ,928)
(4,1 54)
(4,1 54)
Component Units, Non-GF Funds and Enterprise Funds
58
59
60
61
62
63
64
65
66
67
68
Net Deficit of Special Rev enue Funds ex . Tax Rev enues (2)
PRCCDA Ex penses
PRIDCO Ex penses
UPR Ex penses
Net Op. Deficit of Other Independently Projected Component Units ex . Tax Rev s. (3)
Net Deficit of Select Component Units ex . Tax Rev enues (4)
Net Deficit of Enterprise Funds (5)
HTA Operational Ex penses (ex cl. Debt Serv ice, T. Moscoso and Capex )
Teodoro Moscoso Ex penses (ex cl. Debt Serv ice and Capex )
Allocation of SUT to Cine
Component Units, Non-GF Funds and Enterprise Funds
(648)
(1 ,57 5)
(24)
(528)
(7 7 9)
(1 ,320)
(1 3)
(34)
(1 ,1 91 )
(4)
(1 6)
(49)
(1 ,07 9)
(1 ,980)
(4,820)
(26)
(7 6)
(2,442)
(26)
(32)
(4,557 )
(1 2,1 07 )
Disbursements of Tax Revenues to Entities Outside Plan
69
Cigarette and Rum Shipment Ex cise Tax Related Outflows
70
Lotteries Related Outflows - Munis & Other
71
Allocation of SUT to FAM
72
Disbursements of Tax Revenues to Entities Outside Plan
73
Adjusted Ex penses
74
75
76
77
78
GDB Loan and Net Deposit Outflows
Federal Programs
Federal Ov ersight Board Implemented by PROMESA
AUC Catch-Up Pay ments (6)
T otal Noninterest Ex penditures
(1)
(2)
(3)
(4)
(5)
(6)
(1 ,446)
Incremental contributions represent the Annual Additional Contributions (“AAC”) required to be paid to the Teachers and Judicial Retirement Systems and the Additional Uniform Contribution (“AUC”) required to be paid to the Employees Retirement System
based on estimates provided by the Commonwealth’s actuaries incorporating updated assumptions regarding items such as changes in the size of the active membership and future payroll assumptions consistent with the Fiscal Plan.
Deficit for Special Revenue Funds calculated after removing tax revenues, which are shown separately.
Certain component unit projections were developed by consulting with management including: ASEM, ASES, ADEA, Cardiovascular Center, PBA, PRITA, Ports Authority and Tourism Company.
Represents the net income estimates of entities without bonded debt that have historically resulted in a deficit. Note that numbers are shown excluding capital expenditures, which are shown elsewhere. Forward estimated based on review of historical results.
Includes Unemployment Insurance and 9-1-1 Services Governing Board. Excludes Drivers Insurance and Disability Insurance, which are restricted funds.
Catch-up payments are AUC or AAC payments due in 2014, 2015 and/or 2016 that were not paid by the General Fund but are assumed to be paid in 2017.
99
Summary Page – Financing Gap
The following table presents a detailed summary of the Base Financing Gap after debt service
and the financing gap after the measures identified in the Fiscal Plan
Note that no U.S. government action related to equitable healthcare treatment is assumed below
The incremental income from economic development below includes the potential benefits of a change in the Commonwealth’s real economic trajectory in the Base Projections
from negative 1.7% to an average of 0.1% growth, driven in part by $10 billion in new spending to promote stability and growth
T otal
2017 P
79
Financing Gap Pre-Debt Serv ice, Pre-Measures
Debt Serv ice Net of Ex isting Reserv es
Consolidated Interest
2018P
2019P
2020P
2021P
2022P
2023P
2024P
1,013
($114)
($1,941)
($2,251)
($2,540)
($2,7 7 7 )
($3,120)
($3,530)
2025P
2026P
5 Yr
10 Y r
($4,116)
($4,37 4)
($5,832)
($23,7 48)
(1)
(2,37 3)
(2,31 9)
(2,239)
(2,1 69)
(2,1 1 8)
(2,062)
(2,025)
(1 ,97 4)
(1 ,97 2)
(1 ,91 0)
(1 1 ,21 7 )
(21 ,1 60)
81
Consolidated Principal
(1 ,094)
(957 )
(1 ,628)
(1 ,299)
(1 ,31 5)
(1 ,1 30)
(1 ,1 09)
(1 ,57 5)
(1 ,07 8)
(1 ,394)
(6,294)
(1 2,57 9)
82
Missed Principal and Interest Pay ments
(1 ,37 5)
–
–
–
–
–
–
(1 ,37 5)
(1 ,37 5)
83
TDF Guaranteed Debt Serv ice (2)
(1 55)
(37 )
(6)
(5)
(5)
(5)
(5)
(5)
(5)
(227 )
(251 )
84
Use of Ex isting Debt Serv ice Reserv es
37 9
19
–
–
–
–
–
–
–
–
398
398
(4,618)
(3,294)
(3,87 2)
(3,493)
(3,438)
(3,197 )
(3,138)
(3,554)
(3,055)
(3,308)
(18,7 15)
(34,967 )
(3,605)
(3,408)
(5,813)
(5,7 44)
(5,97 8)
(5,97 4)
(6,258)
(7 ,084)
(7 ,17 1)
(7 ,682)
(24,547 )
(58,7 16)
(3)
(30)
(33)
(3)
–
(3)
(3)
–
(3)
(3)
–
(3)
(3)
–
(3)
(3)
–
(3)
(3)
–
(3)
(3)
–
(3)
(3)
–
(3)
(3)
–
(3)
(1 5)
(30)
(45)
(30)
(30)
(60)
80
85
86
T otal Debt Serv ice Net of Ex isting Reserv es
T otal Estim ated Financing Gap before Measures
–
–
–
(25)
Im prov e Budgetary Controls and Fiscal and Econom ic Decision-Making
87
88
89
Adopt Institute of Statistics / Planning Board Fiv e-Y ear Plan
Install New Accounting and Financial Sy stems
T otal Meas. Aim ed at Im prov e Budg. Controls and Decision-Making
Rationalize Ex penditures and T ax Policy to Prom ote Efficiency
Ex pense Measures
Reduce Operating Costs
90
Achiev e Operational Efficiencies
–
36
41
42
44
45
1 48
37 1
91
Establish Centralized Procurement Sy stem
–
60
80
1 20
1 20
1 22
1 24
1 27
1 29
1 31
380
1 ,01 3
92
Employ ee Attrition (incl. Department of Education)
–
1 31
1 55
225
229
233
237
242
246
251
7 40
1 ,949
93
94
Ex tend Law 66 / Implement Long-Term Budgetary Reform
Reduce Operating Costs
–
–
28
17 8
397
257
528
336
7 23
41 6
807
43
400
7 98
384
7 90
368
7 81
45
353
773
46
338
7 66
1 ,1 87
3,030
2,455
6,364
Right-Size Department of Education
95
Ex ecute School Consolidation Plan
96
Ov erhaul School-Based Management and Operations
97
Right-Size Department of Education
–
–
–
28
14
42
57
14
71
85
14
99
113
14
1 27
115
14
1 29
117
15
1 31
119
1 21
1 23
15
15
15
1 34
1 36
1 39
283
56
339
87 8
1 30
1 ,008
Control Healthcare Costs
98
Implement Functional P3s at State Hospitals
(2)
12
24
24
24
24
25
25
26
26
82
99
Integrate Gov ernment Hospitals into Single Organization
(2)
10
19
19
19
19
20
20
20
21
65
8
15
15
15
15
16
16
16
16
53
1 32
–
30
30
30
30
31
31
32
32
33
1 20
27 8
–
5
5
5
5
5
5
5
5
5
20
93
93
93
96
98
1 00
Implement STAR Ratings Sy stem and Scale Pay ments
–
1 01
Standardize Health Protocols and Impose Uniform Fee Schedules
Reduce Number of 330s as IPAs Under Mi Salud
1 02
1 03
Control Healthcare Costs
(4)
65
95
1 00
1 02
340
209
1 65
46
830
Cut Governmental Subsidies
1 04
Reduce Subsidies to Municipalities
1 05
Modify Special Laws Benefits
1 06
Cut Governmental Subsidies
–
–
–
–
47
47
50
46
96
1 00
45
1 45
200
44
300
43
300
42
300
41
300
40
300
39
244
343
342
341
340
339
67
67
350
1 82
532
1 ,850
387
2,237
Rev enues Measures
1 06
Implement and Enforce Tax Policy
1 07
Lev erage Tech and Training to Incr. Capture Rates and Improv e Tax Admin
10
41
56
65
67
67
67
67
239
1 08
Restrict Use of Tax Amnesties and Closings
–
25
25
25
25
25
25
25
25
25
1 00
1 09
Implement and Enforce Tax on V ideo Lottery Games
–
55
70
81
77
75
72
69
66
64
283
629
110
Address Upcoming Act 1 54 Rev enue Cliff
–
481
962
962
962
962
962
962
962
962
3,367
8,1 7 7
111
111
Implement and Enforce Tax Policy
T otal Measures Aim ed at Rationalizing Ex penditures and T ax Policy
57 4
225
10
602
1 ,1 1 3
1 ,1 33
1 ,1 31
1 ,1 29
1 ,1 25
1 ,1 23
1 ,1 20
1 ,1 1 8
3,989
9,605
6
1,153
1,901
2,192
2,403
2,494
2,485
2,47 7
2,47 0
2,464
7 ,655
20,044
Enact Stuctural Econom ic Measures and Inv est in Growth
112
Establish a Local EITC Program
113
114
115
Pay Local Businesses for Past Serv ices and Pay Tax Refunds
Build Deposits to Prov ide Confidence
Inv est in Incremental Maintenance Capex ov er Run-Rate
116
Inv est in Economic Growth Projects
117
T otal Measures Aim ed at Enacting Structural Reform and Growth
118
119
Protect Vulnerable Stakeholders
Implement Pension Sy stem Reform
T otal Measures Aim ed at Protecting Vulnerable Stakeholders
1 20
T otal Measures Im pact
1 21
Residual Est. Financing Gap after Measures ex . Growth
1 22
1 23
Est. Incremental Income from Econ. Dev . and Structural Reforms
Residual Est. Financing Gap after Measures incl. Growth
(1)
(2)
–
(565)
(21 4)
(1 41 )
(1 50)
(1 50)
(1 50)
(1 50)
(1 50)
(1 50)
(1 50)
(1 50)
(1 50)
(600)
(1 ,350)
(27 2)
(21 4)
(528)
(27 2)
(21 4)
(397 )
(27 2)
(21 4)
(27 3)
(27 2)
(21 4)
(1 03)
–
–
(1 04)
–
–
(1 06)
–
–
(1 08)
–
–
(1 1 0)
–
–
(1 1 2)
(1 ,653)
(1 ,069)
(1 ,442)
(1 ,653)
(1 ,069)
(1 ,983)
(54)
(400)
(466)
(47 6)
(353)
(31 6)
(1 87 )
(1 1 3)
(1 03)
(1 03)
(1 ,7 49)
(2,57 2)
(97 4)
(1,564)
(1,499)
(1,385)
(1,091)
(57 0)
(443)
(37 1)
(363)
(366)
(6,514)
(8,627 )
(1 66)
(166)
(1 66)
(166)
(1 1 6)
(116)
(1 1 6)
(116)
(1 1 6)
(116)
(1 1 6)
(116)
(1 1 6)
(116)
(1 1 6)
(116)
(1 1 6)
(116)
(1 1 6)
(116)
(681 )
(681)
(1 ,263)
(1,263)
($1,167 )
($581)
($4,7 7 2)
($3,988)
($5,530)
–
202
$283
340
($4,7 7 2)
($3,7 86)
($5,190)
$687
($5,056)
501
($4,556)
$1,193
$1,804
$1,922
$1,987
$1,987
$1,97 9
($4,7 85)
($4,169)
($4,335)
($5,097 )
($5,184)
($5,7 03)
7 18
939
1 ,1 85
1 ,61 2
1 ,7 82
($4,068)
($3,231)
($3,57 2)
($3,921)
($3,150)
1 ,427
($3,67 0)
$415
($24,132)
1 ,7 61
($22,37 1)
$10,094
($48,621)
8,7 07
($39,914)
The debt service payment schedule is based in part on publicly available information from the GDB website and Bloomberg as well as information provided by Hacienda and GDB. All parties should consult the relevant
governing debt documents to determine their own views as to the debt service obligations for the debt shown below. Note that, as in the Krueger Report, the following debt service payment schedule only summarizes bonded
debt service for the entities included in the Fiscal Plan (with the exception of the 2013B GDB notes and GSA lines, both of which are private lending arrangements). Other debt service for private bank lines may be embedded in100
the projections for certain component units and public corporations. Such amounts are not material.
Includes debt service of certain TDF guaranteed bonds and loans.
Special Revenue Funds, Enterprise Funds and Component Units – FY 2017
The following provides a breakdown of the Base Expenses line item consisting of special
revenue funds, enterprise funds and component units
Note that the amounts shown below represent costs to the Commonwealth outside of any General Fund appropriations
and exclude costs associated with debt service, capital expenditures and AAC/AUC (where applicable), which are shown
elsewhere in the Fiscal Plan
FY 2017 Fiscal Plan Base Expenses ($ millions)
FY 2017
Special Rev enue Funds
Net Deficit of Special Rev . Funds ex . Tax Rev enues
Enterprise Funds
9-1 -1 Serv ices Gov erning Board
Unemploy ment Insurance Net Surplus / (Deficit)
Traditional Lottery Net Surplus / (Deficit)
Additional Lottery Net Surplus / (Deficit)
Subtotal
($1 09)
(6)
–
–
–
(6)
Component Units with Rev enues Presented Elsewhere
PRCCDA Ex penses
PRIDCO Ex penses
UPR Ex penses
HTA Operating Ex penses
Allocation of SUT to Cine
Subtotal
(5)
(1 04)
(1 7 5)
(246)
(3)
(533)
Component Units Presented on a Net Basis
ASEM Net Deficit
ASES Net Deficit pre-ACA Loss (Outside GF Appropriations)
ADEA Net Deficit
Cardiov ascular Center Net Deficit
PBA Net Surplus (Outside GF Appropriations)
PRITA Net Deficit ex . Cigarette Tax Rev enues
Puerto Rico Ports Authority Net Surplus
Tourism Company Net Deficit ex . Tax Rev enues
Net Deficit of Select Nonmajor Comp. Units ex . Tax Rev s.
Subtotal
(1 1 )
(38)
(4)
(4)
38
(7 5)
7
(1 1 7 )
(3)
(206)
Special Rev . Funds, Enterprise Funds, Com p. Units
Note that Tourism Company’s net deficit
figure shown here excludes certain slot
machine and room tax revenues shown
elsewhere in the Fiscal Plan
($855)
101
Appendix C –
Additional Liquidity Details
102
The Historical TSA Liquidity Trends Reflect the Impact of the Historical Deficits;
Stretching of AP Has Been a Major Source of Financing in the Past Three Years
Key Variance Explanations
Historical Liquidity Trends
Actual
Actual
Actual
FY 2013
FY 2014
FY 2015
FY 2016
FY 2014
General Collections
9,355
9,663
9,668
8,572
308
5
Federal Funds
3,223
3,253
3,524
3,573
30
272
Retirement System Transfers
1,140
1,260
1,358
1,330
120
98
543
641
630
1,560
99
(11)
555
424
500
555
(131)
364
336
209
95
(28)
($ in millions)
Favorable / (Unfavorable)
FY 2015
Non-debt related inflows
Change vs. Prior Year
Actual
FY 2016
•
General collections unfavorable trend due to
repealing Patente Nacional, ceasing tax amnesty
programs, decrease in employment and population
•
FY 2016 includes an increase of approximately
$930 million in sales and use tax primarily
attributable to the rate increase of 6.0% to 10.5%
(net of 1% for municipalities) in July 2015 and B2B
tax of 4% in October 2015
Operating Inflows
Inflows:
Sales and Use Tax
Excise Tax
-
Rum Tax and Other
Lotteries
Total
269
142
128
185
137
14,671
15,864
16,126
15,881
(4,069)
(3,853)
(3,632)
(14)
(1,096)
48
(27)
929
76
(127)
58
(48)
1,193
262
(245)
(3,574)
215
221
58
466
444
Outflows:
Operating Outflows
Payroll-Related
Suppliers, Welfare and Operating
Expenses (a)
(4,836)
(4,646)
(4,180)
(3,736)
189
ASES
(2,023)
(2,047)
(2,595)
(2,669)
(24)
(548)
(74)
Pension Benefits
(1,831)
(1,991)
(2,024)
(2,040)
(160)
(33)
(16)
University of Puerto Rico
(825)
(896)
(860)
(890)
(70)
36
Tax Refunds
(684)
(978)
(768)
(615)
(294)
210
CRIM
(414)
(345)
(359)
(460)
PBA
(205)
(344)
(317)
(329)
(140)
27
HTA
(289)
(501)
(548)
(303)
(213)
(47)
Traditional Lottery
(282)
(226)
(206)
(191)
56
21
Compulsory Insurance
(196)
(120)
(118)
(103)
76
3
15
Other
(128)
(126)
(125)
(186)
2
2
(61)
(15,782)
(16,076)
(15,730)
(15,096)
(1,111)
(211)
Total
Non-Debt Net
Cash
Flows
Operating
Cash
Flow
Debt Related Inflows
Debt Related Outflows (b)
Debt Related Cash Flow (c)
396
785
69
(14)
(30)
152
(12)
245
(294)
345
634
899
607
389
7,292
2,624
1,050
3,207
(4,668)
(1,574)
(7,028)
(3,188)
(1,501)
(3,876)
3,840
1,687
(563)
(451)
(669)
(828)
113
Moratorium Related Inflows
-
-
-
340
-
-
340
Moratorium Related Outflows
-
-
-
(443)
-
-
(443)
Moratorium Related Cash Flow
-
-
-
(103)
-
-
(103)
Net Cash Flow
perating Expenses (a)
(178)
53
(168)
231
Beginning Cash Balance
305
128
181
13
Ending Cash Balance
128
181
13
244
a)
b)
c)
Payroll and related costs have been reduced
through attrition
•
Pension benefits have increase in part because of
early retirement programs
•
Income tax refunds have seen reductions due to
delay of payment and elimination of the earned
income tax credit and reduction of senior citizen tax
credit
•
Supplier payments have declined due to deferral of
payments to maintain liquidity
15
4,085
264
•
(102)
(3,152)
933
Non-debt related outflows have declined in recent
years
231
(221)
398
53
(168)
231
For comparison purposes, the line items in ASEM, legislative assignments and suppliers have been included in suppliers and other.
Includes approximately $251 million of outflows of funds impaired at GDB that are reflected as an outflow for presentation purposes.
Debt service related includes receipts and disbursements of 2014 G.O. issuance, which was receipts were used for debt refinancing purposes.
The increase outflows to ASES are partially offset by
ACA federal funds receipts
Debt related inflows experienced significant decrease
due to lack of market access
103
TSA Liquidity – Fiscal 2016 to Fiscal 2017 Variance
($ in millions)
1
General Collections
2
Clawback/Moratorium Rev. (Ex. PRIFA Rum)
3
Sales and Use Tax
4
Excise Tax
5
Retirement System Transfers
6
Electronic Lottery
7
Traditional Lottery
8
CRIM
9
Rum Tax
FY 2016 Actual
$8,572
FY 2017 Proj.
($375)
340
290
(51)
1,560
1,634
75
500
579
78
1,130
893
(237)
137
138
1
51
–
(51)
103
–
(103)
208
203
(5)
3,573
3,516
(57)
276
40
(236)
1
–
(1)
13 Tax Revenue Anticipation Notes
400
400
–
14 Clawback Acct. Transfers
164
–
(164)
10 Federal Funds
11 Other Income/Agency LOCs
12 Tax Credits
15 Other
107
–
(107)
16 TOTAL INFLOWS
$17,122
$15,890
($1,233)
17 Payroll-Related
($3,574)
($3,619)
($45)
(2,040)
(2,065)
(25)
19 University of Puerto Rico
(890)
(872)
17
20 GDB Transactions /AAFAF
(62)
(207)
(145)
21 Tax Revenue Anticipation Notes
(741)
(423)
318
22 G.O. Debt Service
(346)
–
346
23 ASES
(2,669)
(2,662)
6
24 ACAA
(78)
(78)
–
25 HTA
(303)
(348)
(46)
26 PRIFA BANs
(42)
(18)
25
27 PRITA/AMA
(66)
(71)
(5)
28 Lottery
(242)
(16)
226
29 Compulsory Insurance
(103)
(98)
5
30 CRIM
(460)
(428)
32
18 Pension Benefits
31 Suppliers
(3,021)
(3,474)
(453)
32 Legislative Assignments
(595)
(645)
(50)
33 Tax Refunds
(615)
(672)
(56)
34 PBA
(329)
(162)
167
35 PRIDCO
(25)
(60)
(35)
36 ASEM
(95)
(122)
(26)
37 Other - Law 105 & Cigarettes
(45)
(24)
21
38 Transfers to Clawback Acct.
(443)
–
443
39 Transfers to TRS Trust Acct.
(57)
–
57
40 Loss of Funds Trapped at GDB
(51)
–
51
($16,892)
($16,063)
$829
$231
($174)
($404)
41 TOTAL OUTFLOWS
42 NET CASH FLOW
Key Takeaways
Variance - B/(W)
$8,197
FY 2017 cash flow scenario does not include payment of
debt service or repayment of pledged/clawback revenues
Net cash flow during fiscal 2017 is $404 million lower than during fiscal 2016
Significant drivers of reduced inflows:
• General collections – declined due to non-recurring revenue and
economic factors
• Retirement system transfers based on discussion with ERS and TRS are
forecasted to be lower than fiscal 2016
• Traditional lottery setup an independent treasury
• CRIM – funds are deposited in a separate bank account, receipts are
pledged for General Obligation Bonds
• Other income/agency LOC’s – reduced due to very limited liquidity at
GDB
• Clawback Acct. Transfers – not applicable for fiscal 2017
• Other – Fiscal 2016 received separate inflows related to pay Act 105
expenses, these expenses are included in the General Fund for fiscal 2017
Significant drivers of reduced outflows:
• Tax revenue anticipation notes – fiscal 2016 outflows included $300
million related to fiscal 2015
• GO debt service – not included in the General Fund budget and related to
the Moratorium Act
• Lottery – offset by a decrease in inflows due to independent treasury
• PBA – related to the Moratorium Act
• Transfers to Clawback Account – not applicable for fiscal 2017
• The reduction in outflows above is partially offset by higher outflows
from:
GDB/AAFAF – higher outflows related to increased General Fund
appropriations in fiscal 2017
Supplier payments – higher outflows to decrease accounts payable
104
TSA Liquidity – FY 2016 Clawbacks on Revenue
FY 2016 Clawback Revenues
Entity
Concept
PRIFA
Rum Tax
PRIFA
Petroleum Tax
PRMBA
Cigarette Tax
PRCCDA
Hotel Room Tax
PRHTA
Petroleum Tax
PRHTA
Gasoline/Diesel/Licenses
PRHTA
Petroleum Tax
PRHTA
Motor Vehicle Fines
PRHTA
Motor Vehicle Licenses
PRHTA
Cigarette Tax
Total Amount Transferred
Key Takeaways
Through
Dec '15
Jan. '16
– Jun. '16
$113,000
–
323
3,033
20,000
27,561
–
–
–
–
$163,917
–
12,826
4,674
9,100
60,000
86,369
53,638
29,117
21,814
11,662
$289,201
$113,000
12,826
4,997
12,134
80,000
113,930
53,638
29,117
21,814
11,662
$453,118
–
163,917
$163,917
143,199
–
307,116
–
–
$163,917
(163,917)
375
$143,574
(163,917)
375
$143,574
–
–
–
146,002
–
146,002
–
–
–
–
70
$146,072
–
70
$146,072
$ 163,917
$ 289,646
$ 289,646
Total
GDB - Account Reconciliation (1)
Beginning Balance
Transfers to Clawback Acct.
(Dec. 2015 - Mar. 2016)
Amount disbursed from Clawback Acct.
Interest Earned
Ending Balance
Executive Order 2015-046 authorized the
withholding (“Clawback”) of certain revenues
which were segregated into separate accounts
at both GDB and Banco Popular of Puerto Rico
(“BPPR”)
• Clawbacks on revenue from December
2015 were used to pay a portion of the
General Obligation bond payment in
January 2016
• Revenue clawbacks from January 2016
through June 2016 (including accrued
interest through September) remain in
segregated accounts at GDB or BPPR.
BPPR - Account Reconciliation
Beginning Balance
Transfers to Clawback Account
(Apr. 2016 - Jun. 2016)
Amount disbursed from Clawback Acct.
Interest Earned (2)
Ending Balance
Total Ending Balance
(1)
(2)
Deposits at GDB are subject to the
provisions of Act 21-2016 and GDB
liquidity. GDB is insolvent on a balance
sheet basis.
Deposits at GDB are subject to the provision of Act 21-2016 and Executive Orders.
Includes $55k of accrued interest from July to September.
105
TSA Cash Flow Projection Assumptions - FY 2017
The TSA cash flow projection is a cash management tool used by the Treasury Division of the
Department of the Treasury that incorporates certain assumptions and measures to maintain
a positive cash balance
FY 2017 estimated revenues(1) and approved budgeted appropriations. Inflows and outflows also include transactions from Special
Revenue funds and Fiduciary funds
The budget is produced on a budgetary basis of accounting and will vary from the TSA, which is on a cash basis
•
Slight timing variances on inflows
•
Significant timing variances on outflows due to a lag in payments to suppliers for goods and services
•
Prior year encumbrances and accounts payables
Special Revenue funds inflows and outflows are estimated by Treasury based on historical data, recent events and anticipated
changes for FY 2017(2)
Pension inflows are based on input from ERS/JRS and TRS, reduced by the appropriated AUC.(3) Pension outflows are based on
historical data and estimated changes for FY 2017
The monthly timing of inflows and outflows is based on historical data, outflows are adjusted to preserve a positive cash balance
during the projected period
Assumptions for the FY 2017 TSA cash flow projection include:
Retention of pledged revenues and General Fund appropriations from the TSA to certain public corporations for debt service
during the moratorium period (July 2016 through January 2017)
Managing accounts payable based on available cash
(1)
(2)
(3)
Revenue projections reflect the original projection of $9.1 billion reduced by $55 million for projected shortfalls in transfers from electronic and traditional lottery.
Special Revenue funds and special appropriations of the General Fund budget can be expended for up to three fiscal years, therefore current year disbursements may include appropriations made in
prior years.
Required AUC under statutory law is higher than budgeted amount.
106
Monthly FY 2017 Cash Flow Summary (Baseline Scenario)
The following represents a scenario of TSA cash flows for discussion purposes only, and that the Commonwealth
expressly reserves its rights with respect to the timing and amounts of debt service and other payments illustrated
herein
For the Month Ended
($ millions)
Beginning Cash Balance (Ex. Clawback Acct.)
7/31/16
8/31/16
9/30/16
10/31/16
11/30/16
12/31/16
1/31/17
2/28/17
3/31/17
4/30/17
5/31/17
6/30/17
($1,214)
($1,249)
($1,013)
($1,338)
12-Month
Ended
6/30/17
$244
$240
$102
$485
$318
$221
$184
$97
$244
$1,113
$1,059
$1,655
$1,204
$1,019
$1,268
$1,063
$1,252
$1,444
$1,821
$1,178
$1,524
39
42
42
42
42
42
42
–
–
–
–
–
290
$1,152
$1,101
$1,697
$1,246
$1,061
$1,310
$1,104
$1,252
$1,444
$1,821
$1,178
$1,524
$15,890
($1,156)
($1,239)
($1,314)
($1,413)
($1,158)
($1,347)
($1,191)
Receipts:
TSA Inflows (Ex. Withheld Pledged Revenues)
Withheld Pledged Revenues (Moratorium Related)
Total Inflows
$15,600
Disbursements:
TSA Outflows
($1,245)
($1,454)
($1,560)
($1,479)
($1,506)
($16,063)
2017 G.O. Debt Service (1)*
–
–
–
–
–
–
–
(369)
(1)
(1)
(1)
(755)
(1,128)
2017 Other Debt Service (1)(2)
–
–
–
–
–
–
–
(108)
–
–
–
(83)
(191)
2017 PBA Debt Service (1)(3)*
–
–
–
–
–
–
–
(185)
(23)
(23)
(23)
(23)
(277)
Payment of FY 2016 Unpaid Debt Service (4)
Total Outflows
–
–
$240
146
$386
–
–
(656)
–
($1,191)
($2,563)
($1,479)
$384
($167)
($97)
($37)
($87)
($1,311)
($35)
$102
$485
$318
$221
$184
$97
($1,214)
($1,249)
146
146
146
146
146
146
$248
$631
$464
$367
$330
$243
Memo - Baseline Liquidity After Repayment of Clawback and Retained Pledged Revenues:
Repayment of Retained Pledged Revenues (5)
–
–
–
–
Repayment of Clawback Revenues
–
–
–
–
Payment of 16'/17' PFC Debt Service
–
–
–
–
Payment of 16'/17' ASSMCA Debt Service
–
–
–
–
Ending Cash Balance (Ex. Clawback Acct.)
$240
$102
$485
$318
–
–
–
–
$221
–
–
–
–
$184
–
–
–
–
$97
Ending Cash Balance (Inc. Clawback Acct.)
($139)
–
($1,347)
Ending Cash Balance (Ex. Clawback Acct.)
($4)
($1,314)
–
($1,158)
Clawback Account Balance
($1,239)
–
($1,413)
Baseline Net Cash Flow Before Repayment of
Clawbacks and Retained Pledged Revenues
($1,156)
–
($1,214)
–
–
($1,585)
$236
($1,013)
–
–
–
(656)
($1,503)
($2,367)
($18,315)
($325)
($843)
($2,426)
($1,338)
($2,181)
($2,181)
–
–
–
($1,249)
($1,013)
($1,338)
($2,181)
($2,181)
(217)
–
(453)
–
(174)
(1)
(5)
–
($2,063) ($2,099)
–
–
(1)
–
($1,864)
–
–
(1)
–
($2,191)
–
–
(1)
–
($3,036)
(217)
(453)
(179)
(5)
($3,036)
(1) Includes payment of missed contractual FY 2017 debt service due is paid in February 2017 after lapse of moratorium related legislation then continued payment of contractual debt service thereafter as it becomes due.
(2) Other debt service includes PRIFA rum bonds, PRIFA petroleum products BANs, and General Services Administration debt.
(3) Includes payment of missed FY 2017 contractual debt service for debt held by the Public Buildings Authority in Feb. 2017 after lapse of moratorium related legislation and continued payment of contractual debt service as it
becomes due.
(4) Figures do not consider any debt service reserves or “set-aside” funds that may have been released by trustee to partially satisfy owed payments. Includes missed G.O.,PBA (June set-aside), and PRIFA rum bond debt. Excludes
HTA, UPR and GDB debt service assumed to be paid from other sources. Missed G.O. debt service has been netted against projected available clawback funds in February 2017.
(5) Amount has been adjusted by the amount of Jul. '17 through Jan. '17 PRIFA petroleum products BANs debt service paid in February 2017.
* February amounts represent eight months of equal set-aside payments, amounts there after represent monthly set-aside amounts and not actual debt service due.
Notes:
a) For illustrative purposes, moratorium revenue retained by the TSA including revenues pledged for PRHTA Bonds, PRMBA Line of Credit and PRIFA BANs is projected to be repaid after the moratorium period expires on January
31, 2017.
b) For illustrative purposes, clawbackable revenue from FY 2016 related to PRHTA, PRCCDA, PRMBA, PRIFA Petroleum and PRIFA Rum tax is shown in this projection to be repaid after the moratorium period expires on January
31, 2017.
c) Debt service does not include accrued interest on unpaid amounts.
Note: Other Commonwealth liabilities that have been deferred for GDB appropriation debt, past-due contributions to pension systems (including catch-up payments for the Additional Uniform Contribution (AUC) and
Annual Additional Contribution (AAC) of $405 million and amounts for the unappropriated-portion of the FY 2017 AUC/AAC), third-party payables, tax refunds, intra-government payables, and others are not included in
the projections. Note that the AUC/AAC figures are subject to continued revision and refinement.
107
In FY 2017, the General Fund is Expected to Generate a Surplus of $278 million
on a Budgetary Basis*
Bridge to FY 2017 General Fund Revenue Estimate ($mm)
$48
$14
$63
$5
($116)
($70)
($75)
$9,175
Fiscal
2015-16
Prelim.
Actuals
$9,045
Credits
Impact
FY '16
(Non-Recur.
in FY '17)
Run-Rate
Adjustments
Increase of
SUT/B2B,
Net of COFINA
Other
Variances
Non-Recurring
Revenues
(Tax Amnesty,
Royalties and
Corporate
Income Taxes)
Credits for
Transfer Pricing
Collected
in FY '16
(e.g. Wal-Mart)
FY '17
Economic
Adjustment
(Planning Board)
Fiscal
2016-17
Projected
$278mm
Surplus
Bridge to FY 2017 General Fund Expenses (1) ($mm)
$260
$9,800
($43)
$25
$25
Direct
Payroll &
Operating
Expenses
ASEM
Subsidy
Social
Security
Contribution Uniformed
Police
$52
$35
$144
$182
$8,767
($1,712)
FY '16 GF
Approved
Budget
Debt
Related
Election
Year
Related
Expenses
Other
Special
Assign.
Retirement
Contributions
Act-105
Related
Expenses
GDB Deposit
Funding/
Expenses
Formerly
Funded
by GDB LOCs
FY '17
Approved
Budget
* Excludes working capital impacts (i.e., payment of prior year’s expenses)
(1)
FY 2017 budget is exclusive of budgetary reserve and emergency fund reserve.
108
TSA Cash Balances(1)(2) and Sequence of Emergency Measures
($ millions)
Cash advancements from
retirement systems
Cash
Intra-Government TRANs
advancements
issuance
from retirement
Repayment of TRANs
systems
deferred in June
PFC bonds are not
appropriated
Payment of debt service
$222
SIF dividend
Non-payment of
pledged monies to
PRIFA bonds
$371
Partial TRANs payment
completed
TRANs
payment Non-payment of
GDB debt
$14
$21
May-15
Jun-15
Jul-15
Receipt of credit
line from SIF
Non-payment of
TRANs
Reduction of
supplier payments
Deferral of payment
of pledged revenue
to Governmental
entity (“Crudita”)
(1)
(2)
Aug-15
Sep-15
$485
$318
$244
$234
$206
$240
$162
$102
$72
$20
Receipts from
TRANs
issuance
$358
$153
$136
$672
Oct-15
Nov-15
Dec-15
Jan-16
Feb-16
SIF Dividend
Intra-Government
TRANs issuance
Non-payment of
PFC bonds
Use of clawback
revenues for payment
of GO debt
Mar-16
Apr-16
May-16
Deposits trapped at
GDB
TRANs interest
payment
Revenue shortfall
Clawbacks
Jun-16
Jul-16
Aug-16
Sep-16 Oct-16P
Non-payment of GO
Debt Moratorium
Represents bank cash balances. Excludes clawbacks deposited into GDB from January to March 2016 totaling $144 million are subject to the provisions of Act 21 and subject to the limitations on the withdrawal of funds (EO
014-2016). Excludes $146 million of cash retained through “clawbacks” deposited at BPPR from April to June 2016, which is held in a separate bank account at BPPR
The end of month TSA cash balances presented are not adjusted by outstanding checks and deposits in transit, which if added result in negative book balance.
109
Appendix D –
Additional Detail on Debt Service
110
Introduction
The following slides provide summary information on the Commonwealth’s debt obligations in FY
2016 and year-to-date FY 2017
In assessing the information included herein, it is important to note:
• Fiscal Year 2016 debt service includes principal and interest payments due on July 1, 2016
Annual COFINA debt service shown herein corresponds to an August to July schedule, whereas the Fiscal
Plan shows COFINA debt service on a September to August schedule to align debt service with the revenues
collected to pay such debt service in the Commonwealth’s fiscal year
• Only bonded debt service is included herein; debt service related to loans, including amounts owed to GDB, is
not included(1)
• Debt service is shown on a cash basis when payments to bondholders actually come due, so the amounts shown
do not include amounts that otherwise would have been “set-aside” into deposit accounts or accruing interest
on capital appreciation (i.e., zero coupon) bonds that is not due and payable
Certain bonds are beneficiaries of federal subsidies (including, for example, those related to the Build
America Bonds program), cash that was set-aside at the time the bonds were issued (“capitalized interest”),
or cash that was set aside to “pre-refund” the bonds. Debt service shown herein is presented net of such
federal subsidies, capitalized interest, and pre-refunding amounts where applicable
• Amounts shown herein do not incorporate any default interest that may be due and payable
• Any payments made by insurers on account of missed payments by the Commonwealth are also not
incorporated
Note that interest and principal amounts due in FY 2017 are based on Commonwealth estimates and precise
payment amounts have not been confirmed by bond trustees for all issuers; in addition, where possible, current
reserve balances are based on information provided by the bond trustees, but such information has not been
confirmed in all cases
• The Commonwealth is not directly responsible for maintaining the reserve accounts shown nor making direct
payments to bondholders; the Commonwealth expects to update the information contained herein regularly for
the Oversight Board. While the Commonwealth relies on account information provided by third-parties, to the
extent new information becomes available from the trustees it will be included in future submissions
(1)
For example, the amount shown herein exclude Port of the Americas (“POA” or “APLA”) bonds, GO Notes, and GSA loans.
111
Pre-Decisional | Privileged & Confidential Draft | Analysis Prepared at the Request of Counsel & Subject to Material Change
FY 2016 Debt Service
The following provides a summary of the debt service due, paid, and missed in FY 2016
FY 2016 Debt Service Due, Paid and Missed ($ millions)
FY 2016 Interest
Debt Included in Fiscal Plan
GO
GDB(2)
GDB (CW-Guaranteed)
PBA (ex . Series L)
PBA - Series L
PFC
COFINA
PRIFA - Rum
PRIFA - Port
PRIFA - ASSMCA (Mental Health)
UPR
PRCCDA
PRIDCO
PRIFA BANs
HTA - 1 968 Resolution
HTA - 1 998 Resolution, Senior (3)
HTA - 1 998 Resolution, Sub Series 1 998 (4)
HTA - 1 998 Resolution, Sub Series 2003
Teodoro Moscoso Bridge (5)
ERS
AFICA - Univ ersity Plaza Project
T otal Debt Included in Fiscal Plan
FY 2016 Principal
Due
Paid
Missed
Due
$699
17 3
15
1 88
2
57
643
72
10
2
23
19
9
13
44
1 61
3
12
7
1 67
3
$2,323
$346
17 3
15
1 88
2
1
643
–
10
2
23
19
9
13
44
1 61
1
12
7
1 67
3
$1,840
$353
–
–
–
–
57
–
72
–
–
–
–
–
–
–
–
1
–
–
–
–
$483
$426
569
267
86
–
36
11
41
2
1
20
11
17
1 42
28
59
3
13
7
–
2
$1,7 41
–
209
267
61
–
–
11
–
2
1
20
11
17
1 42
28
59
–
13
7
–
2
$850
$426
360
–
25
–
36
–
41
–
–
–
–
–
–
–
–
3
–
–
–
–
$891
24
1
76
1 07
17
9
34
21
47
382
–
–
–
–
–
6
–
–
–
–
–
2
15
34
–
10
83
24
–
354
–
2
15
34
–
5
83
24
–
354
–
–
–
–
–
5
–
–
–
–
Additional Debt Not Shown in Fiscal Plan
HTA - VRDOs (1 998 Resolution)
AFICA - Guay nabo
PRASA - 2008 Series A&B, Senior
PRASA - 201 2 Series A&B, Senior
PRASA - 2008 Series A&B, Sub
PRASA - Rural Dev elopment (6)
MFA (7 )
HFA (8)
CTF
PREPA
24
1
76
1 07
17
16
34
21
47
382
Paid
FY 2016 T otal Debt Serv ice
Missed
Due
Paid
Missed
$1 ,1 25
7 42
282
27 4
2
94
655
113
12
3
43
30
26
1 55
72
220
6
24
14
1 67
6
$4,064
$346
382
282
249
2
1
655
–
12
3
43
30
26
1 55
72
220
1
24
14
1 67
6
$2,690
$7 7 9
360
–
25
–
93
–
113
–
–
–
–
–
–
–
–
4
–
–
–
–
$1,37 5
24
2
91
1 40
17
25
117
46
47
7 36
24
2
91
1 40
17
14
117
46
47
7 36
–
–
–
–
–
11
–
–
–
–
Fis
See Appendix for footnotes.
112
Pre-Decisional | Privileged & Confidential Draft | Analysis Prepared at the Request of Counsel & Subject to Material Change
2017 Fiscal Year to Date – Interest
The following provides a summary of the estimated interest due to bondholders in August,
September and October 2016 (excluding required set-aside amounts), as well as the estimated
amounts paid and missed in that time period
FY 2017 YTD Interest Due, Paid and Missed ($ millions)
Fiscal Y T D Interest Due
Aug-16
Debt Included in Fiscal Plan
GO
GDB
GDB (CW-Guaranteed)
PBA (ex . Series L)
PBA - Series L
PFC
COFINA
PRIFA - Rum
PRIFA - Port
PRIFA - ASSMCA (Mental Health)
UPR
PRCCDA
PRIDCO
PRIFA BANs
HTA - 1 968 Resolution
HTA - 1 998 Resolution, Senior (2)
HTA - 1 998 Resolution, Sub Series 1 998
HTA - 1 998 Resolution, Sub Series 2003
Teodoro Moscoso Bridge (3)
ERS
AFICA - Univ ersity Plaza Project
T otal Debt Included in Fiscal Plan
Additional Debt Not Shown in Fiscal Plan
HTA - VRDOs (1 998 Resolution)
AFICA - Guay nabo
PRASA - 2008 Series A&B, Senior
PRASA - 201 2 Series A&B, Senior
PRASA - 2008 Series A&B, Sub
PRASA - Rural Dev elopment (4)
MFA (5)
HFA (6)
CTF
PREPA
(1)
(2)
(3)
Fiscal Y T D Interest Missed (1)
Fiscal Y T D Interest Paid
Sep-16
Oct-16
T otal
Aug-16
Sep-16
Oct-16
T otal
$1
27
1
–
–
22
240
–
–
–
–
–
1
1
–
0
–
–
1
14
–
$306
$1
9
1
–
–
1
16
–
–
–
–
–
1
0
–
0
–
–
1
14
–
$44
$1
9
1
3
–
1
16
–
–
1
–
–
1
0
–
0
–
–
1
14
–
$49
$4
46
2
3
–
24
27 3
–
–
1
–
–
2
1
–
0
–
–
2
42
–
$400
–
–
–
–
–
–
240
–
–
–
–
–
1
–
–
0
–
–
1
14
–
$255
–
–
–
–
–
–
16
–
–
–
–
–
1
–
–
0
–
–
1
14
–
$31
–
–
–
–
–
–
16
–
–
1
–
–
1
–
–
0
–
–
1
14
–
$33
–
–
–
–
–
–
27 3
–
–
1
–
–
2
–
–
0
–
–
2
42
–
$319
2
–
0
1
1
–
15
–
–
–
2
–
0
1
1
–
–
–
–
–
2
–
0
1
1
–
–
–
–
9
6
–
0
3
4
–
15
–
–
9
2
–
0
1
1
–
15
–
–
–
2
–
0
1
1
–
–
–
–
–
2
–
0
1
1
1
–
–
–
9
6
–
0
3
4
1
15
–
–
9
Total amount missed represents amounts not paid by the Commonwealth and has not been reduced by amounts paid by insurers, (4)
if any.
Amount shown does not include amounts associated with the 1998 Resolution Series A Variable Rate Demand Obligation
(“VRDO”) bonds, which are shown separately in the “Additional Debt Not Shown in Fiscal Plan” section, as these bonds are held (5)
by GDB and therefore eliminated in Fiscal Plan due to consolidation.
Teodoro Moscoso Bridge bonds shown here for illustrative purposes, as these bonds are included in the Fiscal Plan. The
(6)
concessionaire is currently responsible for the debt service payments.
Aug-16
Sep-16
Oct-16
T otal
$1
27
1
–
–
22
–
–
–
–
–
–
–
1
–
–
–
–
–
–
–
$51
$1
9
1
–
–
1
–
–
–
–
–
–
–
0
–
–
–
–
–
–
–
$13
$1
9
1
3
–
1
–
–
–
–
–
–
–
0
–
–
–
–
–
–
–
$16
$4
46
2
3
–
24
–
–
–
–
–
–
–
1
–
–
–
–
–
–
–
$81
–
–
–
–
–
–
–
–
–
–
–
–
–
–
–
–
–
–
–
–
–
–
–
–
–
–
–
–
–
–
–
–
–
–
–
–
–
–
–
–
The Rural Development Bonds have been subject to a forbearance agreement since July 1, 2016 and the amounts shown herein
reflect the forbearance of remedies in respect of debt service payments. Amounts shown as paid/missed per the trustee, which
remains subject to continued diligence with the trustee.
Amounts shown include 2002 Series A Bonds, 2005 Series A,B, & C bonds, and 1997 A bonds. Additional diligence regarding the
2005 Series A & C bonds remains ongoing with the trustee.
HFA amounts shown herein represent only the Capital Fund Bonds and do not include the Single Family Mortgage Revenue
Bonds and the Mortgage-Backed Certificates (diligence on these excluded bonds remains ongoing with the trustee).
113
Pre-Decisional | Privileged & Confidential Draft | Analysis Prepared at the Request of Counsel & Subject to Material Change
2017 Fiscal Year to Date – Principal
The following provides a summary of the estimated principal due to bondholders in August,
September and October 2016 (excluding required set-aside amounts), as well as the estimated
amounts paid and missed in that time period
FY 2017 YTD Principal Due, Paid and Missed ($ millions)
Fiscal Y T D Principal Due
Aug-16
Debt Included in Fiscal Plan
GO
GDB
GDB (CW-Guaranteed)
PBA (ex . Series L)(2)
PBA - Series L
PFC
COFINA
PRIFA - Rum
PRIFA - Port
PRIFA - ASSMCA (Mental Health)
UPR
PRCCDA
PRIDCO
PRIFA BANs
HTA - 1 968 Resolution
HTA - 1 998 Resolution, Senior (3)
HTA - 1 998 Resolution, Sub Series 1 998
HTA - 1 998 Resolution, Sub Series 2003
Teodoro Moscoso Bridge (4)
ERS
AFICA - Univ ersity Plaza Project
T otal Debt Included in Fiscal Plan
Additional Debt Not Shown in Fiscal Plan
HTA - VRDOs (1 998 Resolution)
AFICA - Guay nabo
PRASA - 2008 Series A&B, Senior
PRASA - 201 2 Series A&B, Senior
PRASA - 2008 Series A&B, Sub
PRASA - Rural Dev elopment (5)
MFA (6)
HFA (7 )
CTF
PREPA
(1)
(2)
(3)
(4)
Fiscal Y T D Principal Missed (1)
Fiscal Y T D Principal Paid
Sep-16
Oct-16
T otal
–
–
–
–
–
29
38
–
–
–
–
–
–
10
–
–
–
–
–
–
–
$7 8
–
–
–
–
–
–
–
–
–
–
–
–
–
10
–
–
–
–
–
–
–
$10
–
–
–
–
–
–
–
–
–
1
–
–
–
10
–
–
–
–
–
–
–
$11
–
–
–
–
–
29
38
–
–
1
–
–
–
30
–
–
–
–
–
–
–
$99
–
–
–
–
–
–
77
–
–
–
–
–
–
–
–
–
–
–
–
–
–
–
–
–
–
–
–
–
–
–
–
–
–
–
–
–
77
–
–
–
Aug-16
Sep-16
Oct-16
T otal
–
–
–
–
–
–
38
–
–
–
–
–
–
–
–
–
–
–
–
–
–
$38
–
–
–
–
–
–
–
–
–
–
–
–
–
–
–
–
–
–
–
–
–
–
–
–
–
–
–
–
–
–
–
1
–
–
–
–
–
–
–
–
–
–
–
$1
–
–
–
–
–
–
38
–
–
1
–
–
–
–
–
–
–
–
–
–
–
$39
–
–
–
–
–
–
77
–
–
–
–
–
–
–
–
–
–
–
–
–
–
–
–
–
–
–
–
–
–
–
–
–
–
–
–
–
77
–
–
–
Total amount missed represents amounts not paid by the Commonwealth and has not been reduced by amounts paid by insurers, (5)
if any.
Excludes mandatory redemption of $750k that took place in August.
Amount shown does not include amounts associated with the 1998 Resolution Series A Variable Rate Demand Obligation
(6)
(“VRDO”) bonds, which are shown separately in the “Additional Debt Not Shown in Fiscal Plan” section, as these bonds are held
by GDB and therefore eliminated in Fiscal Plan due to consolidation.
(7)
Teodoro Moscoso Bridge bonds shown here for illustrative purposes, as these bonds are included in the Fiscal Plan. The
concessionaire is currently responsible for the debt service payments.
Aug-16
Fis
Sep-16
Oct-16
T otal
–
–
–
–
–
29
–
–
–
–
–
–
–
10
–
–
–
–
–
–
–
$39
–
–
–
–
–
–
–
–
–
–
–
–
–
10
–
–
–
–
–
–
–
$10
–
–
–
–
–
–
–
–
–
–
–
–
–
10
–
–
–
–
–
–
–
$10
–
–
–
–
–
29
–
–
–
–
–
–
–
30
–
–
–
–
–
–
–
$60
–
–
–
–
–
–
–
–
–
–
–
–
–
–
–
–
–
–
–
–
–
–
–
–
–
–
–
–
–
–
–
–
–
–
–
–
–
–
–
–
The Rural Development Bonds have been subject to a forbearance agreement since July 1, 2016 and the amounts shown herein
reflect the forbearance of remedies in respect of debt service payments. Amounts shown as paid/missed per the trustee, which
remains subject to continued diligence with the trustee.
Amounts shown include 2002 Series A Bonds, 2005 Series A,B, & C bonds, and 1997 A bonds. Additional diligence regarding the114
2005 Series A & C bonds remains ongoing with the trustee.
HFA amounts shown herein represent only the Capital Fund Bonds and do not include the Single Family Mortgage Revenue Bonds
and the Mortgage-Backed Certificates (diligence on these excluded bonds remains ongoing with the trustee).
Pre-Decisional | Privileged & Confidential Draft | Analysis Prepared at the Request of Counsel & Subject to Material Change
2017 Fiscal Year to Date – Total Debt Service (P+I)
The following provides a summary of the estimated total debt service due to bondholders in August,
September and October 2016 (excluding required set-aside amounts), as well as the estimated
amounts paid and missed in that time period
FY 2017 YTD Total Debt Service Due, Paid and Missed ($ millions)
Fiscal Y T D T otal Debt Serv ice Due
Aug-16
Debt Included in Fiscal Plan
GO
GDB
GDB (CW-Guaranteed)
PBA (ex . Series L)(2)
PBA - Series L
PFC
COFINA
PRIFA - Rum
PRIFA - Port
PRIFA - ASSMCA (Mental Health)
UPR
PRCCDA
PRIDCO
PRIFA BANs
HTA - 1 968 Resolution
HTA - 1 998 Resolution, Senior (3)
HTA - 1 998 Resolution, Sub Series 1 998
HTA - 1 998 Resolution, Sub Series 2003
Teodoro Moscoso Bridge (4)
ERS
AFICA - Univ ersity Plaza Project
T otal Debt Included in Fiscal Plan
Additional Debt Not Shown in Fiscal Plan
HTA - VRDOs (1 998 Resolution)
AFICA - Guay nabo
PRASA - 2008 Series A&B, Senior
PRASA - 201 2 Series A&B, Senior
PRASA - 2008 Series A&B, Sub
PRASA - Rural Dev elopment (5)
MFA (6)
HFA (7 )
CTF
PREPA
(1)
(2)
(3)
(4)
Fiscal Y T D T otal Debt Serv ice Paid
Sep-16
Oct-16
T otal
Aug-16
Sep-16
Oct-16
T otal
$1
27
1
–
–
51
27 8
–
–
–
–
–
1
11
–
0
–
–
1
14
–
$384
$1
9
1
–
–
1
16
–
–
–
–
–
1
11
–
0
–
–
1
14
–
$54
$1
9
1
3
–
1
16
–
–
2
–
–
1
10
–
0
–
–
1
14
–
$60
$4
46
2
3
–
54
311
–
–
2
–
–
2
32
–
0
–
–
2
42
–
$498
–
–
–
–
–
–
27 8
–
–
–
–
–
1
–
–
0
–
–
1
14
–
$293
–
–
–
–
–
–
16
–
–
–
–
–
1
–
–
0
–
–
1
14
–
$31
–
–
–
–
–
–
16
–
–
2
–
–
1
–
–
0
–
–
1
14
–
$33
–
–
–
–
–
–
311
–
–
2
–
–
2
–
–
0
–
–
2
42
–
$358
2
–
0
1
1
–
92
–
–
–
2
–
0
1
1
–
–
–
–
–
2
–
0
1
1
–
–
–
–
9
6
–
0
3
4
–
92
–
–
9
2
–
0
1
1
–
92
–
–
–
2
–
0
1
1
–
–
–
–
–
2
–
0
1
1
1
–
–
–
9
6
–
0
3
4
1
92
–
–
9
Total amount missed represents amounts not paid by the Commonwealth and has not been reduced by amounts paid by insurers, (5)
if any.
Excludes mandatory redemption of $750k that took place in August.
Amount shown does not include amounts associated with the 1998 Resolution Series A Variable Rate Demand Obligation
(6)
(“VRDO”) bonds, which are shown separately in the “Additional Debt Not Shown in Fiscal Plan” section, as these bonds are held
by GDB and therefore eliminated in Fiscal Plan due to consolidation.
(7)
Teodoro Moscoso Bridge bonds shown here for illustrative purposes, as these bonds are included in the Fiscal Plan. The
concessionaire is currently responsible for the debt service payments.
Fiscal Y T D T otal Debt Serv ice Missed (1)
Aug-16
Sep-16
Oct-16
T otal
$1
27
1
–
–
51
–
–
–
–
–
–
–
11
–
–
–
–
–
–
–
$91
$1
9
1
–
–
1
–
–
–
–
–
–
–
11
–
–
–
–
–
–
–
$23
$1
9
1
3
–
1
–
–
–
–
–
–
–
10
–
–
–
–
–
–
–
$26
$4
46
2
3
–
54
–
–
–
–
–
–
–
32
–
–
–
–
–
–
–
$140
–
–
–
–
–
–
–
–
–
–
–
–
–
–
–
–
–
–
–
–
–
–
–
–
–
–
–
–
–
–
–
–
–
–
–
–
–
–
–
–
The Rural Development Bonds have been subject to a forbearance agreement since July 1, 2016 and the amounts shown herein
reflect the forbearance of remedies in respect of debt service payments. Amounts shown as paid/missed per the trustee, which
remains subject to continued diligence with the trustee.
Amounts shown include 2002 Series A Bonds, 2005 Series A,B, & C bonds, and 1997 A bonds. Additional diligence regarding the115
2005 Series A & C bonds remains ongoing with the trustee.
HFA amounts shown herein represent only the Capital Fund Bonds and do not include the Single Family Mortgage Revenue Bonds
and the Mortgage-Backed Certificates (diligence on these excluded bonds remains ongoing with the trustee).
Pre-Decisional | Privileged & Confidential Draft | Analysis Prepared at the Request of Counsel & Subject to Material Change
Fund Balances
The below summarizes the amounts currently available in debt service funds (“DSF”) and debt
service reserve funds (“DSRF”). All information shown herein as provided to the Commonwealth by
the trustees or fiscal agents as of the dates shown below and remains subject to continued
diligence and change
Debt Service Fund and Debt Service Reserve Fund Balances ($ millions)
Debt Service
Fund
("DSF")
PBA (excl. Series L) (1 )
PBA - Series L(2)
COFINA(3)
PRIFA - ASSMCA (Mental Health) (4)
PRIFA BANs(5)
UPR (6)
AFICA - University Plaza Project(7 )
AFICA - Guaynabo(8)
PRCCDA(9)
PRIDCO (1 0)
HTA - 1968 Resolution(1 1 )
HTA - 1998 Resolution, Senior(1 2)(1 3)
HTA - 1998 Resolution, Sub Series 2003(1 4)
HTA - 1998 Resolution, Sub Series 1998(1 5)(1 6)
ERS(1 7 )
MFA(1 8)
HFA(1 9)
CTF(20)
PRASA 2008 A&B, Senior(21)
PRASA 2012 A&B, Senior(21)
PRASA 2008 A&B, Sub(21)
PREPA(22)
$0
–
455
0
0
–
0
1
–
0
0
0
0
–
0
35
3
26
30
43
0
0
Debt Service
Reserve Fund
("DSRF")
–
6
–
2
–
55
7
3
18
20
64
105
8
15
86
76
33
84
93
–
–
6
Total
DSF/DSRF
Balance
$0
6
455
2
0
55
7
4
18
20
64
105
8
15
86
111
36
109
123
43
0
6
Balance
as of:
Trustee/Fiscal Agent
Oct 27, 2016
Oct 27, 2016
Oct 25, 2016
Oct 27, 2016
Oct 25, 2016
Oct 28, 2016
Oct 31, 2016
Oct 27, 2016
Oct 25, 2016
Oct 28, 2016
Oct 25, 2016
Oct 25, 2016
Oct 25, 2016
Oct 14, 2016
Oct 25, 2016
Oct 27-Nov 3, 2016
Oct 27, 2016
Oct 27, 2016
Oct 27, 2016
Oct 27, 2016
Oct 27, 2016
Oct 19, 2016
U.S. Bank
U.S. Bank
BONY
BPPR
BONY
U.S. Bank
BONY
BPPR
BONY
U.S. Bank
BONY
BONY
BONY
BONY /GDB
BONY
BPPR/BONY /U.S. Bank
U.S. Bank
U.S. Bank
BPPR
BPPR
BPPR
U.S. Bank
See Appendix for footnotes.
116
Pre-Decisional | Privileged & Confidential Draft | Analysis Prepared at the Request of Counsel & Subject to Material Change
Estimated Fund Balance Depletion
The following presents a summary of all bonded debt service for entities included in the
Fiscal Plan for FY 2017 as well as an estimate of the date of depletion of existing fund
balances that are available to make debt service payments
Estimated Date of First Missed Payment ($ millions)
FY 2017
Debt Serv ice (1)
DSF/DSRF
Balances (2)
Actual/Proj.
Date of
First Missed
Pay m ent (3)
Paid from Current Rev enues
COFINA (PSTBA)(4)
$724
$7 24
NA
Paid Fully /Partially from Ex isting Reserv es
ERS
PBA - Series L
HTA (ex . 1 998 Resolution Series '98 Sub. Bonds) (5)
PRCCDA
PRIDCO
UPR
AFICA - Univ ersity Plaza Project
PRIFA Mental
PRIFA Port (6)
$1 67
11
341
30
18
43
6
3
12
$86
6
17 7
18
20
55
7
2
–
May -17
Jul-17
Jul-17
Jul-17
FY 2018
FY 2018
FY 2018
FY 2018
NA
Pay m ents Already Missed
PFC
PRIFA Rum
GDB(7 )
GO
GSA (8)
PBA (ex cl. Series L)
HTA (1 998 Resolution Series '98 Sub. Bonds) (9)
PRIFA BANs
$86
113
47 2
1 ,1 28
5
266
6
76
–
–
–
–
–
–
–
–
Aug-15
Jan-16
May -16
Jul-16
Jul-16
Jul-16
Jul-16
Aug-16
Note: See appendix for footnotes. The analysis shown above does not include entities excluded from the Fiscal Plan and is based on internal estimates based upon latest fund balances as provided by the trustees (as footnoted).
Note that the analysis provided above remains subject to continued diligence and may change materially. To the extent additional funds are available at any of the entities above, the analysis may change materially.
117
Appendix E –
Footnotes
118
Footnotes to “Debt of Entities Included in the Fiscal Plan”
The following footnotes provide additional detail on the debt of entities included in the Fiscal
Plan shown on page 27
Note: All debt balances shown are preliminary, unaudited estimates based on bonded debt outstanding as of July 2, 2016 and loan balances of June 30, 2016; as
`such, the amounts shown are subject to continued diligence and subject to change. See the Commonwealth Operating Report to see additional details on what is
and is not included in the definition of public sector debt.
1.
Note that balances also exclude MFA loans (though there are no MFA loans to entities included in the Fiscal Plan). Also note that in the Fiscal Plan bonds
held by GDB are eliminated in consolidation.
2.
Please note that all figures are subject to ongoing diligence and numbers may change materially. All bonds are included as of July 2, 2016; loans as of June
30, 2016 and do not include unpaid interest, if any, and do not include payments made by insurers, where applicable.
3.
Excludes estimated accrue d but unpaid interest on Capital Appreciation Bonds (“CABs”), which is shown separately as of July 2, 2016. CABs are zero
coupon bonds that accrete in value until maturity instead of making regularly scheduled interest payments. This accretion is treated in reporting as ‘interest’
rather than principal and is broken out separately from initial par values.
4.
Missed interest is for FY 2016 and as of July 2, 2016.
5.
Private loan figures are representative of loans at non-government entities. Figures include non-bank municipal loans.
6.
Includes operational loans from GDB to the PR Treasury Department, including $102 million of loans from other CW entities representing Trade and Export
Company ($14 million), GDB loans to various minor CW entities, and operational loans payable from GDB to PR Treasury representing long-term credit
facilities of $100 million from the SIF and $2 million from the Automobile Accidents Compensation Administration ("AACA").
7.
HTA includes Teodoro Moscoso bonds and VRDOs held by GDB.
8.
GDB bonds include $110mm of CW-guaranteed bonds issued to the SIF. Where there are TDF guaranteed bonds and loans that TDF is paying out on, they
have been reflected in the GDB bonds and loans.
9.
Includes PRIFA Rum bonds, PRIFA Petroleum Products Excise Tax BANs, PRIFA Ports Authority bonds and PRIFA ASSMCA bonds.
10.
Includes the AFICA - Desarrollos Universitarios University Plaza Project bonds. Desarrollos Universitarios, a component unit of UPR, although legally
separate, is reported as if it was part of the primary government because its debt is expected to be repaid entirely, or almost entirely, with resources of UPR
(via lease payments from UPR to Desarrollos Universitarios).
11.
APLA is excluded as the debt is owned by GDB and thus debt service is intragovernmental. See footnote 6. Additional diligence is required to determine if
entities are included in or excluded from the plan but it is believed that most are Fiscal Plan entities.
12.
Includes Series 2016 A, B, C, D and E Bonds.
13.
PRASA includes CW-guaranteed debt of (i) $521 million in Loans from Other CW Entities representing the CWSRF and DWSRF, (ii) $285 million in bonds
representing the 2008 Sub. Refunding bonds, and (iii) $394 million in bonds representing the Rural Development bonds.
14.
Note that Municipality Related Debt includes MFA, CAE, IVU, and other municipal debt. Loans from other CW entities includes $570 million in loans from
MFA to be repaid by the CAE tax. Also includes municipalities general fund resources, the AFICA Guaynabo Municipal Gov. Center ($8.3 million) and the
AFICA - Guaynabo Warehouse for Emergencies ($6.7 million) bonds.
15.
Excludes TDF guaranteed bonds and loans that TDF is paying out on to third parties.
119
Footnotes to “FY 2016 Debt Service “
The below serve as the footnotes for the FY 2016 debt service schedule shown on page 112
Note: payments shown for FY 2016 include principal and interest payments due on July 1, 2016.
1.
Total amount missed represents amounts not paid by the Commonwealth and has not been reduced by amounts paid by insurers,
if any.
2.
GDB contractual debt service due shown herein excludes the $40 million principal payment due in May 2016 that was
subsequently extended to May 2017.
3.
Amount shown does not include amounts associated with the 1998 Resolution Series A Variable Rate Demand Obligation
(“VRDO”) bonds, which are shown separately in the “Additional Debt Not Shown in Fiscal Plan” section, as these bonds are held by
GDB and therefore eliminated in Fiscal Plan due to consolidation.
4.
Total payment missed represents the missed payment on the 1998 Resolution subordinated Series 1998 bonds, which have a $15
million reserve held at GDB which was not available to make the debt service payment due.
5.
Teodoro Moscoso Bridge bonds shown here for illustrative purposes, as these bonds are included in the Fiscal Plan. The
concessionaire is currently responsible for the debt service payments.
6.
The Rural Development Bonds have been subject to a forbearance agreement since July 1, 2016 and the amounts shown herein
reflect the forbearance of remedies in respect of debt service payments due on July 1, 2016. Amounts shown as paid/missed per the
trustee, which remains subject to continued diligence with the trustee.
7.
Amounts shown include 2002 Series A Bonds, 2005 Series A,B, & C bonds, and 1997 A bonds. Additional diligence regarding the
2005 Series A & C bonds remains ongoing with the trustee.
8.
HFA amounts shown herein represent only the Capital Fund Bonds and do not include the Single Family Mortgage Revenue Bonds
and the Mortgage-Backed Certificates (diligence on these excluded bonds remains ongoing with the trustee).
120
Footnotes to “Fund Balances”
The below serve as the footnotes for the fund balances shown on page 116
Note: all balances shown are strictly funds deposited in the DSF or DSRF, except where noted. Balances include cash amounts where applicable and where reported.
Amounts shown on the Fund Balances page may not be exhaustive of all accounts held by trustees for various purposes. Note that all bonds are shown even if they do not
have either a DSF or DSRF.
1.
2.
3.
4.
5.
6.
7.
8.
9.
10.
11.
12.
13.
14.
15.
16.
17.
18.
19.
20.
21.
22.
PBA exc. Series L balances shown include amounts in the accounts labeled by the trustee as “PBA 1995 SNK Bd Svc,” “PBA 2007M BD Svs Ac,” “ PBA Govt Fac Rev
BD 11R,” “PBA Series 2011 T AC,” and “PBA 2004K Bond Svc Ac.”
PBA Series L balances shown include amounts in the account labeled by the trustee as “PBA SF Reserve.”
COFINA balances shown include amounts in the accounts numbered by the trustee as: 313604, 313607, 880518, 880523, 880215, 880217, 880248, 880299,
880318, 880319, 880497, 880498, and 880499.
PRIFA ASSMCA (Mental Health) balances shown include amounts in the accounts labeled by the trustee as “2007 Debt Service Reserve Fund,” “2007 Sinking Fund
Account,” and “2007 Interest Account.”
PRIFA BANs balances shown include amounts in the account labeled by the trustee as “2015 Redemption Fund.”
UPR balances shown include amounts in the account labeled by the trustee as “UPR 6-1-71 Rev Bds Rsv Ac.”
AFICA University Plaza Project balances shown include amounts in the account labeled by the trustee as “Debt Serviec Reserve Fund,” and “Master Debt Service.”
AFICA Guaynabo balances shown include amounts in the account labeled by the trustee as “1995 A – Bond Fund,” “1995A – Debt Serv.Reserv.Fund,” “1998A
Interest Acct,” “1998A Debt Serv.Resv.,” and “1998 Bond Fund.”
PRCCDA balances shown include amounts in the account labeled by the trustee as “Hotel Occ Bds Ser A D S R FD.”
PRIDCO balances shown include amounts in the account labeled by the trustee as “1964 Bond Service Interest,” and “1964 Bond Reserve.”
HTA balances shown include amounts in the accounts numbered by the trustee as: 115484, 115526, 115532, 115538, 115482, 115524, 115537, 231806, and 764919.
HTA 1998 Resolution Senior balances include those available to the HTA 1998 Resolution Variable Rate Demand Obligation (“VRDO”) bonds.
HTA balances shown include amounts in the accounts numbered by the trustee as: 115471, 115479, 115522, 115566, 115653, 231811, 764911, 115469, 115478, 115488,
115515, 115520, 115564, 231793, 231805, 404035, 764914, and 764924.
HTA balances shown include amounts in the accounts numbered by the trustee as: 115475 and 115473.
HTA balances shown include amounts in the accounts numbered by the trustee as 115541.
HTA 1998 Resolution Subordinated Series 1998 bond DSRF amounts are held separately at GDB and are currently not available to make debt service payments on
these bonds.
ERS balances shown include amounts in the account labeled by the trustee as “DS Interest Sub Ac Senior,” “Debt Service Reserve Ac,” and “General Reserve Ac.”
MFA balances shown include amounts in the account labeled by the trustee as “2002 Bond Serv.,” “2002 Reserve Ac.,” “1997 SR A/B Reserve,” “1997 Bond Service
Account,” "1999 Bond Service," "1999 Reserve Ac.," "05 Ser Bds Bond Ser Fund," and "05 Ser Bds Reserve Fund." Diligence with the trustee on these amounts and
additional reserve accounts that may exist remains ongoing.
HFA balances shown include amounts in the accounts laveled by the trustee as “2008 Debt Service Rsv FD,” “2008 Debt Svc Fund,” “Puerto Rico HSG Fin Debt Svc
Fd Ac,” "ST 2008 Debt Svc Rsv Fd," and “Puerto Rico HSG Fin Debt Svc Rsv Fd Ac.” Diligence with the trustee remains ongoing on the available reserve balances.
CTF balances shown include amounts in the account labeled by the trustee as “FD 2002 Bd Fd Ds Ac,” and “2002 Bd Fd Lq Rsv.”
PRASA balances shown include amounts in the account labeled by the trustee as “2008 Series A&B Senior Interes,” “2008 Senior Principal Acct,” “2008 Senior Debt
Service Res,” “2008 Senior B Debt Service Res,” “2012 A Senior Interest,” “2012-B Senior Principal Acct,” and "2008 Subordinated Bond Fund." Note that additional
diligence regarding the amounts available for debt service remains ongoing with the trustee.
PREPA balances shown include amounts in the account labeled by the trustee as “1974 Sinking Fd BS Ac Int,” “1974 Sinking Fd Reserve Ac,” “Sinking Fd Reserve
SubAc A,” “Sinking Fd Reserve SubAc B,” “Sinking Fd Reserve SubAc C,” and “Sinking Fd Reserve SubAc D.”
121
Footnotes to “Estimated Fund Balance Depletion”
The following footnotes provide additional detail to page titled “Estimated Fund Balance
Depletion” shown on page 117
1.
FY 2017 Debt Service shown indicates the total debt service due in FY 2017 (including debt service payments due on July 1, 2017).
2.
Debt Service Fund (DSF) and Debt Service Reserve Fund (DSRF) balances as provided by the trustees as of October 2016, unless otherwise
indicated. See footnotes on page 121 for additional details.
3.
The actual/projected date of first missed payment is an estimate only and subject to change materially. Estimate based on illustrative
assumptions, including the assumption that no additional funds are deposited in the debt service fund or the debt service reserve fund, if
applicable, and all future debt service payments are made out of the existing reserve balances until the fund balances are fully depleted.
4.
COFINA FY 2017 total debt service and DSF/DSRF balance reflects the Pledged Sales Tax Base Amount (“PSTBA”) for FY 2017 (totaling $724
million) and does not represent the current balance in the accounts.
5.
Analysis shown herein illustratively assumes continuation of clawback through FY 2017 and also assumes that toll revenues are no longer
transferred to debt service accounts, per executive order issued May 2016 suspending the obligation of HTA to transfer to bondholders any toll
revenue or other income it receives. HTA 1998 Resolution Senior bonds debt service includes debt service due on VRDOs held by GDB and the
DSF/DSRF balances shown include the amounts that would be used to make debt service payments on the VRDOs. Note that VRDOs are not
shown in the Fiscal Plan, as these bonds are held by GDB and therefore eliminated in Fiscal Plan due to consolidation.
6.
PRIFA Ports is not believed to have a DSF or DSRF. Debt service payments in FY 2017 are expected to be paid from loan payments from the
Ports Authority.
7.
Includes $110m of GDB notes which are Commonwealth guaranteed. Amounts shown for FY 2017 includes the $40 million that was originally
due in May 2016 but was extended to May 2017.
8.
Note that while GSA is not bonded debt, it is shown in this schedule for illustrative purposes as it is included in the Fiscal Plan.
9.
The HTA 1998 Resolution Subordinated Series 1998 bonds have a Reserve account totaling approximately $15 million, which is separately
held at GDB and was not available for debt service payments due July 1, 2016. Assumed to continue to be unavailable in this analysis and as
such are illustratively not shown in this table.
122

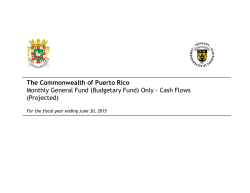
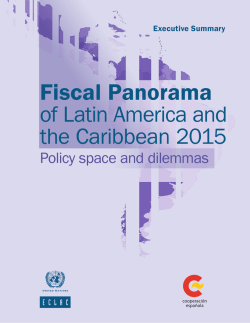
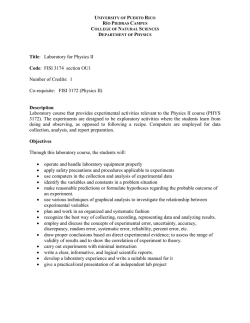

© Copyright 2026