
Las pernoctaciones en alojamientos turísticos extrahoteleros
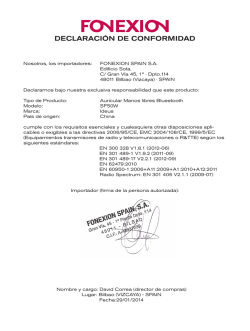
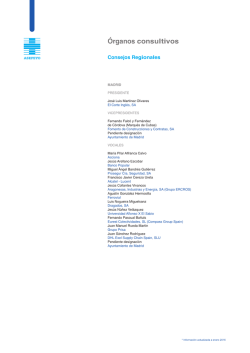
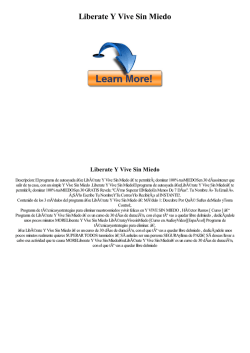
31 de octubre de 2016
Encuestas de ocupación en alojamientos turísticos extrahoteleros
Septiembre 2016. Datos provisionales
Las pernoctaciones en alojamientos turísticos extrahoteleros
aumentan un 8,6% en septiembre respecto al mismo mes de 2015
Las pernoctaciones en alojamientos turísticos extrahoteleros (apartamentos, campings,
alojamientos de turismo rural y albergues) superan los 12 millones en septiembre, un 8,6%
más que en el mismo mes de 2015. Las pernoctaciones de residentes aumentan un 5,5% y
las de no residentes un 10,3%.
La estancia media es de 5,0 pernoctaciones por viajero.
Durante los nueve primeros meses de 2016, las pernoctaciones aumentan un 8,7% respecto
al mismo periodo del año anterior.
Los viajeros y pernoctaciones en los alojamientos turísticos colectivos extrahoteleros
durante el mes de septiembre son:
September 2016
Residents in Spain
EU (not including Spain)
Rest of the world
TOTAL
Travellers
1,189,647
1,050,145
163,348
2,403,140
Overnight stays
4,222,750
7,090,856
756,347
12,069,953
Apartamentos turísticos
Las pernoctaciones en apartamentos turísticos aumentan un 9,7% en septiembre. Las
pernoctaciones de residentes suben un 6,4% y las de no residentes un 10,8%.
La estancia media baja un 7,0% respecto a septiembre de 2015, situándose en 6,2
pernoctaciones por viajero.
En septiembre se ocupan el 43,7% de las plazas ofertadas por los apartamentos turísticos,
un 6,6% más que en el mismo mes de 2015. El grado de ocupación por plazas en fin de
semana se sitúa en el 46,3%, con un incremento del 4,7%.
EOAT-SEPTIEMBRE 2016 (1/6)
Instituto Nacional de Estadística
Overnight stays annual growth rate in holiday dwellings in %
18.3
13.9
11.9
8.0
6.6
9.7
8.9
8.0
3.4
Aug-16
May-16
Jun-16
Jul-16
3.4
Apr-16
Mar-16
Feb-16
Jan-16
Dec-15
Oct-15
Nov-15
3.7
Sep-15
11.7
Sep-16
10.4
Las pernoctaciones de no residentes en apartamentos turísticos representan el 75,2% del
total. Reino Unido es el principal mercado emisor, con más de 2,3 millones de
pernoctaciones, un 10,3% más que en septiembre de 2015. El siguiente mercado emisor es
Alemania, con 916.820 pernoctaciones, un 2,1% más.
Distribution of overnight stays of residents abroad of the 11 main
countries by origin
41.3
15.8
Belgium
1.5
1.3
Other countries
1.7
Poland
2.0
Norway
2.5
Russia
3.7
Italy
5.6
Ireland
5.9
France
Netherlands
Germany
United Kingdom
6.7
Sweden
12.0
Canarias es el destino preferido en apartamentos, con más de 2,5 millones de
pernoctaciones, y un aumento del 10,6% respecto a septiembre de 2015. Illes Balears
alcanza la mayor ocupación, con el 86,7% de los apartamentos ofertados.
Por zonas turísticas, la isla de Mallorca es el destino preferido, con 940.094 pernoctaciones
y una ocupación del 89,9% de los apartamentos ofertados.
Los puntos turísticos con mayor número de pernoctaciones en septiembre son San
Bartolomé de Tirajana, Arona y Tías.
EOAT-SEPTIEMBRE 2016 (2/6)
Instituto Nacional de Estadística
Campings
Las pernoctaciones en campings registran en septiembre un incremento anual del 5,6%
respecto al mismo mes del año anterior. Las de residentes aumentan un 4,1% y las de no
residentes un 7,1%.
Durante el mes de septiembre se ocupan el 36,1% de las parcelas ofertadas, un 1,8% más
que en el mismo mes de 2015. El grado de ocupación por parcelas en fin de semana
alcanza el 38,1%, con un aumento anual del 0,8%.
El 50,0% de las pernoctaciones en campings las realizan viajeros no residentes. Alemania
es el principal mercado emisor, con el 20,8% de las pernoctaciones de no residentes, un
6,3% menos que en septiembre de 2015.
Overnight stays annual growth rate in campsites in %
71.0
13.1
11.2
9.7
6.5
7.7
5.6
Sep-16
9.8
6.5
Aug-16
14.3
4.4
Jul-16
Jun-16
May-16
-17.5
Apr-16
Mar-16
Feb-16
Jan-16
Dec-15
Nov-15
Oct-15
Sep-15
0.2
Cataluña es el destino preferido en campings, con más de 1,6 millones de pernoctaciones,
un 1,3% más que en septiembre de 2015. La Rioja alcanza el mayor grado de ocupación,
con el 68,6% de las parcelas ofertadas.
Por zonas turísticas, la Costa Brava es el destino preferido, con 694.721 pernoctaciones.
Costa Blanca alcanza la mayor ocupación, del 64,3% de las parcelas ofertadas.
Los puntos turísticos con más pernoctaciones son Benidorm, Mont-Roig Del Camp y
Torroella De Montgrí.
Alojamientos de turismo rural
Las pernoctaciones en alojamientos de turismo rural presentan un aumento anual del 11,5%
en septiembre. Las de residentes suben un 6,8% y las de no residentes un 21,0%.
En los alojamientos de turismo rural se ocupan el 18,3% de las plazas, con un crecimiento
del 7,5% respecto a septiembre de 2015. El grado de ocupación en fin de semana se sitúa
en el 31,1%, con un descenso del 0,5%.
EOAT-SEPTIEMBRE 2016 (3/6)
Instituto Nacional de Estadística
Occupancy rate by bedplaces and bedplaces on weekends in
rural tourism accommodation
51.9
41.6
37.9
34.9
31.1
30.5
Occupancy rate by bedplaces
Sep-16
Aug-16
Jul-16
Apr-16
Jan-16
Dec-15
Nov-15
Oct-15
12.9
9.5
8.6
18.3
16.0
14.4
Mar-16
15.7
10.8
Sep-15
17.4
17.3
Feb-16
16.2
31.1
28.3
23.0
17.0
32.2
24.9
May-16
27.3
28.0
Jun-16
31.3
Weekend occupancy rate by bedplaces
Por comunidades, Illes Balears es el destino preferido, con 145.277 pernoctaciones, un
15,0% más que en septiembre de 2015. Esta comunidad también alcanza el mayor grado de
ocupación, con el 66,5% de las plazas ofertadas.
Por zonas turísticas, la Isla de Mallorca es el principal destino, con 120.835 pernoctaciones.
La isla de Menorca alcanza la mayor ocupación, del 69,0% de las plazas ofertadas.
Distribution of overnight stays of traveller residents by autonomous community of destination in rural
tourism accommodation in %
1.9
1.5
1.1
0.9
Canarias
Murcia, Región de
Rioja, La
3.8
Navarra, Comunidad Foral de
3.9
Comunitat Valenciana
3.9
Madrid, Comunidad de
4.6
Extremadura
4.8
Aragón
5.6
Andalucía
5.8
País Vasco
5.9
Galicia
7.2
Castilla-La Mancha
8.8
Cantabria
Cataluña
10.7
Asturias, Principado de
Castilla y León
11.1
Balears, Illes
18.7
Albergues
Las pernoctaciones en albergues registran en septiembre un aumento anual del 5,4%. Las
de residentes suben un 6,4% y las de no residentes un 4,1%.
Se ocupan el 24,2% de las plazas, un 8,7% más que en septiembre de 2015. El grado de
ocupación en fin de semana alcanza el 32,4%, con un aumento del 2,0%.
Por comunidades, Cataluña es el destino preferido, con 79.276 pernoctaciones, un 9,2%
más que en septiembre de 2015. Esta comunidad también alcanza la mayor ocupación, con
el 44,6% de las plazas ofertadas.
EOAT-SEPTIEMBRE 2016 (4/6)
Instituto Nacional de Estadística
Índices de precios
El Índice de Precios de Apartamentos Turísticos (IPAP) aumenta un 8,3% respecto a
septiembre de 2015. La tarifa tour-operadores y agencias de viajes, que tiene el mayor peso
en la estructura de ponderaciones este mes (49,5%), sube un 10,0%.
El Índice de Precios de Campings (IPAC) se incrementa un 0,8% en tasa anual. La tarifa
bungalow, que tiene el mayor peso en la estructura de ponderaciones en septiembre
(42,8%), sube un 1,7% respecto al mismo mes de 2015.
El Índice de Precios de Alojamientos de Turismo Rural (IPTR) registra un aumento del 1,6%
en septiembre. La tarifa fin de semana, que supone el 51,2% del peso total, sube un 1,3%
en tasa anual.
Price Indices. Annual variation rates
1.6
Sep-16
0.8
8.3
3.3
Aug-16
1.9
5.1
3.2
3.3
Jul-16
5.7
2.3
Jun-16
-0.4
4.3
2.3
-0.9
May-16
5.3
1.8
Apr-16
-1.8
3.6
2.4
5.4
Mar-16
6.3
1.4
Feb-16
0.8
4.9
1.8
Jan-16
2.0
5.6
1.5
0.0
Dec-15
4.8
1.4
Nov-15
0.5
4.4
1.3
Oct-15
0.9
5.1
2.0
Sep-15
-0.1
3.6
RTAPI
TCSPI
HDPI
EOAT-SEPTIEMBRE 2016 (5/6)
Instituto Nacional de Estadística
Evolución de los viajeros y las pernoctaciones en todos los alojamientos
turísticos colectivos españoles
Las pernoctaciones en el conjunto de alojamientos turísticos colectivos españoles (hoteles 1,
apartamentos, campings, alojamientos de turismo rural y albergues) aumentan un 5,8% en
septiembre en tasa anual. Las de residentes suben un 0,3% y las de no residentes un 8,5%.
La estancia media desciende un 2,8% respecto a septiembre de 2015, situándose en 3,8
pernoctaciones por viajero.
Los viajeros y pernoctaciones en alojamientos turísticos colectivos son:
September 2016
Holiday dwellingsCampsites Rural T.
Travellers
Residents
Non-residents
Overnight stays
Residents
Non-residents
1,251,600
435,290
816,311
7,701,182
1,910,489
5,790,692
734,286
458,328
275,958
3,335,362
1,666,517
1,668,845
Non-hotel
339,488
250,565
88,923
866,672
553,606
313,066
Hotels
77,765
45,464
32,301
166,738
92,138
74,600
Hotels
2,403,139
1,189,647
1,213,493
12,069,954
4,222,750
7,847,203
Total
10,478,548
4,678,662
5,799,886
36,647,654
10,747,832
25,899,823
12,881,687
5,868,309
7,013,379
48,717,608
14,970,582
33,747,026
Del total de pernoctaciones realizadas en alojamientos turísticos colectivos, un 75%
corresponde a hoteles y un 25% a alojamientos turísticos extrahoteleros.
Overnight stays annual growth rate in collective tourist
accommodation
21.0
11.5
10.8
9.7
8.0
7.1
6.4
6.8
6.4
5.6
5.0
5.4
4.1
4.1
-1.7
Hotels
Holiday dwellings
Campsites
Resident in Spain
Resident abroad
Rural tourism
Hostels
Total
Los principales mercados emisores en el conjunto de alojamientos turísticos reglados son el
británico (con el 30,0% del total de pernoctaciones de no residentes), el alemán (22,9%) y el
francés (7,6%).
Illes Balears es el destino preferido, con más de 11,1 millones de pernoctaciones (un 5,5%
más que en septiembre de 2015). Le siguen Cataluña, con más de 8,9 millones (y un
aumento anual del 4,3%) y Canarias, con 8,3 millones (y un incremento del 9,1%).
Más información en INEbase – www.ine.es
Todas las notas de prensa en: www.ine.es/prensa/prensa.htm
Gabinete de prensa: Teléfonos: 91 583 93 63 / 94 08 – Fax: 91 583 90 87 - [email protected]
Área de información: Teléfono: 91 583 91 00 – Fax: 91 583 91 58 – www.ine.es/infoine
1
La nota de prensa correspondiente a la Coyuntura Turística Hotelera se ha publicado el 24 de octubre.
EOAT-SEPTIEMBRE 2016 (6/6)
Tourist Accomodation Occupancy Survey
(Holiday Dwellings)
September 2016
Provisional data
1. Travellers, overnight stays and average stay by Autonomous Cities and Communities
Autonomous Cities and
Communities
TOTAL
Andalucía
Aragón
Asturias, Principado de
Balears, Illes
Canarias
Cantabria
Castilla y León
Castilla - La Mancha
Cataluña
Comunitat Valenciana
Extremadura
Galicia
Madrid, Comunidad de
Murcia, Región de
Navarra, Comunidad Foral de
País Vasco
Rioja, La
Ceuta
Melilla
Annual rate
Cumulative annual rate
Travellers
Total
Residents
in Spain
Residents
abroad
Overnight stays
Total
Residents
in Spain
Residents
abroad
Average
stay
1,251,600
435,290
816,311
7,701,182
1,910,489
5,790,692
6.15
217,610
13,968
8,896
255,257
318,136
13,348
13,065
9,076
118,374
181,329
7,182
12,590
44,781
12,836
7,966
11,765
5,421
17.98
13.32
100,657
11,628
7,415
32,585
65,293
11,980
10,922
8,096
43,808
81,904
6,249
9,069
21,404
9,399
5,338
5,427
4,116
18.34
11.21
116,953
2,340
1,481
222,673
252,843
1,368
2,143
980
74,566
99,425
933
3,522
23,377
3,436
2,628
6,339
1,305
17.79
14.54
989,611
42,183
30,957
1,710,329
2,590,758
55,351
32,242
23,008
712,269
1,157,183
12,631
41,341
153,452
77,677
18,015
43,086
11,089
9.67
9.03
363,694
31,938
26,875
163,680
347,777
48,838
27,839
19,233
203,489
467,604
11,108
32,565
69,171
54,625
13,936
19,306
8,809
6.40
8.14
625,917
10,245
4,082
1,546,649
2,242,981
6,513
4,403
3,774
508,780
689,579
1,524
8,776
84,281
23,052
4,078
23,779
2,280
10.80
9.34
4.55
3.02
3.48
6.70
8.14
4.15
2.47
2.53
6.02
6.38
1.76
3.28
3.43
6.05
2.26
3.66
2.05
-7.04
-3.79
2. Capacity, occupancy and number of staff by Autonomous Cities and Communities
Autonomous Cities and
Communities
Capacity
Estimated
bedplaces
Estimated
Holiday
dwelling
Level of occupancy
Per
Per
bedplaces
bedplaces
at weekend
Per Holiday
dwelling
Per Holiday
dwelling
at weekend
Employed
personnel
TOTAL
585,644
152,205
43.66
46.29
68.56
71.47
32,357
Andalucía
Aragón
Asturias, Principado de
Balears, Illes
Canarias
Cantabria
Castilla y León
Castilla - La Mancha
Cataluña
Comunitat Valenciana
Extremadura
Galicia
Madrid, Comunidad de
Murcia, Región de
Navarra, Comunidad Foral de
País Vasco
Rioja, La
Ceuta
Melilla
Annual rate
Cumulative annual rate
74,330
7,004
4,532
87,783
153,307
5,169
5,500
5,379
80,318
128,819
1,902
5,219
9,165
9,783
2,122
3,783
1,529
2.95
2.22
18,390
1,595
1,207
27,988
46,465
1,387
1,215
1,288
17,463
25,728
409
1,355
3,656
2,309
487
914
346
2.23
1.53
44.14
20.38
22.71
64.30
55.97
35.42
19.72
14.40
29.49
29.97
22.10
26.29
55.57
26.47
28.17
37.65
24.05
6.62
6.26
48.90
31.05
26.76
65.22
56.93
42.81
33.03
26.94
32.74
32.01
30.30
30.28
58.67
29.76
38.58
45.03
38.62
4.66
6.24
69.83
31.71
30.77
86.67
82.84
50.06
34.05
23.73
48.61
48.86
37.46
40.51
75.35
39.43
47.63
61.24
40.62
8.27
7.41
76.02
42.72
34.55
87.39
83.89
58.07
46.54
39.40
52.88
51.79
48.77
44.62
76.62
44.31
57.58
68.81
56.95
6.47
7.32
4,819
552
321
6,926
10,302
355
562
476
2,477
3,401
151
413
596
347
336
168
155
6.92
6.89
HDOS (TABLES ANNEXO) - SEPTEMBER 2016 (1/3)
31st october 2016
3. Travellers, overnight stays, capacity, occupancy, total number of staff with greater
number of overnight stays *
Provinces
Travellers
Residents
in Spain
Overnight stays
Residents
abroad
Residents
in Spain
Capacity
Residents
abroad
Average
stay
Estimated
bedplaces
Level of occupancy
Estimated
holiday
dwelling
Per
bedplaces
Per
Per Holiday
Employed
Holiday
dwelling
per-
dwelling at weekend
sonnel
Palmas, Las
40,943
158,662
222,918
1,443,623
8.35
97,901
29,590
56.29
84.63
85.52
6,111
Santa Cruz de Tenerife
24,349
94,181
124,859
799,358
7.80
55,406
16,875
55.41
79.71
81.03
4,191
Alicante\Alacant
34,069
82,029
202,246
573,728
6.68
83,800
17,028
30.92
51.73
54.21
2,350
Málaga
28,197
84,293
116,209
524,641
5.70
42,196
10,224
50.39
82.20
84.89
2,905
Tarragona
21,473
25,647
98,328
184,569
6.00
28,648
5,683
32.87
56.73
61.99
936
Girona
10,291
22,629
65,602
206,550
8.27
39,733
8,356
22.83
34.75
38.39
816
Castellón\Castelló
33,422
6,253
171,053
59,695
5.82
28,141
5,294
27.33
41.75
45.66
532
Valencia\València
Barcelona
Almería
14,413
9,383
20,544
11,142
26,022
2,539
94,305
31,112
89,600
56,156
116,202
19,088
5.89
4.16
4.71
16,877
9,680
10,752
3,406
2,957
2,410
29.72
50.88
33.66
45.66
77.59
55.82
49.34
81.04
69.68
519
648
363
Sevilla
13,101
15,880
32,030
43,063
2.59
4,520
1,415
54.22
78.95
82.41
342
Cádiz
11,214
3,582
40,320
13,459
3.63
5,002
1,320
35.46
52.58
60.65
415
9,708
7,753
30,230
17,955
2.76
4,542
1,243
35.43
46.95
55.01
409
10,534
761
39,516
3,484
3.81
4,078
975
35.04
49.16
65.53
139
2,260
4,509
7,949
18,126
3.85
2,277
489
37.83
54.49
62.89
84
Granada
Huelva
Gipúzkoa
4. Travellers, overnight stays, capacity, occupancy, total number of staff
from tourist areas with greater number of overnight stays
Tourist Areas
Travellers
Residents
in Spain
Overnight stays
Residents
abroad
Residents
in Spain
Capacity
Residents
abroad
Average
stay
Estimated
bedplaces
Level of occupancy
Estimated
holiday
dwelling
Per
bedplaces
Per
Per Holiday
Employed
Holiday
dwelling
per-
dwelling at weekend
sonnel
Isla de Mallorca
6,442
124,804
28,024
912,070
7.16
46,038
14,841
67.43
89.91
90.35
3,607
Isla de Tenerife
18,566
90,826
97,946
765,663
7.89
49,564
14,845
57.87
83.80
84.82
3,714
Costa Blanca
33,615
76,812
201,112
555,128
6.85
81,192
16,510
31.04
51.88
54.41
2,237
Isla de Gran Canaria
23,736
67,482
115,068
631,349
8.18
46,200
14,279
53.38
80.11
82.23
2,916
Isla de Lanzarote
Costa del Sol
10,700
25,901
67,972
80,177
68,601
108,558
593,128
504,009
8.41
5.77
36,230
39,986
10,576
9,702
60.46
50.82
89.78
83.12
89.75
85.59
2,242
2,802
Islas de Ibiza-Formentera
14,662
64,409
69,121
373,263
5.59
23,406
7,764
62.04
80.51
82.35
1,954
Isla de Menorca
11,480
33,459
66,535
261,316
7.30
18,339
5,383
59.32
86.60
86.48
1,365
Costa Daurada
20,242
24,577
93,725
181,666
6.14
27,082
5,344
33.84
58.43
63.15
902
9,694
22,520
62,697
206,162
8.35
38,397
8,058
23.34
35.52
39.08
696
Costa Brava
5. Travellers, overnight stays, capacity, occupancy, total number of staff
from tourist sites with greater number at overnights stays
Tourist sites
San Bartolomé de Tirajana
Arona
Tías
Benidorm
Travellers
Residents
in Spain
15,020
43,121
71,772
Capacity
AveEstimated Estimated
rage
bedholiday
stay
places
dwelling
427,556
8.59
29,958
9,485
4,956
5,177
9,239
40,378
38,020
39,024
32,740
33,366
58,322
340,100
323,174
241,163
Residents
abroad
Overnight stays
Residents Residents
in Spain
abroad
8.22
8.25
6.21
20,404
18,865
21,101
6,171
5,819
4,933
Level of occupancy
Per
Per Holiday
Per
bedHoliday dwelling
places dwelling at weekend
54.86
82.79
84.72
60.68
62.53
47.30
84.33
90.17
76.20
84.59
89.94
78.79
Employed
personnel
1,820
1,582
1,137
705
Adeje
3,684
25,227
18,048
238,837
8.89
15,490
4,285
55.19
86.47
86.94
1,045
Mogán
Alcúdia
Ciutadella de Menorca
6,498
1,591
9,104
23,375
27,592
23,583
33,169
6,884
51,344
197,948
223,040
164,706
7.74
7.88
6.61
15,232
10,185
11,789
4,360
3,190
3,683
50.54
73.62
60.67
75.84
97.32
87.28
78.29
97.38
86.73
1,004
735
934
Calvià
Teguise
824
24,455
3,189
201,243
8.09
10,376
3,544
65.49
86.27
87.46
997
2,992
18,547
17,093
162,617
8.34
10,095
2,961
58.86
90.15
90.34
662
* Provinces belonging to uniprovincial Autonomous Communities have not been included because they are reflected
in previous tables.
HDOS (TABLES ANNEX) - SEPTEMBER 2016 (2/3)
Provisional data
6. Travellers and overnight stays by countries of residence
Countries
TOTAL
Residents in Spain
Residents abroad
Total residents abroad
Total residents in E.U (excluding Spain)
- Germany
- Austria
- Belgium
-Denmark
- Finland
- France
- Greece
- Ireland
- Italy
- Luxembourg
- Netherlands
- Poland
- Portugal
- United Kingdom
- Czech Republic
- Sweden
- Other EU countries
Norway
Russia
Switzerland
Other european countries
United States of America
Rest of America
African countries
Other countries
Travellers
Total
Overnight stays
Total
%
%
1,251,600
100.00
7,701,182
100.00
435,290
816,311
816,311
704,885
102,536
7,203
12,974
9,767
5,437
48,366
598
45,491
38,719
770
46,546
11,224
9,394
333,431
3,796
18,479
10,154
11,918
15,857
9,667
10,823
11,592
19,192
5,918
26,459
34.78
65.22
100.00
86.35
12.56
0.88
1.59
1.20
0.67
5.92
0.07
5.57
4.74
0.09
5.70
1.37
1.15
40.85
0.47
2.26
1.24
1.46
1.94
1.18
1.33
1.42
2.35
0.72
3.24
1,910,489
5,790,692
5,790,692
5,194,736
916,820
58,019
96,740
70,764
39,629
342,630
2,597
322,129
211,934
5,495
387,110
74,196
42,294
2,391,063
30,509
143,388
59,418
89,425
117,930
63,456
66,602
46,659
88,093
31,128
92,663
24.81
75.19
100.00
89.71
15.83
1.00
1.67
1.22
0.68
5.92
0.04
5.56
3.66
0.09
6.69
1.28
0.73
41.29
0.53
2.48
1.03
1.54
2.04
1.10
1.15
0.81
1.52
0.54
1.60
HDOS (TABLES ANNEX) - SEPTEMBER 2016 (3/3)
Provisional data
Tourist Accomodation Occupancy Survey
Campsite Occupancy Survey (COS)
September 2016
Provisional data
1. Travellers, overnight stays and average stay by category of establishment
Category
Travellers
Overnight stays
Total
Residents
Residents
in
abroad
Total
Spain
Residents
Residents
in
abroad
Average
stay
Spain
TOTAL
734,286
458,328
275,958
3,335,362
1,666,517
1,668,845
4.54
Luxury and first-class
327,788
191,819
135,969
1,556,986
726,381
830,606
4.75
Second-class
343,384
217,438
125,947
1,589,918
792,297
797,621
4.63
Third-class
63,114
49,072
14,042
188,458
147,839
40,618
2.99
Annual rate
17.50
15.86
20.32
5.59
4.09
7.12
-10.14
Cumulative annual rate
10.31
9.60
11.71
7.19
7.38
6.98
-2.82
2. Open establishments, capacity, occupancy and number of
staff by category of establishments
Category
Capacity
Estimated
open
establishments
Estimated
Estimated
bedplaces
pitches
Occupied
pitches
Occupancy
rate
Weekend
occupancy
per pitch
rate
Employed
personnel
TOTAL
991
660,308
203,127
2,199,326
36.09
38.12
8,285
Luxury and first-class
258
283,312
83,950
915,050
36.33
38.36
3,777
Second-class
553
314,652
99,282
1,081,586
36.31
38.64
3,867
Third-class
180
62,344
19,895
202,689
33.96
34.54
640
Annual rate
-0.11
0.01
0.61
2.38
1.76
0.77
5.24
1.63
1.32
1.92
4.61
2.40
2.89
6.18
Cumulative annual rate
3. Travellers, overnight stays and average stay by Autonomous Cities and Communities
Autonomous cities and
communities
Travellers
Overnight stays
Total
Residents
Residents
in
abroad
Total
Residents
in
Spain
TOTAL
Average
stay
Residents
eabroad
Spain
734,286
458,328
275,958
3,335,362
1,666,517
1,668,845
4.54
Andalucía
94,580
61,690
32,890
337,852
220,177
117,675
3.57
Aragón
32,553
18,182
14,370
81,154
45,889
35,265
2.49
Asturias, Principado de
19,255
12,265
6,990
64,806
50,938
13,868
3.37
Balears, Illes
6,400
3,087
3,313
35,141
11,427
23,713
5.49
Canarias
2,150
1,974
176
7,459
5,369
2,090
3.47
Cantabria
25,857
14,282
11,575
93,029
68,671
24,358
3.60
Castilla y León
27,069
13,050
14,019
55,776
33,284
22,492
2.06
8,527
6,419
2,108
17,922
14,175
3,747
2.10
316,950
205,795
111,155
1,692,146
765,982
926,163
5.34
79,078
45,266
33,812
601,110
217,469
383,642
7.60
2.42
Castilla - La Mancha
Cataluña
Comunitat Valenciana
Extremadura
10,357
7,691
2,666
25,081
20,251
4,830
Galicia
24,569
13,598
10,972
67,047
48,644
18,404
2.73
Madrid, Comunidad de
21,571
18,588
2,983
72,070
63,371
8,699
3.34
Murcia, Región de
11,471
7,117
4,354
62,024
23,325
38,699
5.41
Navarra, Comunidad Foral de
16,770
11,289
5,482
43,283
35,346
7,937
2.58
País Vasco
24,892
9,171
15,721
55,696
22,503
33,193
2.24
Rioja, La
12,237
8,865
3,373
23,766
19,695
4,071
1.94
Ceuta
-
-
-
-
-
-
-
Melilla
-
-
-
-
-
-
-
COS (TABLES ANNEX) - SEPTEMBER 2016 (1/4)
31st october 2016
4. Open establishments, capacity, occupancy and number of
staff by autonomous cities and communities
Autonomous cities and
communities
Estimated
open
Capacity
Estimated
Estimated
establish-
bedplaces
pitches
Occupied
pitches
Occupancy Weekend
rate
occupancy
per
ments
Employed
personnel
rate
pitch
TOTAL
991
660,308
203,127
2,199,326
36.09
38.12
8,285
Andalucía
140
79,606
25,931
182,145
23.41
28.23
991
Aragón
79
28,708
8,832
64,743
24.44
28.97
389
Asturias, Principado de
39
21,068
6,785
53,412
26.24
30.20
188
Balears, Illes
8
3,021
1,317
14,861
37.61
36.59
101
Canarias
6
6,901
1,708
6,625
12.93
14.93
19
Cantabria
43
33,284
10,157
105,632
34.67
33.71
253
Castilla y León
66
28,530
9,213
59,576
21.56
24.21
202
Castilla - La Mancha
24
9,709
2,969
16,872
18.94
25.99
123
Cataluña
276
273,170
81,235
1,005,389
41.25
41.80
3,572
Comunitat Valenciana
119
74,592
23,354
362,275
51.71
53.00
1,173
Extremadura
21
7,351
2,465
22,082
29.86
36.77
115
Galicia
75
27,404
8,681
43,231
16.60
18.52
360
Madrid, Comunidad de
20
17,921
6,031
92,826
51.31
53.43
219
Murcia, Región de
18
15,105
4,959
40,482
27.21
31.84
188
Navarra, Comunidad Foral de
25
14,415
3,854
38,607
33.39
37.01
158
País Vasco
23
11,539
3,215
40,692
42.19
44.87
153
Rioja, La
8
7,983
2,423
49,877
68.61
71.22
81
Ceuta
-
-
-
-
-
-
-
Melilla
-
-
-
-
-
-
-
5. Travellers and overnight stays, average stay, capacity, occupancy and
number of staff by provinces with the greatest number of overnight stays**
Provinces
Travellers
Overnight stays
Residents
Residents
Residents
Residents
in
abroad
in
abroad
Spain
Average
stay
Spain
Estimated
open
Estimated
pitches
Occupancy Employed
rate
personnel
establish-
per
ments
pitch
Girona
62,754
60,549
210,989
512,470
5.87
109
35,395
35.60
Tarragona
77,904
28,360
349,838
297,214
6.09
60
24,103
48.21
1,844
994
Alicante\Alacant
17,889
13,689
98,934
243,402
10.84
45
10,357
58.59
590
Barcelona
50,007
19,682
164,550
109,563
3.93
59
14,859
47.45
563
Castellón\Castelló
11,515
12,170
62,343
103,052
6.98
38
6,588
47.91
301
Cádiz
23,159
6,889
77,734
20,915
3.28
29
7,059
23.24
278
Valencia\València
15,861
7,953
56,192
37,188
3.92
36
6,409
44.50
281
Málaga
10,639
8,412
35,308
50,420
4.50
32
4,985
32.95
228
Huelva
11,303
2,497
59,611
7,375
4.85
11
4,811
24.35
140
Huesca
13,523
8,559
33,407
20,133
2.42
53
6,603
23.95
284
Lleida
15,130
2,564
40,605
6,917
2.69
47
6,879
32.56
171
220
Pontevedra
9,864
6,653
34,271
8,753
2.60
32
4,481
18.95
Gipúzkoa
5,301
11,639
12,789
26,963
2.35
13
1,940
39.13
72
Almería
5,389
3,242
19,570
11,805
3.63
18
2,716
17.67
103
Granada
4,274
6,681
11,405
18,552
2.73
24
2,752
21.22
118
** Provinces belonging to uniprovincial Autonomous Communities have not been included because they are reflected in previous tables.
COS (TABLES ANNEX) - SEPTEMBER 2016 (2/4)
Provisional data
6. Travellers, overnight stays, average stay, open establishments, capacity, occupancy
and number of staff from tourist areas with the greatest number of overnight stays
Tourist areas
Travellers
Residents
in
Spain
Overnight stays
Residents
abroad
Residents
in
Spain
Residents
abroad
Average
stay
Estimated
Estimated
open
pitches
establishments
Occupancy
rate
per pitch
Employed
personnel
Costa Brava
52,397
60,021
184,412
510,309
6.18
85
32,811
35.23
1,735
Costa Daurada
71,210
24,435
305,063
280,574
6.12
46
21,391
49.78
872
Costa Blanca
15,408
11,961
81,762
216,586
10.90
37
8,133
64.34
521
Costa Barcelona
39,523
18,797
142,112
107,572
4.28
37
11,998
47.81
419
pn Aiguamolls de i'Empordá
6,140
21,307
47,857
200,185
9.04
18
8,337
43.57
438
Costa de Castellón
9,875
11,371
55,873
99,756
7.33
30
5,893
50.01
279
Costa de la Luz (Cádiz)
22,085
6,275
75,992
19,361
3.36
25
6,367
24.59
255
Pirineus
30,653
2,894
76,644
8,332
2.53
76
10,307
38.17
359
Costa del Sol
8,685
6,495
31,367
46,394
5.12
15
3,623
39.55
167
Costa Valencia
9,013
6,023
41,397
29,975
4.75
18
4,368
46.68
181
Terres de l'Ebre
6,694
3,925
44,775
16,639
5.78
14
2,712
35.79
122
10,395
6,133
46,730
12,005
3.55
31
5,803
28.54
158
9,964
2,171
50,577
5,871
4.65
6
4,079
23.62
102
13,511
8,360
32,924
20,067
2.42
50
6,424
23.81
282
3,440
3,752
13,498
36,040
6.89
9
3,842
27.47
147
(Asturias)
Costa de la Luz (Huelva)
PIRINEO ARAGONES
Costa Cálida
7. Travellers, overnight stays, average stay, open establishments, capacity, occupancy
and number of staff from tourist sites with the greatest number at overnights stays
Tourist sites
Travellers
Residents
in
Overnight stays
Residents
abroad
Spain
Residents
in
Residents
abroad
Average
stay
Estimated
Estimated
open
pitches
establishments
Occupancy
rate
per pitch
Employed
personnel
Spain
Benidorm
3,053
5,923
18,120
159,136
19.75
10
4,106
79.71
283
Mont-Roig Del Camp
5,535
8,935
45,920
101,041
10.16
6
4,237
47.27
168
Torroella De Montgrí
2,601
9,795
13,905
95,612
8.83
8
4,248
40.19
288
Sant Pere Pescador
2,053
9,042
7,928
98,042
9.55
6
3,188
46.87
232
Salou
7,965
2,772
43,942
56,446
9.35
3
2,141
61.22
102
Castelló D'Empúries
1,939
5,620
22,456
66,789
11.81
4
2,807
50.92
123
12,932
2,799
64,284
24,478
5.64
6
3,023
57.32
221
Tarragona
Blanes
7,806
5,537
26,628
52,102
5.90
11
3,675
45.44
238
Cambrils
11,129
3,568
49,278
27,142
5.20
6
3,253
52.20
101
Calonge
3,942
3,182
24,462
33,293
8.11
4
2,805
27.83
121
Vilanova I La Geltrú
5,797
6,207
13,556
43,996
4.79
3
2,643
42.85
100
Roda De Barà
5,684
1,404
25,062
20,300
6.40
3
2,045
36.99
48
COS (TABLES ANNEX) - SEPTEMBER 2016 (3/4)
Provisional data
8. Travellers and overnight stays by countries of residence
Countries
Travellers
Total
TOTAL
Residents in Spain
Residents abroad
TOTAL residents abroad
TOTAL residents in E.U. (excluding Spain)
- Germany
- Austria
- Belgium
- Denmark
- Finland
- France
- Greece
- Ireland
- Italy
- Luxembourg
- Netherlands
- Poland
- Portugal
- United Kingdom
- Czech Republic
- Sweden
- Other EU countries
Norway
Russia
Switzerland
Other European countries
United States of America
Rest of America
African countries
Other countries
Overnight stays
Total
%
%
734,286
100.00
3,335,362
100.00
458,328
275,958
275,958
257,876
55,711
2,815
11,212
2,815
665
72,875
25
4,329
5,487
501
41,824
4,034
8,793
40,495
1,358
2,656
2,280
592
202
9,467
2,276
680
1,409
136
3,319
62.42
37.58
100.00
93.45
20.19
1.02
4.06
1.02
0.24
26.41
0.01
1.57
1.99
0.18
15.16
1.46
3.19
14.67
0.49
0.96
0.83
0.21
0.07
3.43
0.82
0.25
0.51
0.05
1.20
1,666,517
1,668,845
1,668,845
1,589,279
347,687
8,416
82,451
15,518
4,127
345,136
26
23,558
18,381
2,865
330,051
23,320
18,569
346,693
2,755
13,740
5,987
4,313
780
47,850
9,912
1,343
4,001
928
10,441
49.97
50.03
100.00
95.23
20.83
0.50
4.94
0.93
0.25
20.68
0.00
1.41
1.10
0.17
19.78
1.40
1.11
20.77
0.17
0.82
0.36
0.26
0.05
2.87
0.59
0.08
0.24
0.06
0.63
* Non-significant data
COS (TABLES ANNEX) - SEPTEMBER 2016 (4/4)
Provisional data
Tourist accommodation occupancy survey
(Rural tourist accommodation)
September 2016
Provisional data
1. Number of travellers, overnight stays and average stay by Autonomous City and
Community
Autonomous
Communities
TOTAL
Andalucía
Aragón
Asturias, Principado de
Balears, Illes
Canarias
Cantabria
Castilla y León
Castilla-La Mancha
Cataluña
Comunitat Valenciana
Extremadura
Galicia
Madrid, Comunidad de
Murcia, Región de
Navarra, Comunidad Foral de
País Vasco
Rioja, La
Ceuta
Melilla
Annual rate
Cumulative annual rate
Number of travellers
Total
Residents
In Spain
Residents
abroad
Number of overnight stays
Total
Residents
In Spain
Residents
abroad
Average
stay
339,488
25,037
13,190
22,846
34,187
5,980
23,631
60,708
20,560
32,520
10,065
13,140
27,144
14,270
3,275
13,349
16,742
2,843
-
250,565
13,962
11,485
20,531
3,780
2,946
20,865
51,507
19,736
27,007
9,290
11,899
16,438
12,573
2,870
10,049
13,212
2,414
-
88,923
11,075
1,704
2,315
30,407
3,034
2,766
9,201
825
5,513
775
1,241
10,706
1,697
405
3,301
3,529
429
-
866,672
95,568
31,401
68,462
145,277
27,300
54,681
118,390
40,898
78,667
25,350
28,379
49,867
24,143
7,250
24,941
40,473
5,627
-
553,606
31,064
26,418
61,381
10,627
8,358
48,751
103,393
39,623
59,332
21,388
25,356
32,400
21,785
6,102
20,903
31,876
4,850
-
313,066
64,504
4,984
7,081
134,650
18,943
5,930
14,997
1,275
19,335
3,962
3,023
17,467
2,358
1,147
4,037
8,597
776
-
2.55
3.82
2.38
3.00
4.25
4.57
2.31
1.95
1.99
2.42
2.52
2.16
1.84
1.69
2.21
1.87
2.42
1.98
-
10.28
11.78
9.00
9.89
14.05
19.90
11.50
13.08
6.77
10.88
21.00
19.27
1.11
1.17
2. Open rural establishments, bed-places, occupancy rates and employed
personnel by Autonomous City and Community
Autonomous
Communities
TOTAL
Andalucía
Aragón
Asturias, Principado de
Balears, Illes
Canarias
Cantabria
Castilla y León
Castilla-La Mancha
Cataluña
Comunitat Valenciana
Extremadura
Galicia
Madrid, Comunidad de
Murcia, Región de
Navarra, Comunidad Foral de
País Vasco
Rioja, La
Ceuta
Melilla
Annual rate
Cumulative annual rate
Estimated
Estimated
Occupancy rate
Employed
Of bed-places Of bed-places Of bedrooms personnel
open
bed-places
rural
at weekend
establishments
16,419
156,985
18.28
31.09
22.80
24,361
1,765
14,838
21.41
30.00
29.40
2,417
1,232
9,666
10.80
22.75
13.91
1,352
1,386
13,510
16.86
23.55
21.05
1,763
368
7,158
66.46
65.11
73.13
2,540
585
3,683
24.64
26.37
37.66
855
432
7,162
24.98
46.13
28.66
768
3,427
30,418
12.94
28.14
16.46
4,602
1,546
13,838
9.83
25.83
13.38
1,925
2,094
17,319
15.10
32.34
19.09
2,840
929
9,529
8.86
19.14
15.36
1,273
584
7,054
13.39
25.97
16.97
863
540
6,896
23.91
34.49
25.75
977
230
3,615
22.10
50.72
27.59
532
151
2,250
10.73
21.64
14.45
251
655
4,789
17.28
33.67
20.48
825
378
4,167
32.07
46.11
35.95
441
116
1,092
17.09
38.36
17.80
137
2.78
3.56
7.48
-0.52
10.45
2.92
1.65
2.86
9.48
7.63
11.46
2.69
EOTR (TABLES ANNEX) - SEPTEMBER 2016 (1/4)
The 31st of October of 2016
3. Number of travellers, overnight stays and average stay in Provinces with
the greatest number of overnight stays1
Provinces
Number of travellers
Total
Number of overnight stays
Residents
Residents
In Spain
abroad
Total
Average
Residents
Residents
In Spain
abroad
stay
Málaga
10,029
3,524
6,504
54,627
8,668
45,959
5.45
Girona
14,321
11,684
2,637
34,000
24,922
9,078
2.37
Barcelona
9,290
8,024
1,266
24,642
18,908
5,734
2.65
Gipuzkoa
8,081
6,262
1,819
22,516
17,161
5,355
2.79
Ávila
9,274
8,593
681
21,849
20,551
1,298
2.36
Cáceres
9,950
9,110
840
21,777
19,396
2,382
2.19
11,566
6,668
4,898
21,157
12,786
8,371
1.83
Santa Cruz de Tenerife
4,289
1,948
2,341
20,786
5,740
15,045
4.85
Huesca
7,021
6,072
949
18,589
15,199
3,390
2.65
10,823
7,308
3,515
17,774
13,421
4,353
1.64
Burgos
9,998
7,201
2,797
16,403
12,980
3,423
1.64
Segovia
8,305
7,901
404
15,319
14,567
752
1.84
Lleida
5,892
5,082
810
13,271
10,999
2,272
2.25
Pontevedra
5,641
3,545
2,096
12,185
7,774
4,411
2.16
Soria
5,970
5,852
118
11,671
11,456
215
1.96
Coruña, A
León
4. Open rural establishments, bed-places, occupancy rates and employed personnel
in Provinces with the highest number of overnight stays1
Provinces
Estimated
Estimated
Occupancy rate
open
bed-places
Of bed-places
rural
Employed
Of bed-places
Of bedrooms
personnel
at weekend
establishments
Málaga
822
5,471
33.18
39.44
45.68
1,011
1,087
Girona
724
6,028
18.78
40.18
22.81
Barcelona
554
4,829
16.93
36.69
21.46
790
Gipuzkoa
169
1,958
37.98
50.93
41.57
223
Ávila
689
5,657
12.86
30.29
17.38
877
Cáceres
478
5,776
12.55
25.44
15.81
687
Coruña, A
162
2,003
34.81
47.93
37.52
329
Santa Cruz de Tenerife
477
2,789
24.78
25.06
38.52
669
Huesca
663
5,050
12.26
24.02
15.64
729
León
470
3,941
14.94
26.07
18.84
706
Burgos
391
3,802
14.33
27.46
18.09
471
Segovia
425
3,894
13.09
34.33
14.95
579
Lleida
543
4,021
10.97
23.75
13.58
639
Pontevedra
160
1,977
20.45
29.79
22.68
249
Soria
332
3,059
12.65
32.93
14.08
411
1
Provinces belonging to uniprovincial Autonomous Communities have not been included because they are reflected in previous tables.
EOTR (TABLES ANNEX) - SEPTEMBER 2016 (2/4)
Provisional data
5. Number of travellers, overnight stays, average stay, capacity and occupancy rates in areas
with the highest number of overnight stays
Areas
Number of travellers
Number of overnight stays
Residents
Residents
Residents
Residents
Average Estimated
Capacity
Estimated
Occupancy rate
In Spain
abroad
In Spain
abroad
stay
bed-places bed-places places
open rural
Of
Of bed-
establishments
Isla de Mallorca
Of bedrooms
at weekend
2,161
25,752
4,995
115,840
4.33
312
5,945
66.40
63.55
73.21
10,662
1,107
24,037
4,295
2.41
805
6,225
15.11
34.71
17.44
Costa Verde
7,812
951
23,668
2,202
2.95
467
5,229
16.44
25.65
19.20
Pirineo Navarro
9,484
3,389
19,474
4,081
1.83
583
4,148
18.84
35.27
22.55
Costa Brava
6,957
2,185
14,791
8,082
2.50
437
3,769
20.20
38.98
24.48
P.Natural Sierras de Tejeda,
Almijara y Alhama
588
3,416
2,074
18,780
5.21
223
1,450
47.93
49.22
61.87
P.Nacional Picos de Europa
5,792
804
16,337
2,271
2.82
274
2,764
22.33
36.12
28.22
Pirineo Aragonés
5,378
993
13,639
3,589
2.70
620
4,679
12.26
23.83
16.03
Extremadura Norte
6,955
557
14,939
1,489
2.19
320
3,908
13.99
27.65
17.13
Rías Baixas
4,210
2,394
9,464
5,148
2.21
135
1,665
29.06
40.50
31.86
Isla de Menorca
1,267
2,153
4,352
8,124
3.65
27
600
68.97
71.56
76.32
69.17
Pirineus
352
2,503
1,280
10,686
4.19
29
613
64.54
73.93
Pirineo Vasco
Islas de Ibiza-Formentera
3,480
859
8,858
2,105
2.53
122
1,332
27.12
40.08
30.48
Isla de Tenerife
1,455
1,421
3,062
7,501
3.67
118
1,223
28.68
31.48
36.97
P.Natural de Corona Forestal
1,229
1,158
2,592
6,141
3.66
89
960
30.18
34.10
40.17
6. Number of travellers, overnight stays, average stay, capacity, occupancy rates and employed
personnel per rural house by Autonomous City and Community2
Autonomous
Communities
Number of travellers
Number of overnight stays
Capacity
Occupancy rate
Employed
Of
personnel
Residents
Residents
Residents
Residents
Average Estimated
Estimated
In Spain
abroad
In Spain
abroad
stay
bed-places bed-places places
open rural
Of bed-
establish.
TOTAL
at weekends
155,461
41,849
351,988
153,346
2.56
13,876
113,441
14.80
27.91
17,675
13,962
11,075
31,064
64,504
3.82
1,765
14,838
21.41
30.00
2,417
Aragón
9,041
1,412
19,612
3,434
2.20
965
7,521
10.19
22.71
1,030
Asturias, Principado de
6,234
260
17,646
669
2.82
866
5,570
10.95
18.16
974
Balears, Illes
1,496
5,989
3,435
20,537
3.20
87
1,273
62.74
62.42
318
Canarias
1,177
1,462
4,774
11,845
6.30
556
2,855
19.35
20.73
699
Cantabria
4,764
199
13,025
909
2.81
186
2,623
17.52
34.75
246
26,357
1,743
61,722
5,219
2.38
3,004
21,585
10.32
24.72
3,503
Andalucía
Castilla y León
Castilla-La Mancha
18,852
817
38,012
1,249
2.00
1,518
13,212
9.88
26.02
1,886
Cataluña
27,007
5,513
59,332
19,335
2.42
2,094
17,319
15.10
32.34
2,840
Comunitat Valenciana
7,273
655
18,280
3,498
2.75
890
7,419
9.77
20.91
1,161
Extremadura
4,415
420
9,465
1,137
2.19
343
3,406
10.36
22.04
412
10,791
6,293
22,421
10,945
1.95
396
4,820
22.86
33.45
653
1,937
148
4,692
178
2.34
75
847
19.13
41.17
108
Galicia
Madrid, Comunidad de
Murcia, Región de
1,899
155
4,654
644
2.58
137
1,880
9.38
21.54
212
10,049
3,301
20,903
4,037
1.87
655
4,789
17.28
33.67
825
País Vasco
7,792
1,978
18,100
4,428
2.31
222
2,392
30.99
46.61
256
Rioja, La
Navarra, Comunidad Foral de
2,414
429
4,850
776
1.98
116
1,092
17.09
38.36
137
Ceuta
-
-
-
-
-
-
-
-
-
-
Melilla
-
-
-
-
-
-
-
-
-
-
2
To facilitate the comparability between data from different Autonomous Communities (and because of the different regulation and different
characteristics), a group called rural house has been created, with those establishments with similar typology (location, capacity, etc…).
The variables included in the previous table have been estimated with that type of establishments.
EOTR (TABLES ANNEX) - SEPTEMBER 2016 (3/4)
Provisional data
7. Travellers and overnight stays by country of residence
Results by countries
Provisional data
Travellers
Total
Overnight stays
Total
%
%
TOTAL
339,488
100.00
866,672
100.00
Residents Spain
250,565
73.81
553,606
63.88
Residents abroad
88,923
26.19
313,066
36.12
Total Residents abroad
88,923
100.00
313,066
100.00
Total Residents in EU (excluding Spain)
- Germany
- Belgium
- France
- Italy
- Netherlands
- Portugal
- United Kingdom
Switzerland
Other European countries
United States of America
Other countries
65,978
21,994
2,920
9,454
2,052
6,297
1,232
17,855
3,542
6,948
5,698
10,930
74.20
24.73
3.28
10.63
2.31
7.08
1.39
20.08
3.98
7.81
6.41
12.29
257,055
105,581
10,092
25,810
4,949
27,220
2,373
68,682
15,272
19,023
10,598
23,467
82.11
33.72
3.22
8.24
1.58
8.69
0.76
21.94
4.88
6.08
3.39
7.50
EOTR (TABLES ANNEX) - SEPTEMBER 2016 (4/4)
Provisional data
Tourist Accomodation Occupancy Survey
Hostels Occupancy Survey (HOS)
September 2016 Provisional data
1. Travellers, overnight stays and average stay by Autonomous Cities and Communities
Autonomous cities and
communities
Travellers
Total
Residents
in
Spain
Residents
abroad
Overnight stays
Total
Residents
in
Spain
Residents
eabroad
Average
stay
TOTAL
77,765
45,464
32,301
166,738
92,138
74,600
2.14
Andalucía
Aragón
Asturias, Principado de
Balears, Illes
Canarias
Cantabria
Castilla y León
Castilla - La Mancha
Cataluña
Comunitat Valenciana
Extremadura
Galicia
Madrid, Comunidad de
Murcia, Región de
Navarra, Comunidad Foral de
País Vasco
Rioja, La
Ceuta
Melilla
11,057
1,366
775
837
1,918
2,463
33,520
9,462
749
571
1,005
3,019
9,911
379
12.04
4.68
8,462
1,181
432
592
1,660
2,289
15,392
5,016
693
441
741
1,417
6,263
329
14.56
8.07
2,595
185
343
245
258
174
18,128
4,446
56
130
264
1,601
3,648
50
8.67
-2.15
23,680
2,439
982
1,411
4,721
4,255
79,276
21,080
1,348
973
1,812
4,898
17,681
553
5.36
6.16
17,933
2,174
604
1,165
4,309
3,996
32,221
11,205
1,239
814
1,438
2,745
10,600
499
6.41
8.55
5,747
265
378
246
412
258
47,055
9,875
109
159
374
2,154
7,081
54
4.09
1.03
2.14
1.79
1.27
1.69
2.46
1.73
2.37
2.23
1.80
1.70
1.80
1.62
1.78
1.46
-5.96
1.42
Annual rate
Cumulative annual rate
2. Open establishments, capacity, occupancy and number of
staff by autonomous cities and communities
Autonomous cities and
Capacity
communities
Estimated
Estimated
open
bed-places
establishments
TOTAL
Andalucía
Aragón
Asturias, Principado de
Balears, Illes
Canarias
Cantabria
Castilla y León
Castilla - La Mancha
Cataluña
Comunitat Valenciana
Extremadura
Galicia
Madrid, Comunidad de
Murcia, Región de
Navarra, Comunidad Foral de
País Vasco
Rioja, La
Ceuta
Melilla
Annual rate
Cumulative annual rate
Occupancy rate
Of bed-places Of bed-places
at weekend
Employed
personnel
192
22,951
24.22
32.38
1,663
16
17
4
5
21
24
39
13
8
3
3
10
19
5
-4.47
-3.51
3,270
1,563
322
343
1,873
2,675
5,928
2,109
650
285
286
872
2,258
227
-3.03
-3.45
24.14
5.20
10.17
13.71
8.40
5.30
44.58
33.31
6.92
11.40
21.11
18.72
26.11
8.12
8.65
9.71
33.67
11.46
13.49
23.23
14.96
8.45
54.95
45.83
14.21
21.04
33.47
19.20
34.22
20.95
1.95
8.06
200
88
37
24
107
106
401
116
60
78
168
67
164
11
-1.29
-5.30
HOS (TABLES ANNEX) - SEPTEMBER 2016 (1/2)
31th October 2016
3. Travellers and overnight stays by countries of residence
Countries
Travellers
Total
Overnight stays
%
Total
Average
stay
%
TOTAL
77,765
100.00
166,738
100.00
2.14
Residents in Spain
Residents abroad
TOTAL residents abroad
TOTAL residents in E.U. (excluding Spain)
- Germany
- Belgium
- France
- Italy
- Netherlands
- Portugal
- United Kingdom
Switzerland
Other European countries
United States of America
Other countries
45,464
32,301
32,301
21,406
5,033
1,128
4,153
3,077
877
902
2,924
411
5,089
1,271
7,434
58.46
41.54
100.00
66.27
15.58
3.49
12.86
9.52
2.72
2.79
9.05
1.27
15.75
3.94
23.02
92,138
74,600
74,600
49,786
13,004
2,702
8,464
7,105
2,073
1,987
6,730
989
11,892
2,692
16,962
55.26
44.74
100.00
66.74
17.43
3.62
11.35
9.52
2.78
2.66
9.02
1.33
15.94
3.61
22.74
2.03
2.31
2.31
2.33
2.58
2.39
2.04
2.31
2.36
2.20
2.30
2.40
2.34
2.12
2.28
HOS (TABLES ANNEX) - SEPTEMBER 2016 (2/2)
Provisional data
HOLIDAY DWELLING PRICE INDEX (HDPI)
September 2016
Provisional data
National general index and breakdown by rates
Index
Annual
variation rate
134.57
125.89
122.50
143.42
TOTAL
Normal
Weekend
Tour-operators and travel agencies
8.25
7.11
3.11
9.97
National general index and breakdown by modalities
Index
TOTAL
Studio
Dwellings 2/4 bedplaces
Dwellings 4/6 bedplaces
HDPI (ANNEX OF TABLES) - SEPTEMBER 2016
Annual
variation rate
134.57
134.02
134.27
135.99
8.25
9.05
8.18
8.01
31st october 2016
Tourist Campsite Price Index (TCSPI). 2002 Base
September 2016
Provisional data
National general index and breakdown by rates
Index
Annual
variation rate
134.19
131.33
125.37
139.52
101.00
TOTAL
Normal rate
Special rate for stays up to one month
Special rate for stays longer than one month
Bungalow rate*
0.79
0.80
1.73
-1.15
1.71
National general index and breakdown by categories
Index
TOTAL
Luxury and first
Second
Third
*2014 Base
TCSPI (ANNEX OF TABLES) - SEPTEMBER 2016
Annual
variation rate
134.19
126.34
138.83
154.50
0.79
0.30
1.23
1.69
31st october 2016
Rural Tourism Accommodation Price Index (RTAPI)
September 2016
Provisional data
General Autonomous Cities and Communities
and national indices
Index
Annual variation
rate
TOTAL
Andalucía
Aragón
Asturias, Principado de
Balears, Illes
Canarias
Cantabria
Castilla y León
Castilla - La Mancha
Cataluña
Comunitat Valenciana
Extremadura
Galicia
Madrid, Comunidad de
Murcia, Región de
Navarra, Comunidad Foral de
País Vasco
Rioja, La
Ceuta
Melilla
133.59
131.73
159.96
117.02
134.22
110.39
151.63
124.70
126.88
128.30
123.50
105.31
123.47
134.10
125.33
171.46
135.18
115.47
-
1.57
1.58
0.28
1.64
2.74
0.63
-0.32
0.81
3.46
2.36
-2.63
-1.95
-0.17
-0.01
1.19
-6.31
4.71
0.92
-
National general index and breakdown by rates
Index
TOTAL
Normal
Weekend
Annual variation
rate
133.59
1.57
135.03
1.86
134.32
1.29
National general index and breakdown by rent modality
Index
TOTAL
Shared use (in case of per room rent modality)
Full use (rent of entire dwelling)
RTAPI (ANNEX OF TABLES) - SEPTEMBER 2016
Annual variation
rate
133.59
1.57
129.81
2.07
134.88
1.07
31st october 2016
© Copyright 2026