
Marketletter 2Q16 Annex
Marketletter 2Q16 Annex
Version 1.0
08/12/2016
1
Marketletter 2Q16
Summary
Page
IV. Eletrobras Companies Information
03
V. Market Data of Eletrobras Companies
70
VI. Generation Data
71
VII. Transmission Data
76
VIII. Distribution Data
82
IX. Employees
84
X. Investments
85
103
XI. SPEs Data
Conference Call in
Portuguese
August 16, 2016
2:00 PM (Brasília)
1:00 PM (New York)
6:00 PM (London)
Phone: +55 (11) 3137-8030
Password: 9532
Conference Call in English
August 16, 2016
2:00 PM (Brasília)
1:00 PM (New York)
6:00 PM (London)
Phone: +1 786 837 9597
(New York)
(+44) 20 3318 3776
(London)
Senha: 9532
IR Contact:
[email protected]
www.eletrobras.com/elb/ri
Tel: (55) (21) 2514-6333
Preparation of the
Marketletter:
Assistant Chief Financial
and Investor Relations:
Arlindo Soares Castanheira
Investor Relations
Department:
Paula Prado Rodrigues Couto
Market Reports Division:
Bruna Reis de Arantes
Fernando D’Angelo Machado
Bernardo Pinheiro Lobato de
Magalhães
Luiz Gustavo Braga Parente
2015
ELET3 & ELET6
2
Marketletter 2Q16
IV. Eletrobras Companies Information
IV.1 Financial Statements with Consolidation Purposes
The financial statements presented below have been adjusted for standardization purposes and to to reflect the Eletrobras consolidated statements.
ASSETS 06/30/2016
CURRENT
Cash and Cash Equivalent
Clients (Consumers and Resellers)
Financing and Loans
Marketable Securities
Dividends to Receive (Remuneration
of Equity Participations)
Deferred Fiscal Assets (Tax and
Contributions)
Income Tax and Social Contribution
Derivatives
Reimbursement Rights
Linked Deposits
Stored Materials
Amounts to Receive - 12,783/2013
Law
Nuclear Fuel Storage
Financial Asset
Hydrological risk
Others
CURRENT TOTAL
Furnas
Chesf
Eletrosul
19,176
590,338
1,041
924,033
148,800
358,931
2,419
6,501
26,138
192,503
1,492
144,879
72,015
36,103
22,184
205,964
33,547
Eletronorte
Eletropar
Eletronuclear
CGTEE
Amazonas GT
18,534
1,279,682
509,030
2,537
49,875
1,786
212,731
108,157
17,468
236,937
-
40,490
647,316
220,374
5,556
-
964
-
-
-
12,451
74,865
69,800
78,887
5,055
17,447
42,526
37,738
206,027
72,602
108,931
3,387
-
17,415
124,753
10,369
16,360
34,679
5,992
32,730
111,380
1,979,678
2,378,862
128,281
917,038
1,270,924
54,744
2,007
530,085
758,334
304,117
34,313
2,533,236
2,818,216
56,763
60,531
402,453
867,295
949,756
315,813
322,903
11,414
958,316
973,285
-
-
-
-
-
-
-
-
-
-
-
-
-
-
-
-
537,842
929
-
2,630
1,607
181,773
695,773
2,126
42
4,275
3,485
250
38,568
3,416
-
33,659
-
NON-CURRENT
LONG-TERM ASSET
Financial Asset – Itaipu (Parent
Company)
Fuel Consumption Account (Parent
Company)
Dividends to Receive (Equity
Participation Remuneration)
Clients (Consumers and Resellers)
Financing and Loans - principal
Marketable Securities
Diferred Fiscal Asset (Taxes and
3
Marketletter 2Q16
Contributions)
Income Tax and Social Contribution
Derivatives
Reimbursement Rights
Linked Deposits
Financial Asset
Financial Asset – Indemnitiable
Concessions (Generation)
Advance for equity participation
Hydrological risk
Others
LONG-TERM ASSET TOTAL
763,209
19,844,738
1,170,665
13,290,708
153,512
3,138,933
288,528
68,936
508,498
8,961,897
55
-
61,720
736,121
5,272
-
67,887
-
1,213,707
67,517
270,409
215,348
22,913,699
716,002
396,365
199,641
15,959,391
927,940
23,583
106,097
5,052,281
109,188
210,119
2,348,195
12,537,664
1,384
4,855
474,645
1,272,486
158,330
197,261
7,713
9,070
84,670
INVESTIMENTS
6,647,912
4,671,994
2,115,959
4,499,560
111,361
-
-
-
FIXED ASSET
5,778,388
1,667,155
3,239,276
6,899,197
29
5,183,984
1,398,881
1,890,046
115,091
62,132
216,263
160,852
23
57,203
2,535
5,357
35,455,090
22,360,672
10,623,779
24,097,273
116,268
6,513,673
1,598,677
1,980,073
37,833,952
23,631,596
11,382,113
26,915,489
176,799
7,463,429
1,921,580
2,953,358
INTANGIBLE ASSET
NON-CURRENT ASSET TOTAL
ASSET TOTAL
4
Marketletter 2Q16
LIABILITIES 06/30/2016
CURRENT
Suppliers
Loans and Financing - principal
Loans and Financing - charges
Bonds
Tax and Social Contributions
Income Tax and Social Contribution
Derivatives
Reimbursement Obligations
Advance to clients (Early Energy
Sale)
Shareholders Remuneration
(dividends to pay)
Estimated Obligations
Provisions for Contingencies
Post-Employment Benefit
(Complementary Pension Fund)
Leasing
Onerous Contracts
Concessions to Pay - UBP
Sector Charges (statutory tax)
Others
CURRENT TOTAL
NON-CURRENT
Shareholders Remuneration
(dividends to pay)
Suppliers
Loans and Financing - principal
Bonds
Tax and Social Contributions
Income Tax and Social Contribution
Derivatives
Reimbursement Obligations
Advance to clients (Early Energy
Sale)
Estimated Obligations
Provisions for Contingencies
Provision for uncovered liability in
invested company
Furnas
Chesf
Eletrosul
Eletronorte
Eletropar
Eletronuclear
CGTEE
Amazonas GT
425,032
976,870
257,329
249,803
24,986
-
393,890
341,292
12,990
89,860
32,314
-
96,765
753,072
65,086
67,892
43
-
547,984
635,432
33,508
13,650
222,705
207,755
113
-
72
413
-
580,200
324,502
21,548
62,878
-
191,963
333,291
12,492
14,081
-
186,417
1,076,469
23,425
84,092
9,114
-
-
-
-
60,504
-
-
-
-
187,947
-
212,225
28,118
41,875
74,655
-
86,789
194,055
-
316
300
102,205
-
79,970
12,052
51,646
19,127
-
8,659
923
109,610
373,318
2,614,477
27,081
123,378
124,580
1,385,728
7,415
2,417
44,571
216,440
1,370,231
9,073
295,816
1,261,079
3,568,463
3,930
5,031
2,730
5,626
258,152
1,357,841
1,305
31,373
728,173
9,780
583,481
1,991,905
9,342,778
548,551
4,512,900
-
1,047,823
20,777
2,996,148
-
3,616,189
17,587
391,535
-
253,166
4,332,327
188,581
53,743
-
15,976
-
7,241,695
-
18,920
2,229,888
-
429,127
-
46,022
840,524
51,948
1,770,378
5,166
90,871
623,456
11,219
899,631
-
52,657
198,129
1,262
-
55,570
-
-
261,137
-
-
-
-
-
5
Marketletter 2Q16
Post-Employment Benefit
(Complementary Pension Fund)
Leasing
Provision for Onerous Contracts
Concessions to Pay - UBP
Sector Charges (statutory tax)
Obligations for asset demobilization
(Nuclear Power Plants)
Advance for future capital Increase
Others
NON-CURRENT TOTAL
182,247
868,224
36,131
130,963
1,234,673
225,428
278,623
185,382
25,126
-
25,591
239,382
-
-
49,048
1,677,269
-
7,112
4,333
95
-
46,587
2
16,554,929
101,229
7,727,027
3
108,230
4,701,226
2,133,783
8,760,879
1,356
17,332
1,242,516
21,108
10,482,422
455,409
2,716,924
520,336
1,005,128
6,531,154
5,053,045
8,470,346
(1,391,023)
9,753,953
4,916,199
1,484,606
(1,651,843)
4,359,226
163,948
903,225
(129,475)
11,576,263
354,075
2,681,955
(26,146)
118,054
481
3,711
32,190
6,607,258
(10,902,889)
(81,203)
845,510
2,596
(2,330,597)
(41,026)
436,750
(479,548)
(877)
1,024
15,926
13,732
-
-
-
-
-
STOCKHOLDERS’ EQUITY TOTAL
18,664,546
14,518,841
5,310,656
14,586,147
154,436
(4,376,834)
(1,523,517)
(43,675)
LIABILITIES AND
STOCKHOLDERS’ EQUITY TOTAL
37,833,952
23,631,596
11,382,113
26,915,489
176,799
7,463,429
1,921,580
2,953,358
STOCKHOLDERS’ EQUITY
Social Capital
Capital Reserves
Profit Reserves
Additional Dividend Purposed
Profit/Losses Accumulated
Others Comprehensive Income
Non-controlling shareholders
Participation
6
Marketletter 2Q16
STATEMENT OF INCOME 06/30/2016
Operational Revenues
Electric Energy Supply – sale to Distribution
Companies
Electric Energy Supply - Generation
Short Term Electric Energy
Renewed Plants Operation and Maintenance
Revenue
Construction Plants Revenue
Renewed Lines Operation and Maintenance
Revenue
Operation and Maintenance Revenue
Construction Revenue - Transmission
Financial – Return on Investment T
Others Operational Revenues
Deductions to Operational Revenues
Operational Expenses
Personnel, Material and Services
Energy Purchased for Resale
Charges on eletric grid Usage
Construction
Fuel used to produce electric energy
Remuneration and Reimbursement (Royalties
– Hydric Resources)
Depreciation and Amortization
Operating Provisions
Others
OPERATING RESULT BEFORE FINANCIAL
RESULT
Furnas
Chesf
Eletrosul
Eletronorte
Eletropar
15,421,565
10,337,899
2,238,736
5,490,068
355
1,726,231
63,431
86,521
391,908
30,608
225,928
132,351
1,417,135
528,754
223,567
402,854
(18,385)
613,354
18,878
-
539,884
32,698
230,189
12,796,767
17,022
456,913
31,679
360,929
8,641,319
28,789
(369,126)
Eletronuclear
CGTEE
Amazonas GT
1,276,714
243,839
156,856
-
1,450,851
-
265,078
-
268,348
-
7,289
-
-
-
-
-
309,956
49,641
58,825
1,540,349
12,065
219,787
1,966
135,743
3,191,931
98,473
355
-
2,169
-
(322,999)
(90,379)
(334,577)
-
(174,137)
(23,408)
(111,492)
(2,188,470)
(1,725,752)
(571,855)
(1,810,236)
(3,648)
(4,985,892)
(341,831)
(238,013)
(906,428)
(277,271)
(234,832)
(211,804)
(222,467)
(584,385)
(194,757)
(318,434)
(379,807)
(7,803)
(253,160)
(129,325)
(11,607)
(58,825)
-
(750,106)
(83,739)
(247,306)
(135,743)
(3,717)
(1,986)
-
(362,676)
(43,731)
(193,035)
(131,125)
(94,561)
(20,669)
(22,933)
(77,385)
(5,417)
103,909
(70,223)
(137,781)
31,523
(159,187)
(4,839)
(50,659)
(80,394)
(103,674)
(6,716)
(82,116)
(7,053)
(23,053)
(109,092)
(225,644)
(161,127)
(93,762)
(15)
(771)
(876)
(197,522)
(4,123,190)
(65,738)
(36,247)
(5,974)
(30,322)
(1,500)
(31,670)
(648)
(225,302)
13,233,095
8,613,147
1,666,881
3,679,832
(3,293)
(3,709,178)
(97,992)
(81,157)
54,440
31,850
36,010
-
22,005
-
62,139
-
4,913
-
883
-
1,844
-
12,418
-
FINANCIAL REVENUES (EXPENSES)
Revenue from financial investments
Interest, Commission and Rates revenue
7
Marketletter 2Q16
(loans and financing)
Debt Charges
Charges – shareholders remuneration
Moratorium Increase on electric energy
Net Monetary Updates
Net Exchange Updates
Others Financial Revenues
Others Financial Expenses
Derivatives
FINANCIAL RESULT
EQUITY PARTICIPATION RESULT
RESULT BEFORE SOCIAL CONTRIBUTION,
INCOME TAX, EMPLOYEES AND
MANAGEMENT PARTICIPATION AND
MINORITY PARTICIPATION
Income Tax and Social Contribution and
Fiscal Incentives Revenue
RESULT BEFORE EQUITY
PARTICIPATIONS
Minority Participation
NET PROFIT OF THE PERIOD
(495,773)
8,553
(119,463)
87,325
54,943
(77,908)
-
(71,228)
46,483
8,234
57,853
(28,791)
-
(241,027)
(2,601)
(3,248)
42,002
48,636
(51,139)
-
(313,002)
53,608
61,852
91,478
23,212
(21,632)
121,641
(603)
-
(44,791)
(38,868)
(41,806)
3,278
(122,971)
-
(209,225)
(5,042)
2,621
115
260
(5,470)
-
(123,676)
(22,192)
6,884
(14,389)
-
(456,033)
48,561
(185,372)
79,296
4,310
(244,275)
(214,897)
(140,955)
37,983
33,105
(72,534)
29,122
2,983
-
-
-
12,815,045
8,694,813
1,408,975
3,788,250
4,212
(3,953,453)
(312,889)
(222,112)
(4,344,718)
(2,957,481)
(501,086)
(1,106,295)
(413)
(72,249)
-
(14,230)
8,470,327
5,737,332
907,889
2,681,955
3,801
(4,025,702)
(312,889)
(236,342)
8,470,327
5,737,332
907,889
2,681,955
3,801
(4,025,702)
(312,889)
(236,342)
8
Marketletter 2Q16
CASH FLOW 06/30/2016
Operating Activities
Profit (loss) before income tax and social contribution
Depreciation and Amortization
Net monetary variation
Net exchange variation
Financial Charges
Equity Result
Provision for uncovered liability
Provision for doubtful credit liquidation
Provisions for contingencies
Provision for staff realignment
Provision for loss with Investments
Provision for reduction on recoverable amount of
Investment
Provision for onerous contracts
Provision for loss with Financial Asset
Global reversal reserve charges
Adjustment to Present Value / Market Value
Minority Participation in Result
Charges on Shareholders funds
Financial Asset Revenue
Derivatives
Others
(Increase) decrease on operating
asset/liability
Cash from Operating Activities
Payment of financial charges
Payment of charges of global reversal reserve
Financial charges receivable
Remuneration from equity investments received
Annual allowed Revenue Receiving (Financial Asset)
Financial Asset Indemnities Receiving
Payment of income tax and social contribution
Complementary pension fund payment
Payment of lawsuit contingencies
Lawsuit Deposits
Net Cash from Operating Activities
Furnas
Chesf
Eletrosul
Eletronorte
Eletronuclear
CGTEE
Eletropar
Amazonas GT
12,815,045
137,781
139,245
(92,640)
526,688
(37,983)
13,807
105,420
-
8,694,813
50,659
(13,954)
5,720
71,228
(33,105)
51,864
116,369
-
1,408,975
82,116
6,509
(42,002)
192,775
72,534
160
7,904
-
3,788,250
225,644
(61,852)
(91,478)
313,002
(29,122)
21,948
(24,630)
-
(3,953,453)
197,522
38,868
41,806
67,985
18,219
-
(312,889)
38,895
(2,621)
(115)
205,029
4,566
-
4,212
15
(3,204)
60
(222,112)
31,670
22,192
123,676
648
-
(134,674)
90,382
19
(12,796,768)
(60,347)
(66,255)
(21,584)
(8,641,318)
(4,420)
2,601
(1,540,349)
(344,641)
(3,191,930)
(121,641)
66,234
2,414,479
1,677,269
41,330
284,004
5,042
1
712
-
(14,230)
28,330
95,335
(13,429)
(531,431)
(635,272)
(141,911)
3,315
165,635
734,306
305,352
(166,847)
362,993
192,757
(204,003)
5,109
107,479
(417,395)
(101,638)
236
114,869
127,429
(203,105)
(5,782)
(141,004)
(74,207)
40,462
(303,943)
(938)
(47,736)
(6,193)
(140,857)
(116,899)
136
1,916
470,430
(493)
(25,986)
(170,611)
25,914
234,620
(86,445)
(3,414)
(14,556)
(87,081)
(53,697)
(814)
(8,107)
(224)
3,478
(412)
-
(28,393)
2,827
107,916
(228,060)
162,257
348,501
51,165
(212,334)
8,176
81,913
9
Marketletter 2Q16
Financing Activities
Loans and financing obtained
Loans and financing payable - principal
Payment to Shareholders
Payment of refinancing of taxes and contributions Principal
Global Reversion Reserve Replacement
Receiving of advance for future capital increase
(AFAC)
Others
Net Cash from Financing Activities
875,675
(377,790)
-
119,898
(167,942)
-
748,372
(810,552)
(2,500)
417,655
(428,738)
-
611,000
(71,291)
-
(11,534)
-
(5,361)
-
(52,468)
-
-
-
-
-
-
-
-
(35,410)
410,007
(47,478)
(95,522)
6
(3,309)
(67,983)
(11,083)
539,709
241,824
230,290
127
(5,234)
-
14,134
(39,598)
(3,532)
(211,803)
-
(158,718)
(2,286)
-
(75,965)
(2,106)
(55,821)
(150,473)
(37,415)
(1,732)
(145,115)
(72,039)
(620,791)
(1,329)
-
(4,587)
(1,091)
-
-
(79,593)
-
(603,305)
333,258
(223,189)
482,708
(58,000)
240,739
(689,111)
555,895
26,148
-
(5,793)
-
-
(510,846)
98,515
(101,626)
(389,517)
(595,972)
(5,678)
(5,793)
(79,593)
7,077
(225,067)
(7,352)
(52,099)
(5,098)
12,278
(2,851)
2,320
12,099
19,176
7,077
373,867
148,800
(225,067)
33,490
26,138
(7,352)
70,633
18,534
(52,099)
6,884
1,786
(5,098)
5,190
17,468
12,278
5,388
2,537
(2,851)
38,170
40,490
2,320
Investment Activities
Financing and Loans Concessions
Receiving of Loans and Financing Ceded
Acquisition of property, unit and equipment
Acquisition of intangible assets
Acquisition of concession assets
Concession for advance of future capital increase
Acquisition/Contribution of capital in equity
participation
Concession for Future Capital Increase
Others
Net Cash from investments activities
Increase (decrease) in cash and cash
equivalents
Cash and cash equivalent – beginning of
period
Cash and cash equivalent – end of period
10
Marketletter 2Q16
ASSETS 06/30/2015
CURRENT
Cash and Cash Equivalent
Clients (Consumers and Resellers)
Financing and Loans
Marketable Securities
Dividends to Receive (Equity Participation
Remuneration)
Deferred Fiscal Asset (tax and contribution)
Income tax and Social Contribution
Derivatives
Reimbursement Right
Linked Deposit
Stored Material
Amounts to Receive Law 12,783/2013
Nuclear Fuel Storage
Financial Asset
Regulatory Asset (Installment A - CVA)
Others
CURRENT TOTAL
NON-CURRENT
LONG-TERM ASSET
Fuel Consumption Account – CCC (Parent Company)
Clients (Consumers and Resellers)
Financing and Loans - principal
Marketable Securities
Deferred Fiscal Asset (tax and contribution)
Income tax and Social Contribution
Derivatives
Reimbursement Right
Linked Deposit
Amounts to Receive Law 12,783/2013
Financial Asset
Financial Asset –Indemnitiable Concessions
(Generation)
Advance for equity participation
Regulatory Asset (Installment A - CVA)
Others
LONG-TERM ASSET TOTAL
INVESTIMENTS
Furnas
Chesf
Eletrosul
Eletronorte
Eletropar
Eletronuclear
CGTEE
9,159
548,163
2,774
1,483,984
388,020
401,543
3,250
798,278
504
166,958
1,433
151,862
321,111
954,093
1,359,141
3,164
54,796
11,058
216,008
116,684
3,931
24,922
-
80,139
32,575
216,969
139,167
32,947
779,192
269,127
3,594,196
10,504
30,891
154,452
10,982
83,865
1,152,471
77,517
484,747
3,596,520
5,521
20,796
38,504
3,084
35,559
268,785
49,808
270,144
1,012,958
198,017
80,740
133,179
90,574
233,862
395,498
219,424
3,985,639
552
3,178
61,690
18,185
2,887
66,456
340,319
66,477
838,074
7,154
66,301
25,437
4,512
132,257
453,283
1,970
507,020
6,511,378
6,406
2,387
2,886
169,878
663,523
3,590,766
567,634
3,469
179
3,076
165,896
1,681,016
17,977
229
16,761
923,777
82,877
398,001
5,257,652
2,741
51
-
67,779
614,887
27,834
5,722
-
1,271,940
15,577
372,837
9,134,005
665,179
718,720
191,598
6,011,343
652,100
261,367
3,334,737
29,498
1,391,542
8,118,314
2,792
417,598
1,100,264
167,233
200,789
5,542,549
4,274,809
2,407,486
3,258,363
115,530
-
-
11
Marketletter 2Q16
FIXED ASSET
INTANGIBLE
5,884,350
1,427,023
3,239,168
7,340,289
47
10,943,917
1,544,799
107,198
56,438
217,837
102,366
32
52,455
2,046
NON-CURRENT TOTAL
20,668,102
11,769,613
9,199,228
18,819,332
118,401
12,096,636
1,747,634
ASSET TOTAL
24,262,298
15,366,133
10,212,186
22,804,971
180,091
12,934,710
1,879,891
12
Marketletter 2Q16
LIABILITIES 06/30/2015
CURRENT
Compulsory Loan (Parent Company)
Fuel Consumption Account - CCC (Parent Company)
Suppliers
Loans and Financing - principal
Loans and Financing - charges
Bonds
Taxes and Social Contribution
Income Tax and Social Contributions
Derivatives
Reimbursement Obligations
Advance to clients (Early Energy Sale)
Shareholders Remuneration (dividends to pay)
Estimated Obligations
Provisions for Contingencies
Post Employment Benefit (Complementary Pension
Fund)
Leasing
Onerous Contracts
Concessions to Pay - UBP
Sector Charges (statutory taxes)
Regulatory Asset (Installment A - CVA)
Others
CURRENT TOTAL
NON-CURRENT
National Treasury Credits (Parent Company)
Compulsory Loan (Parent Company)
Fuel Consumption Account (Parent Company)
Reversion Global Reserve - RGR (Parent Company)
Suppliers
Loans and Financing - principal
Bonds
Taxes and Social Contribution
Income Tax and Social Contributions
Derivatives
Reimbursement Obligations
Advance to clients (Early Energy Sale)
Estimated Obligations
Furnas
Chesf
Eletrosul
Eletronorte
Eletropar
Eletronuclear
CGTEE
404,405
602,667
143,268
254,181
136,946
165,627
-
346,504
284,615
16,268
84,768
166,159
201,392
-
326,102
279,020
6,798
269,662
59,944
195
36,541
88,353
-
944,263
543,449
18,779
14,109
60,530
8
671
54,832
1,934,900
223,414
-
1,028
33
266
79
-
360,756
1,123,500
15,307
45,984
246,371
-
158,703
232,471
1,260
18,693
70,083
10,474
37,075
45,629
884
141,893
79,318
1,974,818
24,378
123,635
182,060
1,429,779
1,896
2,197
46,354
123,155
1,240,217
1,687
327,863
429,791
4,554,296
1,406
7,581
13,592
117,020
1,930,111
1,875
23,705
554,339
9,009,126
638,339
61,653
815,643
13,572
57,381
78,132
3,098,352
43,378
92,884
11,447
412,715
4,109,651
204,956
59,528
688,437
16,079
15,039
-
4,460,734
67,306
21,284
2,038,517
1,611
13
Marketletter 2Q16
Provisions for Contingencies
Provision for uncovered liabilities on invested
companies
Post Employment Benefit (Complementary Pension
Fund)
Leasing
Provision for Onerous Contracts
Concessions to Pay - UBP
Sector Charges (statutory taxes)
Obligations for asset demobilization (Nuclear Power
Plant Demobilization)
Advance for future Capital Increase
Regulatory Liability (Installment A - CVA)
Others
NON-CURRENT TOTAL
768,134
1,648,593
85,361
617,962
-
165,693
-
-
-
114,343
-
-
-
-
242,550
830,061
36,410
107,940
974,984
99,199
277,009
162,475
25,036
-
44,801
45,542
-
-
58,931
-
3,511
-
40,823
1
11,735,037
5,891
3,970,404
66,909
15,445
3,715,630
308,995
6,508,666
15,039
1,357,738
112,316
6,222,718
105,580
2,170,503
6,531,154
5,123,332
206,376
(1,308,419)
-
9,753,953
4,916,199
(3,277,000)
(1,427,269)
67
4,295,250
1,074,209
(237,171)
(126,391)
13,842
11,576,263
332,962
108,991
(39,607)
-
118,054
215
2,205
43,171
-
6,607,258
(1,773,150)
(52,227)
-
845,510
2,596
(1,661,240)
(31,817)
-
SHAREHOLDERS’ EQUITY TOTAL
10,552,443
9,965,950
5,019,739
11,978,609
163,645
4,781,881
(844,951)
LIABILITY AND SHAREHOLDERS’ EQUITY TOTAL
24,262,298
15,366,133
9,975,586
23,041,571
180,090
12,934,710
1,879,891
SHAREHOLDERS’ EQUITY
Social Capital
Capital Reserves
Profit Reserves
Additional Dividend Purposed
Profit/Losses accumulated
Others Comprehensive Income
Non-controlling shareholders remuneration
14
Marketletter 2Q16
STATEMENT OF INCOME 06/30/2015
Operational Revenue
Electric Energy – sale to Distribution Companies
Electric Energy - sale to final Consumers
Short Term Electric Energy
Renewed Plants Operation and Maintenence Revenue
Construction Plants Revenue
Financial Effect Itaipu (Parent Company)
Renewed Lines Operation and Maintenence Revenue
Operation and Maintenence Revenue T
Construction Revenue - Transmission
Financial – Return on Investment T
Others Operational Revenue
Deductions to Operational Revenue
Operational Expenses
Personnel, Materials and Services
Electric Energy Purchased for Resale
Charges on Electric Energy usage grid
Construction
Fuel used to produce electric energy
Remuneration and Reimbursement (Royalties –
Hydric Resources Usage)
Depreciation and Amortization
Operational Provisions
Others
OPERATING RESULT BEFORE FINANCIAL
RESULT
Furnas
Chesf
Eletrosul
Eletronorte
3,066,296
1,823,942
767,788
2,987,803
-
971,603
174,964
1,966,084
7,476
258,128
283,087
81,651
68,167
449,192
263,375
625,156
19,009
181,750
172,361
-
1,945,809
601,604
20,696
8,512
-
-
1,103,828
-
191,234
-
501,173
189,786
116,712
39,043
407,968
28,756
286,821
16,921
11,172
267,670
50,634
48,156
111,394
23,505
237,369
2,860
126,675
163,801
274,511
-
-
1,702
(376,844)
(352,595)
(87,682)
(394,034)
-
(132,225)
(17,972)
(2,479,775)
(1,782,219)
(705,091)
(2,524,776)
(2,110)
(857,903)
(303,850)
(715,855)
(513,365)
(226,487)
(271,437)
(251,905)
(536,986)
(153,513)
(351,894)
(305,830)
(136,410)
(220,138)
(105,628)
(7,678)
(48,156)
-
(664,831)
(937,805)
(262,122)
(126,675)
(67,911)
(1,676)
-
(438,779)
(38,146)
(161,115)
(124,744)
(96,115)
(18,065)
(5,349)
(46,468)
(113,923)
(250,415)
(89,920)
(5,504)
(54,281)
(180,462)
(57,339)
(6,339)
(59,281)
2,561
(260,432)
(144,357)
(221,125)
(63,270)
(36,680)
(10)
33
(457)
(183,270)
(31,588)
(5,005)
(39,885)
(5,828)
(13,864)
586,521
Eletropar
Eletronuclear
113,700
CGTEE
41,723
62,697
463,027
(2,110)
(128,886)
68,153
15,699
71,363
3,306
657
114
-
-
-
-
-
-
FINANCIAL (EXPENSES) REVENUES
Revenue from Financial Investments
Interest, Commission and Rates revenue (loans and
financing)
53,848
29,185
15
Marketletter 2Q16
Debt Charges
Charges – remuneration to shareholders
Moratorium Increase on electric energy
Net Monetary Update
Net Exchange Update
Others Financial Revenue
Other Financial Expenses
Indemnities Remuneration – Law 12,783/13
(421,844)
3,207
(139,805)
(7,230)
118,991
(63,770)
286,582
(67,118)
37,295
11,504
39,627
(18,745)
404,318
(165,035)
(2,046)
(61,889)
41,173
(5,050)
95,461
(268,134)
31,887
(192,922)
66,906
(117,581)
78,728
(29)
-
(25,611)
(10,013)
(52,040)
62,626
(51,364)
-
(152,373)
(3,888)
(225)
371
(7,012)
-
FINANCIAL RESULT
(140,836)
475,034
(81,687)
(329,753)
3,277
(75,745)
(163,013)
EQUITY PARTICIPATIONS RESULT
(106,950)
2,874
(142,849)
57,440
1,303
-
-
338,735
519,631
(161,839)
190,714
2,470
37,955
(291,899)
(132,359)
(19,862)
(73,537)
(81,723)
(266)
(51,976)
-
RESULT BEFORE EQUITY PARTICIPATIONS
206,376
499,769
(235,376)
108,991
2,204
(14,021)
(291,899)
Minority Participations
NET PROFIT OF THE PERIOD
206,376
499,769
(235,376)
108,991
2,204
(14,021)
(291,899)
RESULT BEFORE SOCIAL CONTRIBUTION,
INCOME TAX, EMPLOYEES AND MANAGEMENT
PARTICIPATION AND MINORITY PARTICIPATION
Income Tax and Social Contribution and Fiscal
Incentives Revenue
16
Marketletter 2Q16
CASH FLOW 06/30/2015
Operating Activities
Profit (loss) before income tax and social
contribution
Furnas
Chesf
Eletrosul
338,735
519,680
74,761
272,992
37,955
(291,899)
2,470
Depreciation and amortization
Monetary net variation
Exchange net variation
Financing charges
Equity Method Result
Provision for uncovered liability
Provision for doubtful credit liquidation
Provisions for contingencies
Provision for staff realignment
Provision for investment loss
Provision for reduction on recoverable amount of
Investment
Provision for onerous contracts
Provision for loss with Financial Asset
Global reversal reserve charges
Adjustment to Present Value / Market Amount
Minority Participation in Result
Charges on Shareholders funds
Financial Asset Revenue
Derivatives
Others
(Increase) decrease on operating
asset/liability
113,923
185,696
398,960
106,950
13,613
258,843
-
54,281
(415,568)
67,118
(2,874)
34,752
171,321
-
59,281
(28,819)
124,192
142,849
149
(2,712)
-
221,125
(25,114)
104,820
268,134
(57,440)
2,865
36,388
-
183,270
10,012
52,041
25,611
10,146
-
41,404
225
135,239
4,993
-
10
(1,303)
-
(139,874)
98,577
(116,712)
(293,467)
(61,215)
(15,525)
(16,921)
70,848
(642)
2,046
(111,394)
(298,972)
(163,801)
84,290
(209,225)
43,258
110,447
3,888
6
(266)
270,368
(251,571)
244,107
577,708
(219,331)
(72,835)
(13,192)
1,235,612
154,326
204,846
1,112,742
253,409
(178,979)
(12,281)
(419,657)
(120,532)
232
46,884
(67,595)
22,431
(107,865)
212
8
(161,609)
12,712
(63,687)
-
(18,802)
-
933
134,320
851,866
(17,388)
(12,658)
(260,659)
857,557
(123,467)
(52,032)
(5,644)
(1,203)
466,110
247,406
(25,156)
(5,615)
155,165
212,245
(28,358)
(1,708)
(7,840)
(38,146)
(6,563)
931
-
Cash from Operating Activities
Payment of financial charges
Payment of charges of global reversal reserve
Financial charges receivable
Remuneration from equity investments received
Annual allowed Revenue Receiving (Financial
Asset)
Financial Asset Indemnities Receiving
Payment of income tax and social contribution
Complementary pension fund payment
Payment of lawsuit contingencies
Lawsuit Deposits
17
Eletronorte Eletronuclear
CGTEE
Eletropar Amazonas GT
Marketletter 2Q16
Net Cash from Operating Activities
Financing Activities
Loans and financing obtained
Loans and financing payment - principal
Payment to Shareholders
Global Reversal Reserve Replacement
Receiving of advance for future capital increase
(AFAC)
Payment of Refinancing of taxes and contribution principal
Others
Net Cash from Financing Activities
1,698,679
523,714
779,946
1,293,349
145,013
(196,850)
(11,348)
21
(196,297)
-
(91,601)
-
(104,528)
(2,743)
-
276,034
(345,477)
-
345,000
(28,325)
-
177,956
(74,169)
-
-
-
(128,705)
24
-
-
85,274
-
(33,811)
(230,087)
18
(220,288)
(9,317)
(3,334)
(119,898)
(69,443)
316,675
189,061
-
(69,182)
(5,563)
(271,438)
-
(153,304)
(4,697)
-
(550,206)
(1,170)
(48,156)
(171,928)
(7,143)
(771,840)
-
(437,736)
418
-
(13,966)
(31)
-
(17)
-
(352,556)
(762,386)
(303,023)
(112,445)
(125,483)
210,439
(616,203)
148,367
(31,673)
-
-
(1,461,125)
(573,469)
(686,504)
(1,246,819)
(468,991)
(13,997)
(17)
7,467
(270,043)
(26,456)
(22,913)
(7,303)
(21,786)
(11,365)
1,692
9,159
7,467
658,063
388,020
(270,043)
26,960
504
(26,456)
344,024
321,111
(22,913)
18,361
11,058
(7,303)
25,717
3,931
(21,786)
14,529
3,164
(11,365)
Investment Activities
Financing and Loans Concessions
Receiving of Loans and Financing Ceded
Acquisition of fixed assets
Acquisition of intangible assets
Acquisition of concession assets
Concession for advance of future capital increase
Acquisition/Contribution of capital in equity
participation
Others
Net Cash from investments activities
Increase (decrease) in cash and cash
equivalents
Cash and cash equivalent – beginning of
period
Cash and cash equivalent – end of period
18
Marketletter 2Q16
IV.2 Financial Statements of the Distribution companies.
ASSET 06/30/2016
CURRENT
Cash and Cash Equivalents
Clients (Consumers and Resellers)
Financing and Loans
Marketable Securities
Dividends to Receive (Equity Participations
Remuneration)
Deferred Fiscal Asset (Taxes and Contributions)
Income Tax and Social Contribution
Derivatives
Reimbursement Rights
Linked Deposits
Stored Material
Amounts to Receive 12,783/13 Law
Regulatory Asset (Installment A - CVA)
Financial Asset
Others
CURRENT TOTAL
ED Alagoas
ED Rondonia
ED Piaui
ED Acre
CELG -D
ED Roraima
Amazonas D
20,215
320,158
14,669
20,140
241,579
165,401
3,685
341,757
147
7,814
95,031
-
-
6,517
39,608
-
33,605
629,394
12,465
10,707
44,988
7,445
106,870
42,880
567,932
17,845
164,646
14,272
127,618
75,483
826,984
21,103
92,564
13,347
69,466
47,796
589,865
6,892
882
135,308
475
1,434
57,278
32,073
337,187
4,333,424
4,333,424
5,011
76,820
2,859
1,517
6,860
139,192
2,144
875,033
103,411
73,831
640,534
2,370,417
207,731
4,623
45,631
-
18,083
7,162
3,379,492
116,732
-
216,671
5,580
15,691
-
27,301
1,720
243,373
7,356
-
-
9,693
8,248
204,050
19,483
-
66,557
2,450,287
6,487,937
344,732
-
796,841
1,050,359
725,662
343,398
-
193,157
1,410,427
NON-CURRENT
LONG-TERM ASSET
Dividends to Receive (Equity Participations
Remuneration)
Clients (Consumers and Resellers)
Financing and Loans - principal
Marketable Securities
Deferred Fiscal Asset (Taxes and Contributions)
Income Tax and Social Contribution
Derivatives
Reimbursement Rights
Linked Deposits
Amounts to Receive - Law 12,783/13
Financial Asset
Financial Asset – Indemnitiable Concession
(Distribution)
19
Marketletter 2Q16
Advance for Equity Participations
Regulatory Asset (Installment A - CVA)
Others
LONG-TERM ASSET TOTAL
INVESTIMENTS
FIXED ASSET
INTANGIBLE
NON-CURRENT ASSET TOTAL
ASSET TOTAL
51,583
564
1,106,973
2,447
4,574,275
1,325
964,929
623,148
-
2,180
436,811
637,355
11,397,295
168
1,806
146
-
-
-
12,929
30,144
28,014
32,395
8,983
-
19,741
1,244,597
35,763
39,908
11,695
33,329
-
6,046
167,774
1,173,048
4,644,003
1,009,165
665,460
-
462,598
12,822,595
1,740,980
5,470,987
1,599,030
1,002,647
4,333,424
601,790
15,193,012
20
Marketletter 2Q16
LIABILITIES 06/30/2016
ED Alagoas
ED Rondonia
ED Piaui
ED Acre
CELG -D
ED Roraima
Amazonas
CURRENT
Suppliers
Financig and Loans - principal
Financig and Loans - charges
Bonds
Taxes and Social Contributions
Income Tax and Social Contribution
Derivatives
Reimbursement Obligations
Advance to clients (Early Sell of Energy)
Shareholders Remuneration (dividends to pay)
Estimated Obligations
Provisions for Contingencies
Post-Employment Benefit (Complementary Pension Fund)
Leasing
Onerous Contracts
Sector Charges (Statutory Taxes)
Regulatory Asset (Installment A – CVA)
Others
CURRENT TOTAL
255,207
350,369
79,388
269
62,229
19,432
2,781
22,373
47,149
23,161
862,358
1,253,342
152,548
67,925
205,741
19,002
790
26,137
90,077
41,881
1,857,443
393,649
647,118
49,607
203,423
39,852
39,209
26,743
50,673
64,319
1,514,593
303,161
111,384
1,803
45,700
6,630
5,758
36,755
23,965
24,366
559,522
5,033,654
5,033,654
611,964
18,142
14,334
19,989
17,594
682,023
7,113,078
231,762
2,235
83,487
573
52,930
135,914
46,389
116,165
7,782,533
NON-CURRENT
Suppliers
Financig and Loans - principal
Bonds
Taxes and Contributions
Income Tax and Social Contribution
Derivatives
Reimbursement Obligations
Advance to clients (Early Sell of Energy)
Estimated Obligations
Provisions for Contingencies
Provision for uncovered liabilities on invested comapnies
Post-Employment Benefit (Complementary Pension Fund)
Leasing
Provision for Onerous Contracts
Concessions to Pay - UBP
Sector Charges (Statutory Taxes)
Advance for future capital Increase
Regulatory Liability (Installment A – CVA)
901,763
91,513
1,934
106,510
30,571
27,161
33,733
1,099,575
615,429
4,209
149,649
150,453
44,575
-
691,852
201,269
2,067
79,418
7,103
43,798
-
249,971
193,764
76,327
143,850
20
11,425
12,787
-
-
141,310
40,788
57,059
206
46,705
437
-
7,861,211
1,161,931
2,216,969
644
537,487
43,675
277
1,075,986
-
21
Marketletter 2Q16
Others
NON-CURRENT TOTAL
32,918
1,226,103
2,135,849
4,199,739
502
1,026,009
197
688,341
-
119,933
406,438
180,799
13,078,979
734,754
(1,039,427)
(42,808)
-
1,325,369
(1,911,777)
213
-
1,272,747
(2,206,953)
(7,366)
-
475,789
(720,765)
(240)
-
3,475,679
(4,597,498)
421,589
-
684,204
(1,169,569)
(1,306)
-
4,610,171
(10,276,250)
(2,421)
-
SHAREHOLDERS’ EQUITY TOTAL
(347,481)
(586,195)
(941,572)
(245,216)
(700,230)
(486,671)
(5,668,500)
LIABILITIES AND SHAREHOLDERS’ EQUITY TOTAL
1,740,980
5,470,987
1,599,030
1,002,647
4,333,424
601,790
15,193,012
SHAREHOLDERS’ EQUITY
Social Capital
Capital Reserves
Profit Reserves
Additional Dividend Purposes
Accumulated Profit/Losses
Other Comprehensive Income
Non-controlling Shareholders participation
22
Marketletter 2Q16
STATEMENT OF INCOME 06/30/2016
Operational Revenue
Electric Energy – sale to Distribution
Companies
Electric Energy - sale to final Consumers
Short Term electric Energy
Renewed Plants Operation and Maintenence
Revenue
Construction Revenue of Plants
Electric Energy Supply - Distribution
Construction Revenue - Distribution
CVA and Others Financial Items
Other Operational Revenues
Deductions to Operational Revenues
Operational Expenses
Personnel, Material and Services
Electric Energy puchased for resale
Charges on Eletric Energy Grid Usage
Construction
Fuel used for electric energy production
Remuneration and Reimbursement (Royalties)
Depreciation and Amortization
Operating Provisions
Others
OPERATING RESULT BEFORE FINANCIAL
RESULT
ED Alagoas
ED Rondonia
ED Piaui
ED Acre
CELG -D
ED Roraima
Amazonas D
707,706
855,985
610,224
228,134
-
131,930
1,370,325
-
-
-
-
-
15,242
-
227,580
169,927
971,057
65,772
(44,743)
95,142
870,555
106,203
222,607
43,859
829,429
50,723
22,307
80,990
287,141
31,816
17,237
11,731
-
139,561
10,108
(36)
4,287
4,304
1,243,748
107,508
(56,944)
146,244
(379,522)
(387,239)
(373,225)
(119,791)
-
(37,232)
(472,042)
(737,010)
(840,134)
(741,737)
(284,591)
-
(252,744)
(1,811,621)
(113,090)
(431,470)
(41,571)
(65,772)
(18,232)
(3,990)
(62,885)
(123,966)
(525,684)
(8,863)
(106,203)
(19,170)
(18,749)
(37,499)
(143,871)
(428,822)
(52,709)
(50,723)
(19,126)
99,904
(146,390)
(45,185)
(122,916)
(2,525)
(31,816)
(31,424)
(8,424)
(4,595)
(37,706)
-
(43,261)
(92,791)
(10,108)
(68,388)
(5,439)
(31,028)
(1,729)
(281,598)
(867,702)
(42,890)
(111,812)
69,303
(50,901)
(334,080)
(191,941)
(29,304)
15,851
(131,513)
(56,457)
-
(120,814)
(441,296)
2,379
3,295
13
329
-
236
2,576
(96,992)
(326,860)
(97,190)
(20,575)
-
(4,571)
(1,087,170)
FINANCIAL REVENUES (EXPENSES)
Financial Investment Revenues
Interest, Commission and Rates revenue
(loans and financing)
Debt Charges
23
Marketletter 2Q16
Charges - Leasing
Charges – Shareholders Remuneration
Moratorium Increase on electric energy
Net Monetary Update
Net Exchange Update
Regulatory Asset and Liability Update
(Installment A - CVA) - Net
Other financial revenue
Other financial expense
21,172
(3,715)
330
22,813
223,701
-
36,761
(38,003)
-
11,490
(44,766)
-
-
(23,597)
(7,692)
-
(152,762)
47,797
599,061
-
11,559
(520)
(13,041)
(2,994)
(38,541)
(27,147)
4,954
(30)
(15,414)
3
(5,557)
-
98
7,310
-
(5,564)
22,420
(52,744)
(78,828)
(145,733)
(108,909)
(59,076)
-
(28,216)
(626,386)
-
-
-
-
-
-
-
RESULT BEFORE SOCIAL CONTRIBUTION,
INCOME TAX, EMPLOYEES AND
MANAGEMENT PARTICIPATION AND
MINORITY PARTICIPATION
(108,132)
(129,882)
(240,422)
(115,533)
-
(149,030)
(1,067,682)
Income Tax and Social Contribution and Fiscal
Incentives Revenue
-
-
-
-
-
-
-
(108,132)
(129,882)
(240,422)
(115,533)
-
(149,030)
(1,067,682)
(108,132)
(129,882)
(240,422)
(115,533)
-
(149,030)
(1,067,682)
FINANCIAL RESULT
EQUITY PARTICIPATIONS RESULT
RESULT BEFORE EQUITY
PARTICIPATIONS
NET PROFIT OF THE PERIOD
24
Marketletter 2Q16
CASH FLOW 06/30/2016
ED Acre
Amazonas
Energia
(149,030)
(115,533)
(1,304,901)
19,126
1,393
94,587
29,915
9,541
(18,907)
156,254
5,439
4,571
32,380
(1,352)
663
125,196
8,424
(44,766)
20,575
4,138
457
23
152,912
50,901
(2,428)
258,658
193,544
43,675
127,392
195,659
785,185
(142,280)
195,745
51,487
17,867
26,230
205,405
(1,053)
-
(15,921)
(33,235)
(8,598)
-
(2,016)
-
(2,774)
-
(26,599)
(48,447)
69,556
146,589
42,889
15,851
23,456
130,359
ED Alagoas
ED Rondônia
ED Piauí
ED Roraima
(108,132)
(129,882)
(240,422)
18,232
3,715
(330)
96,992
(13,445)
10,517
(89)
423,124
(359,975)
19,170
14,956
53,987
12,267
6,482
21,893
196,872
Cash from Operating Activities
70,609
Payment of financial charges
Payment of charges of global reversal reserve
Financial charges receivable
Remuneration from equity investments received
Annual allowed Revenue Receiving (Financial Asset)
Financial Asset Indemnities Receiving
Payment of income tax and social contribution
Complementary pension fund payment
Payment of lawsuit contingencies
Lawsuit Deposits
Net Cash from Operating Activities
Operating Activities
Profit (loss) before income tax and social contribution
Depreciation and amortization
Net monetary variation
Net exchange variation
Financing charges
Equity Method Result
Provision for uncovered liability
Provision for doubtful credit liquidation
Provisions for contingencies
Provision for staff realignment
Provision for loss with Investments
Provision for reduction on recoverable amount of Investment
Provision for onerous contracts
Provision for loss with Financial Asset
Global reversal reserve charges
Adjustment to Present Value / Market Value
Minority Participation in Result
Charges on Shareholders funds
Financial Asset Revenue
Derivatives
Others
(Increase) decrease on operating asset/liability
25
CELG-D
Marketletter 2Q16
Financing Activities
Loans and financing obtained
Loans and financing payable - principal
Payment to Shareholders
Global Reversal Reserve Replacement
Receiving of advance for future capital increase (AFAC)
Payment of refinancing of taxes and contributions – Principal
Others
Net Cash from Financing Activities
3,794
(22,481)
(5,891)
(24,578)
16,109
(24,418)
(8,309)
(254)
(254)
5,968
(3,295)
2,673
7,505
7,505
(30,441)
3,257
(27,184)
(556)
(2,703)
(45,608)
1,303
(2,881)
(4,220)
(136,439)
-
(1,339)
(1,771)
(45,049)
-
(4,447)
(1,573)
(9,673)
-
(248)
(1,092)
(30,710)
(9,598)
(14,028)
(110)
(123,683)
-
(47,564)
(143,540)
(48,159)
(15,693)
(41,648)
(137,821)
(2,586)
22,801
20,215
(2,586)
(5,260)
25,400
20,140
(5,260)
(5,524)
9,209
3,685
(5,524)
2,831
3,686
6,517
2,831
(10,687)
18,501
7,814
(10,687)
(34,646)
68,251
33,605
(34,646)
Investment Activities
Financing and Loans Concessions
Receiving of Loans and Financing Ceded
Acquisition of property, unit and equipment
Acquisition of intangible assets
Acquisition of concession assets
Concession for advance of future capital increase
Acquisition/Contribution of capital in equity participation
Others
Net Cash from investments activities
Increase (decrease) in cash and cash equivalents
Cash and cash equivalent – beginning of period
Cash and cash equivalent – end of period
26
Marketletter 2Q16
ASSETS 06/30/2015
ED Alagoas
ED Rondonia
ED Piaui
ED Acre
CELG -D
ED Roraima
Amazonas
15,234
337,699
25,791
15,445
242,088
31,856
3,415
326,906
468
18,504
71,101
-
125,921
865,660
-
8,659
41,257
-
123,626
435,831
78,446
9,964
66,896
6,264
14,089
43,141
519,078
11,357
182,037
31,305
95,192
169,055
778,335
29,006
255
15,623
12,620
273,657
44,699
706,649
6,871
2,832
105,162
466
2,892
32,327
40,004
280,159
6,615
96,680
33,205
18,764
294,921
1,441,766
9,298
181,805
1,937
1,125
20,237
264,318
29,061
1,963,036
12,315
206,022
131,268
321,465
3,301,070
206,286
4,975
43,061
697,484
26,060
7,376
3,006,903
73,301
837,876
222,508
4,521
13,571
631,432
22,938
1,972
239,885
7,383
358,181
43,104
148,103
108,359
2,002,050
3,333
1,505
68,883
17,087
186,409
79,235
2,186,146
4,399,859
356,939
1,411,466
213,419
565
1,165,790
3,909
3,955,425
1,285
873,317
86
630,445
223,104
594,626
3,119,346
4,392
281,609
1,708,727
9,089
10,151,461
169
1,806
146
-
(573)
-
12,938
FIXED ASSET
21,948
29,199
23,664
7,286
125,736
13,321
1,330,244
INTANGIBLE
-
42,550
10,892
11,799
19,830
7,678
529,637
CURRENT
Cash and Cash Equivalents
Clients (Consumenrs and Resellers)
Loans and Financing
Marketable Securities
Dividends to Receive (Remuneration of Equity
Participation)
Deferred Fiscal Asset (Taxes and Contributions)
Income Tax and Social Contribution
Derivatives
Reimbursement Rights
Linked Deposits
Stored Material
Financial Asset
Regulatory Asset (Installment A – CVA)
Others
CURRENT TOTAL
NON-CURRENT
LONG-TERM CURRENT
Clients (Consumenrs and Resellers)
Loans and Financing - principal
Marketable Securities
Deferred Fiscal Asset (Taxes and Contributions)
Reimbursement Rights
Linked Deposits
Financial Asset
Financial Asset – Indemnitiable Concessions
(Generation)
Advance for equity participation
Regulatory Asset (Installment A – CVA)
Others
LONG-TERM CURRENT TOTAL
INVESTIMENTS
27
Marketletter 2Q16
NON-CURRENT TOTAL
1,187,907
4,028,980
908,019
649,530
3,264,339
302,608
12,024,280
ASSET TOTAL
1,706,985
4,807,315
1,614,668
929,689
4,706,105
566,926
15,325,350
28
Marketletter 2Q16
LIABILITIES 06/30/2015
ED
Alagoas
ED
Rondonia
ED Piaui
ED Acre
CELG -D
ED
Roraima
Amazonas
CURRENT
Compulsory Loan (Parent Company)
Fuel Consumption Account – CCC (Parent Company)
Suppliers
Financing and Loans – principal
Financing and Loans - charges
Bonds
Taxes and Social Contribution
Income Tax and Social Contributuion
Derivatives
Reimbursement Obligations
Advance to clients (Early Energy Sell)
Remuneration to Shareholders (dividends to pay)
Estimated Obligations
Provisions for Contingencies
Post-Employment Benefit (Complementary Pension Fund)
Leasing
Onerous Contracts
Concessions to Pay - UBP
Sectorial Charges (statutory taxes)
Regulatory Liabilities (Installment A – CVA)
Others
CURRENT TOTAL
272,698
275,703
70,776
4,388
38,723
10,602
6,183
7,395
990
74,601
762,059
1,152,693
106,261
791
41,338
11,625
21,650
50,862
25,552
31,598
1,442,370
190,451
381,072
1,629
137,419
34,782
28,832
23,970
20,259
48,730
867,144
175,088
51,158
24,550
303
4,517
30,858
4,325
18,565
309,364
864,287
337,336
34,305
75,436
296,564
47,687
31,970
379,630
398,918
2,466,133
363,300
7,052
6,859
16,958
187
47,019
441,375
3,647,802
670,722
747
40,609
1,132
63,200
130,122
3,072
117
115,340
4,672,863
NON-CURRENT
Suppliers
Financing and Loans - principal
Bonds
Taxes and Social Contribution
Income Tax and Social Contributuion
Derivatives
Reimbursement Obligations
Advance to clients (Early Energy Sell)
Estimated Obligations
Provisions for Contingencies
Provision for uncovered liabilities on invested companies
Post-Employment Benefit (Complementary Pension Fund)
Leasing
Provision for Onerous Contracts
Concessions to Pay - UBP
763,728
7,228
43,548
18,530
90,906
45,193
-
1,003,845
628,321
3,751
146,231
126,041
-
713,891
67,429
1,467
101,359
22,534
-
229,993
213,699
2,906
130,728
11,248
-
878,352
460,635
192,696
5,298
37,487
540,403
114,095
-
128,541
43,313
57,209
198
44,425
2,851
-
7,459,666
1,515,747
2,301,332
376,047
450
1,160,252
-
29
Marketletter 2Q16
Sectorial Charges (statutory taxes)
Obligations for asset demobilization (Nuclear power plant demobilization)
Advance for future capital Increase
Regulatory Liabilities (Installment A – CVA)
Others
NON-CURRENT TOTAL
8,307
1,457
46,723
1,025,620
42,099
245
1,327,456
3,277,989
34,009
16,416
499
957,604
12,787
865
602,226
156,662
31,459
2,417,087
19,897
296,434
489,787
13,303,281
STOCKHOLDERS’ EQUITY
Social Capital
Capital Reserves
Profit Reserves
Additional Dividend Purposed
Profit/Losses Accumulated
Other Comprehensive Income
Non-controlling Shareholders Participations
726,447
(748,329)
(58,812)
-
1,325,124
(1,238,168)
-
1,256,331
(1,472,566)
6,155
-
475,789
(457,268)
(422)
-
3,475,679
(3,819,367)
166,574
-
684,204
(851,581)
(3,505)
-
4,610,171
(7,258,712)
(2,253)
-
STOCKHOLDERS’ EQUITY TOTAL
(80,694)
86,956
(210,080)
18,099
(177,114)
(170,882)
(2,650,794)
1,706,985
4,807,315
1,614,668
929,689
4,706,105
566,927
15,325,350
LIABILITY AND STOCKHOLDERS’ EQUITY TOTAL
30
Marketletter 2Q16
STATEMENT OF INCOME 06/30/2015
Operational Revenue
Electric Energy – sale to Distribution Companies
Electric Energy - Generation
Short Term electric Energy
Construction Plants Revenue
Electric Energy Supply – Distribution
Construction Revenue – Distribution
Others Operational Revenues
Deductions to Operational Revenues
Operational Expenses
Personnel, Material and Services
Electric Energy Purchased for Resale
Charges on Electric Energy Grid Usage
Construction
Fuel used for electric energy production
Remuneration and Reimbursement (Royalties)
Depreciation and Amortization
Operating Provisions
Others
OPERATING RESULT BEFORE FINANCIAL
RESULT
ED Alagoas
ED Rondonia
ED Piaui
ED Acre
CELG -D
ED Roraima
Amazonas D
619,626
553,169
568,887
168,948
1,875,143
119,241
1,803,815
905,455
44,791
50,621
732,873
61,819
43,179
786,133
43,561
77,951
250,446
19,655
2,938
3,270,110
119,443
121,755
18,877
123,715
7,483
3,871
622,671
929,186
52,960
376,770
61,272
150,809
(381,241)
(284,702)
(338,758)
(104,091)
(1,636,165)
(34,705)
(389,853)
(626,903)
(532,736)
(622,111)
(192,222)
(2,352,131)
(207,780)
(1,879,196)
(105,820)
(384,867)
(27,323)
(44,791)
(16,559)
(11,719)
(35,824)
(115,466)
(298,618)
(8,919)
(61,819)
(18,057)
10,282
(40,139)
(119,605)
(366,589)
(17,764)
(43,561)
(17,265)
(12,747)
(44,580)
(43,797)
(106,773)
(2,027)
(19,655)
(7,929)
(1,749)
(10,292)
(395,456)
(1,528,925)
(86,064)
(119,443)
(58,693)
(77,709)
(85,841)
(38,573)
(86,575)
(7,483)
(19,697)
(5,253)
(48,584)
(1,615)
(319,546)
(708,762)
(78,187)
(114,232)
(292,942)
(3,521)
(127,448)
(77,118)
(157,440)
(7,277)
20,433
(53,224)
(23,274)
(476,988)
(88,539)
(75,381)
1,144
882
337
349
-
73
4,697
(59,304)
10,530
10,530
-
(44,445)
17,711
17,711
-
(65,117)
26,077
26,077
-
(14,647)
5,932
5,932
-
4,485
(78,330)
106,526
-
(2,020)
(9,853)
(9,853)
-
(715,621)
(137,661)
27,980
44,866
(137,661)
-
FINANCIAL REVENUE (EXPENSES)
Financial Investments Revenue
Interest, Commission and Rates revenue (loans and
financing)
Debt Charges
Charges - Leasing
Charges – remuneration to shareholders
Moratorium Increase on electric energy
Net Monetary Update
Net Exchange Update
Regulatory Asset and Liability Update (Installment A
31
Marketletter 2Q16
- CVA) - Net
Other financial Revenues
Other financial expenses
1,278
(25,945)
62,641
(81,927)
6,548
(19,112)
(9,156)
53,846
(19,061)
(3,525)
-
46,341
(25,312)
(61,767)
(27,427)
(25,190)
(11,590)
67,466
(25,178)
(892,371)
-
-
-
-
-
-
-
(69,044)
(6,994)
(78,414)
(34,864)
(409,522)
(113,717)
(967,752)
Income Tax and Social Contribution and Fiscal
Incentives Revenue
(43,548)
-
-
-
-
-
-
RESULT BEFORE EQUITY PARTICIPATION
(112,592)
(6,994)
(78,414)
(34,864)
(409,522)
(113,717)
(967,752)
(69,620)
(17,110)
(69,022)
(36,807)
(390,794)
(101,154)
(631,413)
FINANCIAL RESULT
EQUITY PARTICIPATION RESULT
RESULT BEFORE SOCIAL CONTRIBUTION,
INCOME TAX, EMPLOYEES AND MANAGEMENT
PARTICIPATION AND MINORITY
PARTICIPATION
NET PROFIT OF THE PERIOD
32
Marketletter 2Q16
CASH FLOW 06/30/2015
Operating Activities
Profit (loss) before income tax and social contribution
Depreciation and amortization
Net monetary variation
Net exchange variation
Financing charges
Provision for uncovered liability
Provision for doubtful credit liquidation
Provisions for contingencies
Provision for staff realignment
Provision for loss with Investment
Provision for reduction on recoverable amount of assets
Provision for onerous contracts
Provision for loss with Financial Asset
Global reversal reserve charges
Adjustment to Present Value / Market Amount
Minority Participation in Result
Charges on Shareholders funds
Financial Asset Revenue
Derivatives
Others
(Increase) decrease on operating asset/liability
Cash from Operating Activities
Payment of financial charges
Payment of charges of global reversal reserve
Financial charges receivable
Remuneration from equity investments received
Annual allowed Revenue Receiving (Financial Asset)
Financial Asset Indemnities Receiving
Payment of income tax and social contribution
Complementary pension fund payment
Payment of contingent liabilities
Lawsuit Deposits
Net Cash from Operating Activities
Financing Activities
Loans and financing obtained
ED Alagoas
ED Rondônia
(26,072)
(17,110)
16,559
(15,098)
212
59,304
7,621
2,195
(133)
537,805
(523,581)
18,057
14,981
44,445
(535)
(9,747)
12,877
16,226
17,265
4,017
60,475
7,192
5,555
4,465
(13,698)
7,929
7,615
14,647
6,725
2,322
(7,298)
3,420
5,253
2,020
48,949
(365)
640
31,834
127,447
(15,082)
278,400
57,374
23,734
9,490
507,092
58,812
79,194
16,249
(1,447)
7,424
357,043
(7,698)
(43,548)
-
(6,233)
(1,404)
(5,570)
-
(1,372)
-
-
(58,520)
(18,606)
7,566
71,557
10,679
(2,819)
7,424
279,917
79,974
12,497
37,279
20,520
5,468
24,096
33
ED Piauí
(69,022)
ED Acre
(36,807)
ED Roraima Amazonas Energia
(80,907)
(631,412)
Marketletter 2Q16
Loans and financing payment - principal
Payment to Shareholders
Global Reversal Reserve Reposition
Receiving of advance for future capital increase (AFAC)
Payment of Refinancing of taxes and contributions - Principal
Others
Net Cash from Financing Activities
(47,102)
(5,900)
26,972
(9,985)
2,512
(28,782)
(34,958)
(26,461)
(3,726)
16,794
(1,571)
3,897
(83,518)
(59,422)
(495)
(28,367)
(61)
(751)
(579)
(61,819)
-
(375)
(1,339)
15,433
-
(303)
(19,665)
-
(13,885)
(2,319)
6,257
-
(2,513)
(2,638)
(154,324)
-
(28,923)
(63,149)
13,719
(19,968)
(9,947)
(159,475)
5,615
9,619
15,234
10,920
4,525
15,445
(2,063)
5,478
3,415
(5,993)
24,497
18,504
1,374
7,286
8,659
61,020
62,606
123,626
5,615
10,920
(2,063)
(5,993)
1,373
61,020
Investment Activities
Financing and Loans Concessions
Receiving of Loans and Financing Ceded
Acquisition of fixed assets
Acquisition of intangible assets
Acquisition of concession assets
Concession for advance of future capital increase
Acquisition/Contribution of capital in equity participation
Others
Net Cash from investments activities
Increase (decrease) in cash and cash equivalents
Cash and cash equivalent – beginning of period
Cash and cash equivalent – end of period
34
Marketletter 2Q16
IV.3 Financial Information and Result Analysis of Eletrobras Companies
(R$ Million)
Company
Net Operating Revenue
(R$ Million)
2016
2015
Service Result*
(R$ Million)
2016
2015
Profit/Loss of
Period*
(R$ Million)
2016
2015
Margin
EBITDA
(%)
2016
2015
EBITDA
(R$ Million)
2016
2015
Eletronorte
Chesf
Furnas
Eletronuclear
Eletrosul**
CGTEE
Amazonas GT
5,490
2,988
3,680
463
2,682
109
4,003
10,338
1,824
8,613
42
5,737
500
8,697
15,422
3,066
13,233
587
8,470
206
13,409
1,277
972
-3,709
114
-4,026
-14
-3,512
2,239
768
1,670
63
908
-235
1,680
244
175
-98
-129
-313
-292
-62
157
0
-81
-88
-236
0
-49
* Amounts for consolidation purposes
** The subsidiary Eletrosul results were adjusted by eliminating figures for sale to Eletronorte and recognition of
of granting non-realized profits intergroup.
593
99
593
297
-21
-89
0
73%
84%
87%
-275%
75%
-25%
-32%
20%
5%
19%
31%
-3%
-51%
-
the amortization for the period
(R$ Million)
Company
ED Acre
ED Alagoas
Amazonas D
ED Piauí
ED Rondônia
ED Roraima
Celg-D
Net Operating
Revenue
(R$ Million)
2016
2015
Service Result*
(R$ Million)
Profit/Loss of
Period*
(R$ Million)
2016
2015
EBITDA
(R$ Million)
2016
2015
228
181
-56
-12
-116
-36.8
-48
-4
-21%
-2%
708
1,370
610
856
132
658
1,836
621
571
120
-29
-441
-132
16
-121
31
-43
-1
39
-88
-108
-1,068
-240
-130
-149
-69.6
-631.4
-69.0
-17.1
-101.2
-11
-390
-112
35
-115
48
84
16
57
-83
-1%
-28.49%
-18%
4%
-87%
7.28%
5%
2%
10%
-69%
0
2,282
0
-70
0
-390.8
0
-11
-
0%
* Amounts for consolidation purposes
35
2016
2015
Margin
EBITDA
(%)
2016
2015
Marketletter 2Q16
IV.3.1 Financing and Loans – R$ Million
Financing and Loans
Local Currency (LC) + Foreign Currency (FC)
Empresa
Eletrobras
Eletronorte
Chesf
Furnas
Eletronuclear
Eletrosul
CGTEE
Amazonas GT
Itaipu
Binacional(1)
ED Acre
ED Alagoas
ED Amazonas
Energia
ED Piauí
ED Rondônia
ED Roraima
Eletrobras (a)
Others Creditors (b)
2018
2019
2020
2021
2022
309.29
255.87
230.79
237.85
231.29
217.48
940.06
280.02
281.10
175.59
140.88
144.04
147.75
1,412.01
5,004.02
16.42
895.00
296.98
245.95
136.50
179.90
7.04
477.00
146.72
259.06
335.90
75.70
452.00
138.11
254.82
275.80
70.40
473.00
138.11
244.49
279.70
62.50
495.00
138.11
243.42
279.70
22.50
317.00
119.55
183.23
243.50
17.70
876.00
578.90
640.49
206.60
0.40
507.40
1,156.00
78.10
136.13
-
329.60
1,909.00
120.55
630.23
-
154.60
1,151.00
167.11
166.37
-
81.22
592.00
179.22
144.36
-
59.13
390.00
192.23
124.94
-
59.13
387.00
206.17
97.55
-
187.55
1,007.00
4,939.95
89.88
-
1,402.10
10,577.00
7,439.83
3,460.92
1,757.70
429.10
262.60
550.86
587.27
626.46
668.70
296.70
58.24
455.99
957.33
1,021.34
1,090.08
1,163.92
1,240.14
442.82
9,422.45
50.74
219.00
34.56
178.00
28.30
154.00
28.02
113.00
28.02
101.00
13.45
62.00
10.66
39.00
7.00
2.00
2.00
2.00
-
-
-
193.75
879.00
130.31
219.09
216.31
215.17
209.84
126.86
44.33
-
-
-
-
-
-
-
1,161.91
61.33
166.52
10.25
31.00
161.46
6.91
12.46
125.67
6.47
11.04
95.30
6.46
10.36
67.54
4.35
372.92
43.76
4.79
-
-
-
-
-
-
-
845.25
737.46
51.37
346.15
77.22
12.14
(1) Amounts in USD Million.
36
2017
2018
2019
2020
2021
2022
After
2022
Total
(a+b)
2017
After
2022
Marketletter 2Q16
IV.3.2 Analysis Result of Generation and Transmission Companies
Eletronorte
The company presented a result 208.6% higher than in the 1Q16, from a profit of R$ 656.3 million to a
profit of R$ 2,026 million, mainly due to the factors described below.
Operating Revenue
Operating Revenue was 247.3% higher than in the previous quarter, from R$ 1,227 million to R$ 4,262.6
million, mainly due to the factors described below.
In generation:
Supply revenues reduced by 4.8% relative to the 1Q16, from R$ 726 million to R$ 691.1 million,due
mainly to the fact that the seasonality for energy was higher in the 1Q16.
Supply Revenues increased by 2.3% relative to the 1Q16, from R$ 261.4 million to R$ 267.3 million, with
no significant variation for the period, since the price variation in bilateral contracts with aluminum
producers was partially offset by new contracts.
Revenues from Short-Term Energy (CCEE) decreased by 39.1% relative to the 1Q16, from R$ 139 million
to R$ 84.6 million, due mainly to the reduction in the level of energy generated, especially by the Tucuruí
hydro, and also due to bilateral contracts that have relatively increased supply revenues.
In transmission:
Transmission revenues increased by 1,508% relative to the 1Q16, from R$ 208 million to R$ 3,342
million, due mostly to the acknowledgment of the financial revenue, which increased from R$ 83.1 million
in the 1Q16 to R$ 3,108.7 million in the 2Q16, due to the effects of MME Ordinance No. 120, of April 20th
2016, which set out the conditions for payment and remuneration relating to the Basic Network Existing
System (RBSE), amounting to R$ 3,034.6 million.
Construction Revenue increased by 762%, from R$ 14.1 million to R$ 121.6 million, with no effect on the
result, since it is offset by the cost of construction.
Operating Expenses
Operating Expenses increased by 65% relative to the 1Q16, from R$ 683 million to R$ 1,127 million in
the 1Q16, due mainly to the factors described below.
Personnel, material and service expenses increased by 8% relative to the 1Q16, from R$ 360.6 million to
R$ 389 million.
37
Marketletter 2Q16
Personnel expenses increased by 4.8% relative to the 1Q16, from R$ 293 million to R$ 307 million, due
mainly to the career plan and to provisions for vacations.
Materials expenses increased by 30.3% relative to the 1Q16, from R$ 7 million to R$ 10 million, due
mainly to the acquisition of spare parts for the Company's operating activities.
Services Expenses increased by 20.7% relative to the 1Q16, from R$ 60 million for R$ 72 million, due
mainly to the adjustment of contracts of surveillance, cleaning and other third-party labor as of February
of 2016.
Expenses with Energy Purchased for Resale decreased by 13.2% relative to the 1Q16, from R$ 45 million
to R$ 39 million. Expenses in the period are due, mainly, to the energy imported from Venezuela
(CORPELEC contract) for resale to the distribution company Boa Vista Energia S.A., paid in dollar, which
expires in 2021.
Fuel Expenses decreased by 100% relative to the 1Q16, from R$ 3.7 million to R$ 0 million, due mainly
to the interruption of thermal generation at the TPU Santana after the interconnection of Amapá to the
SIN in 2015.
Remuneration and Reimbursement expenses decreased by 9% relative to the 1Q16, from R$ 57 million to
R$ 52 million, due mostly to the reduction of generation revenue in the period.
Operating provisions decreased by 445.2% relative to the 1Q16, from a revenue of R$ 66 million to an
expense of R$ 227 million, due to mainly the acknowledgement of provision in the amount of R$ 163
million for the tax created by the State of Pará, in December 2014, on water discharge increase in the
State's hydro plants for the 6MO16. Up until the 1Q16, due to legal claims concerning the
constitutionality of the related tax, only the values relative to the year of 2015 had been recorded.
Despite the provision, Eletronorte continues to claim for the unconstitutionality of this tax. Moreover, in
the 1Q16 an atypical value was recorded due the reversion of provision in the amount of R$ 75 million
concerning he dispossession lawsuit for the area of the Balbina hydro plant.
Other Expenses increased by 53.9% relative to the 1Q16, from R$ 33.3 million to R$ 51.3 million, due
mainly to the hydrological risk and the renewal of the contract of operational risk insurance of the
premises of the company.
Financial Result
The financial result decreased from R$ 109.1 million in the 1Q16 to a negative amount of R$ 29.8 million
in the 2Q16. The reduction in the 2Q16 occurred mainly, due to the factors described below.
38
Marketletter 2Q16
Revenues from Financial Investments decreased by 46.8% relative to the 1Q16, from R$ 40.5 million to
R$ 21.6 million, due mainly to the redemption of investments for liquidation of the company's
commitments.
Moratorium decreased by 74.1% relative to the 1Q16, from R$ 42.6 million to R$ 11 million, due mainly
to the reclassification of monetary adjustments on Ceron's claims to the monetary variation accounts.
Net Monetary Variations decreased by 90.4% relative to the 1Q16, from R$ 56 million to R$ 5 million,
due mainly to the updates in the CCEE invoices acknowledged in the amount of R$ 18 million, and the
adjustments of Ceron's updates recorded in the 2Q16.
Derivatives Gains and Losses decreased by 45.9% relative to the 1Q16, from R$ 79 million to R$ 43
million, due mostly to the value of the London Metal Exchange (LME), used as a parameter in the
calculation for bilateral contracts with aluminum producers1, and to the gain recorded in the 2Q16 from
the debentures2 issued by the Estação Transmissora de Energia S/A SPE, which was incorporated by
Eletronorte.
Other Financial Income increased by 115.5% relative to the 1Q16, from R$ 7 million to R$ 16 million, due
mainly to the abatements obtained by anticipation of payment of purchase of equity interest of Norte
Brasil Transmissora de Energia and Construtora Integração (NBTE), and the assets acquired from Porto
Velho Transmissora de Energia S.A. (PVTE) with Eletrosul.
1
Eletronorte entered, in 2004, long-term contracts for the supply of electricity to two of its main customers: the Consórcio de Alumínio do
Maranhão – Alumar, formed by companies BHP Billiton, Alcoa and Alumínio Brasileiro S.A. - Albras. Part of these long-term contracts' revenue is
associated with the payment of a premium linked to the international price of aluminum, quoted on the London Metal Exchange (LME), as an active
basic definition for purposes of the monthly values of the premium. The premium is considered an embedded derivative because its pricing is
derived from the price of aluminum which is defined, in this case, as the underlying asset. The calculation of the prize of these contracts includes
the concept of cap and floor band, related to aluminum price quoted on the LME. The maximum and minimum price of LME is limited to US$
2,773.21/ton and US$ 1,450/ton, respectively. Whereas the premium is associated with the commodity price of aluminum on the LME, you can
assign the fair value of these contracts. In June 2016, the value of the LME closed at US$ 1,600.51/ton, representing an increase by 7.03% over
relative to December 2015, when the commodity price reached US$ 1,495.35/ton. In contrast, in the same period of analysis, there was an
appreciation of the Real against the US dollar, with the consequent negative variation on the pricing of the embedded derivative. However, the
positive changes in the aluminum prices contributed most strongly to providing a resulting increase in anticipation of the fair value of the
embedded derivatives in the period. The gain on the transaction with embedded derivatives in June 2016, was R$ 95,227 (2015 - loss of R$ 96,294).
2
The Estação Transmissora de Energia S.A., former investee of Eletronorte, which was incorporated on March 31st, 2014, signed a debenture
issuing contract in June 2011, with Banco da Amazonia S.A. (BASA), which manages the resources of the Fundo de Desenvolvimento da Amazônia
(FDA), with a fundraising goal for implementation of the rectification station project and the grounding of the collector substation. The contract has
a contractual clause concerning the possibility of conversion of these debentures at the discretion of SUDAM, limited to 50% of the issued
debentures. According to the evaluation of the Company, it is possible to assign a value to the amount that would be assigned to SUDAM should
this conversion occur. For these reasons there is the identification of an embedded derivative in the contract. The gain on this derivative transaction
in June 2016, is R$ 26,414 (2015 - gain of R$ 12,004), and is due to the payments of the main contract, net of interest recognized in the period which
reduces the obligation over time. Moreover, the expectation of change for indexing rates of the contract reduced to two years (SELIC of 14.25% to
10.75% in 2018 and TJLP of 8.5% to 7.5% in 2018).
39
Marketletter 2Q16
Shareholdings
The result of the Shareholdings account worsened, reaching in the 2Q16 an expense of R$ 30 million,
compared to a revenue of R$ 60 million in the 1Q16, influenced by the acknowledgment of the
impairment in the amount of R$ 60 million of the Linha Verde Transmissora de Energia SPE due to due to
agreement with the SPE of the abatement rate used for the calculations for valuation of assets.
Income Tax and Social Contribution
Provision for Income Tax and Social Contribution increased, reaching, in the 2Q16, an expense in the
amount of R$ 1,050 million, compared to an expense in the amount of R$ 57 million in the 1Q16,
influenced by the acknowledgment of RBSE, whose taxation, which amounts to R$ 1,031.8 million, will be
deferred as receipt of payment of the RBSE financial asset.
40
Marketletter 2Q16
Chesf
The company presented in 2Q16 a positive variation of R$ 5,752.5 million relative to the 1Q16, from a
loss of R$ 7.6 million to a profit of R$ 5,744.9 million, mainly due to the factors described below.
Operating Revenue
The net Operating Revenue increased by 996.4% relative to the 1Q16, from R$ 864 million to R$ 9,474
million, due mainly to the factors described below.
In generation:
Energy Purchased for Resale expenses decreased by 1.9% relative to the 1Q16, from R$ 353.3 million to
R$ 346.6 million, due mainly to decontracting and seasonality of energy.
Supply Revenues increased by 4.4% relative to the 1Q16, from R$ 191.7 million to R$ 200.2 million, due
mostly to the increase in the rate of contracts for purchase and sale of electric energy (CCVE) due to the
change from the wet season energy tariff (1Q16) to the dry season tariff (2Q16) .
Revenues from Short-Term Energy (CCEE) increased by 105.0%% relative to the 1Q16, from R$ 10.0
million to R$ 20.6 million, due mainly to settlements in the CCEE occurred in the periods under analysis
and the increase in the price of the PLD.
In transmission:
Transmission revenues increased by 1,909.0% relative to the 1Q16, from R$ 450.3 million to R$ 9,046.0
million, mostly due to the acknowledgement of financial revenue, from R$ 6.1 million in the 1Q16 to R$
8,635.0 million in the 2Q16, due to the effects of MME Ordinance No. 120, of April 20th 2016, which
established the conditions of payment and remuneration on the Basic Network Existing System (RBSE),
amounting to R$ 8,618 million, and also to the following factors:
Operating and Maintenance Revenues increased by 9% , from R$ 236 million in the 1Q16 to R$ 258
million in the 2Q16, due to the update of the Annual Allowed Revenue - RAP, as well as to new
increments for acknowledgement of investments in reinforcements and improvements in transmission
lines.
Other Income decreased by 70% relative to the 1Q16, R$ 8.734 million to R$ 14.878 million, due mainly
to the increase in revenues from engineering services.
Operating Expenses
Operating Expenses decreased by 10.4% relative to the 1Q16, from R$ R$ 910 million to R$ 815 million,
due mainly to the factors described below.
41
Marketletter 2Q16
Personnel, Materials and Services Expenses increased by 3.8% relative to the 1Q16, from R$ 287 million
to R$ 298 million.
Personnel expenses increased by 3.13% relative to the 1Q16, from R$ 231.8 million to R$ 239.0 million
due mostly to provisions for employee vacations.
Materials expenses decreased by 12.7% relative to the 1Q16, from R$ 5.5 million to R$ 4.8 million, due
mainly to the decrease in expenses with automotive materials.
Services Expenses increased by 8.7% relative to the 1Q16, from R$ 49.5 million to R$ 53.8 million, due
to mainly to expenses with technical and administrative services.
Expenses with Energy Purchased for Resale decreased by 10,8% relative to the 1Q16, from R$ 102.9
million to R$ 91.8 million, due mainly to the seasonality which impacted the contracts with ESBR Energia Sustentável do Brasil S.A. (Jirau hydro), whose energy is bought by Chesf, in proportion to the
share capital of the SPE in order to enable the Project Finance of the plant.
Fuel Costs decreased by 100.0% relative to the 1Q16, from R$ 7.8 million, mainly due to interruption of
power generation at the Camaçari plant.
Operating Provisions decreased by 65.8% relative to the 1Q16, from R$ 59.9 million to R$ 20.5 million,
due mainly to the increase of provisions for litigation contingencies in lawsuits in the 1Q16, such as the
one related to the GSF (R$ 21 million), which came in lower in the 2Q16.
Financial Result
The financial result decreased from R$ 27.5 million in the 1Q16 to R$ 21.1 million in the 2Q16. The
reduction in the 2Q16 occurred mainly, due to the factors described below.
Revenues from Financial Investments decreased by 51.9% relative to the 1Q16, from R$ 24.3 million to
R$ 11.7 million, due mainly to the redemption of investments for liquidation of the company's
commitments.
Other Financial Expenses decreased by 42.7% relative to the 1Q16, from R$ 18.3 million to R$ 10.5
million, due mostly to Aneel fines being recorded in the 1Q16.
Shareholdings
The result of Shareholdings worsened, reaching R$ 12.8 million in the in 2Q16, compared to R$ 20.3
million in the 1Q16, influenced, mainly, by the result of Sistema de Transmissão Nordeste S.A (STN) SPE
in the 2Q16, given that, in the 1Q16, a deferred tax asset was recorded, which did not occur in the 2Q16.
42
Marketletter 2Q16
Income Tax and Social Contribution
Provision for Income Tax and Social Contribution increased, reaching, in the 2Q16, an expense in the
amount of R$ 2,947.8 million, compared to an expense in the amount of R$ 9.7 million in the 1Q16,
influenced by the recognition of the RBSE, whose the payment of R$ 2,931 million will be difined
according to receiving of the financial remuneration of the above-mentioned RBSE.
43
Marketletter 2Q16
Furnas
The company presented a result 8,204% higher than in the 1Q16, from a profit of R$ 100.8 million to a
profit of R$ 8,370 million, mainly due to the factors described below.
Operating Revenue
Net Operating revenue increased by 1,011% relative to the 1Q16, from R$ 1,274 million to R$ 14,148
million, due mainly to the factors described below.
In generation:
Supply Revenues decreased by 6% relative to the 1Q16, from R$ 890 million to R$ 836.2 million, due
mainly to seasonality and decontracting of energy.
Revenues from Short-Term Energy (CCEE) increased by 998.6% relative to the 1Q16, from R$ 5.3 million
to R$ 58.1 million, due mainly to the accounting for the liquidation of with the CCEE.
Construction Revenue from power plants increased by 127.8% relative to the 1Q16, from R$ 25.5 million
negative to R$ 7.1 million positive, but with no effect on the result since it has equivalent value at the
cost of construction.
In transmission:
Transmission revenues increased by 3,334% relative to the 1Q16, from R$ 384.8 million to R$ 13,214.7
million, due mostly to the acknowledgment of the financial revenue, which increased from R$ 46.3 million
in the 1Q16 to R$ 12,750.4 million in the 2Q16, due to the effects of MME Ordinance No. 120, of April
20th 2016, which set out the conditions for payment and remuneration relating to the Basic Network
Existing System (RBSE), amounting to R$ 12,710.3 million.
Operation and Maintenance Revenues increased by 216.6%, from R$ 7.8 million to R$ 24.8 million,
mostly due to the annual update of the Annual Allowed Revenue - RAP, as well as to new increments for
acknowledgment of investments in reinforcements and improvements in transmission lines.
Construction Revenue increased by 194.3%, from R$ 58.3 million to R$ 171.8 million, but with no effect
on the result since it has equivalent value at the cost of construction.
Operating Expenses
Operating Expenses increased by 31.3%, from R$ 946 million to R$ 1,242 million, due mostly to the
factors described below.
Personnel, Materials and Services expenses increased by 14.2% relative to the 1Q16, from R$ 423.3
million to R$ 483.1 million.
44
Marketletter 2Q16
Personnel expenses increased by 4.7% relative to the 1Q16, from R$ 282.5 million to R$ 271.7 million.
Materials costs increased by 48.4% relative to the 1Q16, from R$ 6.8 million to R$ 10.1 million, due
mainly to consumption of inputs for operation and maintenance of generation and transmission facilities.
Services Expenses increased by 53.3% relative to the 1Q16, from R$ 131,3 million to R$ 201.3 million,
due to mainly to the regularization of accounting for service contracts.
Construction expenses decreased by 443.6%, from R$ 32.9 million to R$ 178.8 million, but with no effect
on the result since it has equivalent value at the cost of construction.
Fuel Expenses decreased by 26.9% relative to the 1Q16, from R$ 128.5 million to R$ 93.9 million, due
mainly to the reduction in the generation of the Santa Cruz thermal plant.
Operating Provisions increased by 158.4% relative to the 1Q16, from a reversal of R$ 75.8 million to R$
44.3 million negative, due mainly to the increase in provisions for labor, environmental, land, tax and
civil lawsuit contingencies, totaling R$ 134.2 million.
Financial Result
Net Financial Result decreased from a negative amount of R$ 180.5 million in the 1Q16 to a negative
amount of R$ 275.5 million in the 2Q16 due mainly to the factors described below.
Revenues from Financial Investments decreased by 43% relative to the 1Q16, from R$ 34.7 million to R$
19.8 million, due mainly to the reduction in the balance of financial investments in the period.
Moratorium decreased by 71.2% relative to the 1Q16, from R$ 6.6 million to R$ 1.9 million, due mainly
to the arrears surcharges on electricity sold in the amount of R$ 4.6 million.
Other Financial Expenses increased by 32.9% relative to the 1Q16, from R$ 33,5 million to R$ 44,5
million, due mainly to the payment of IOF tax on the loan granted by the BNDES in April and May in the
amount of R$ 4.3 million and to the payment of fines and interest on late payment of income tax (R$ 3.3
million) and Social Contribution on Net Income (R$ 2 million) in 2T16.
Shareholdings
The result of Shareholdings improved, reaching R$ 58 million in the 2Q16, compared to a negative result
of R$ 20 million in the 1Q16, due to the improvement in the results of Madeira Energia, Serra do Facão
and IE Madeira SPE's partially offset by the deterioration in the results of the SPEs Triângulo Mineiro,
Enerpeixe and Tijoa Participações.
45
Marketletter 2Q16
Income Tax and Social Contribution
Provision for Income Tax and Social Contribution increased, reaching, in the 2Q16, an expense in the
amount of R$ 4,318.2 million, compared to an expense in the amount of R$ 26.5 million in the 1Q16,
influenced by the acknowledgment of RBSE, whose taxation, which amounts to R$ 4,321.5 million, will be
deferred as receipt of payment of the RBSE financial asset.
46
Marketletter 2Q16
Eletronuclear
The Company's result changed from a profit of R$ 28.8 million in the 1Q16 to a loss of R$ 4.054 million in
the 2Q16, mainly due to the factors described below.
Operating Revenue
Net Operating Revenue increased by 1% relative to the 1Q16, from R$ 635.3 million to R$ 641.4 million
in the 2Q16, mainly due to the factors described below.
In generation:
Supply Revenue increased by 0.96% relative to the 1Q16, from R$ 722 million to R$ 729 million, due
mainly to the variable portion of the revenues3, given the fact that the amount of energy sold was
greater than the assured energy.
Operating Expenses
Operating Expenses increased relative to the 1Q16, from R$ 446.1 million in the 1Q16 to R$ 4,539.7
million in the 2Q16, due mainly to the factors described below.
Personnel, Materials and Services expenses increased by 10.4% relative to the 1Q16, from R$ 172.4
million to R$ 190.2 million in the 2Q16.
Personnel Expenses decreased by 5.68% relative to the 1Q16, from R$ 124.2 million to R$ 117.1 million,
due mainly to reduction of expenses with employee vacations and related social charges.
Materials expenses increased by 232.40% relative to the 1Q16, from R$ 3.1 million to R$ 10.4 million,
due mainly to the use of materials during the scheduled production stop at the Angra I nuclear plant.
Services Expenses increased by 39.11% relative to the 1Q16, from R$ 45.1 million to R$ 62.7 million,
due mainly to contractor services during the scheduled stop at the Angra I nuclear plant.
Operating Provisions increased relative to the 1Q16, from R$ 16.7 million to R$ 4,106.4 million, due
mainly to the Impairment of Angra 3, in the amount of R$ 2.4 billion, and the onerous contract of Angra
3, in the amount of R$ 1.7 billion.
Other Expenses decreased by 32.59% relative to the 1Q16, from R$ 39.3 million to R$ 26.5 million, due
mainly to a reduction in taxes and compulsory fees. In the 1Q16 there was recording of the property tax
3
The revenue of Angra I and Angra II is divided in two parts: FIXED REVENUE approved by Aneel, which corresponds to an amount of assured
energy (contracted), and VARIABLE REVENUE, which corresponds to the sale of the amount of energy supplied more or less than the assured one.
When it is positive, the exceeding amount is invoiced to the distribution companies at the rate of 50% of the average PLD of the year. When the
supply is lower, it is returned at the rate of 100% of the average PLD of the year.
47
Marketletter 2Q16
(IPTU) retroactive to the period from 2011 to 2015 (amounting to R$ 13 million), which is being settled in
60 monthly installments.
Financial Result
Net Financial Result changed from a negative amount of R$ 126.2 million in the 1Q16 to a negative
amount of R$ 118 million in the 2Q16, due mainly to the factors described below.
Debt Charges increased by 26.87% relative to the 1Q16, from R$ 19.7 million to R$ 25 million, due
mainly to new loans for repayment of obligations with the nuclear fuel supplier.
Net Foreign Currency Exchange Rate Variations decreased by 34.27% relative to the 1Q16, from R$ 25.2
million negative to R$ 16.6 million negative, due mainly to restatement.
Net Monetary Variation decreased by 40.28% relative to the 1Q16, from R$ 24.3 million negative to R$
14.5 million negative, due mainly to the monetary variation on the property tax (IPTU) retroactive to the
period from 2011 to 2015 (amounting to R$ 8 million) in the 1Q16.
Other Financial Expenses increased by 11.05% relative to the 1Q16, from R$ 58.3 million to R$ 64.7
million, due mainly to the losses of income from the decommissioning fund.
48
Marketletter 2Q16
Eletrosul
The company presented, in the 2Q16, a result higher than in the 1Q16, from a loss of R$ 26.6 million in
the 1Q16 to a profit of R$ 929.8 million in the 2Q16, due mainly to the factors described below.
Operating Revenue
Net Operating Revenue increased by 399.9% relative to the 1Q16, from R$ 373.2 million in the 1Q16 to
R$ 1,865.6 million in the 2Q16, due mainly to the factors described below.
In generation:
Supply revenues increased by 1.72% relative to the 1Q16, from R$ 112 million to R$ 113.9 million, due
mainly to a higher volume of wind generation by Cerro Chato 1, 2 and 3; Coxilha Seca, Capão do Inglês
and Galpões wind farms.
Short-Term Energy revenues (CCEE) increased by 9.68% relative to the 1Q16, from R$ 63.1 million to R$
69.2 million, due mainly to variation in the Price of Settlement of Differences in the South and Southeast
regions and to the increase in energy traded via bilateral contracts.
In transmission:
Transmission revenues increased by 621.40% relative to the 1Q16, from R$ 238.5 million to R$ 1,720.3
million, due primarily to the acknowledgment of the financial revenue, which increased from R$ 41.9
million in the 1Q16 to R$ 1,498.3 million in the 2Q16, due to the effects of MME Ordinance No. 120, of
April 20th 2016, which set out the conditions for payment and remuneration relating to the Basic Network
Existing System (RBSE), amounting to R$ 1,447.3 million
Construction Revenue increased by 91.3%, from R$ 20.1 million to R$ 38.6 million, due to concession
contract 001/2015, which has no effect on the result since it is offset at the construction expenses.
Other Revenues
Other Revenues decreased by 9.82% relative to the 1Q16, from R$ 6.3 million to R$ 5.7 million, due
mainly to reduced revenue from provision of services to third parties, such as use of network for
communication services and consulting services.
Operating Expenses
Operating Expenses increased in the 2Q16 relative to the 1Q16, from R$ 268.9 million to R$ 302.9
million, due mainly to the factors described below.
Personnel, Materials and Services expenses increased by 8.8% relative to the 1Q16, from R$ 121.3
million to R$ 131.9 million.
49
Marketletter 2Q16
Personnel expenses increased by 6.38% relative to the 1Q16, from R$ 93.6 million to R$ 99.6 million,
due mainly to the adjustment in provisions for vacations.
Services expenses increased by 19.57% relative to the 1Q6, from R$ 25.0 million to R$ 29.9 million,
mainly due to seasonality in the use of resources.
Energy Purchased for Resale expenses decreased by 16.45% relative to the 1Q16, from R$ 70.5 million
to R$ 58.9 million, due mainly to adjustment made in the 1Q16 related to reprocessing of energy settled
in the CCEE in previous months
Operating Provisions increased by 1,613.11% relative to the 1Q16, from R$ 0.4 million to R$ 6.7 million,
due mainly to the increase in expenses with labor provisions.
Other Expenses increased by 16.37% relative to the 1Q16, from R$ 10.7 million to R$ 12.3 million.
Financial Result
Net Financial Result changed from a negative amount of R$ 116.9 million in the 1Q16 to a negative
amount of R$ 68.4 million in the 2Q16, due mainly to the factors described below.
Revenues from Financial Investments decreased by 18.86% relative to the 1Q16, from R$ 12.1 million to
R$ 9,9 million, due mostly to the variation in restatement rates.
Net Foreign Currency Exchange Rate Variations increased by 160.81% relative to the 1Q16, from R$ 11.6
million to R$ 30.4 million, due mainly to the reduction in the price of Euro which impacted loan expenses,
recording positive result for currency fluctuations.
Other Expenses decreased by 74.75% relative to the 1Q16, from R$ 40.7 million to R$ 10.3 million, due
mainly to the rebates granted in the 1Q16 due to the anticipation of installments from the negotiation of
assets with Eletronorte.
Shareholdings
Shareholdings reached an expense of R$ 54.4 million in the 2Q16, compared to an expense of R$ 18.1
million in the 1Q16, influenced, mainly, by increased losses in the Energia Sustentável do Brasil
Participações (Jirau hydro) investee.
50
Marketletter 2Q16
Income Tax and Social Contribution
The provision for income tax and social contribution increased, reaching, in the 2T16, an expense of R$
509.0 million, compared to an expense of R$ 4.8 million in the 1T16, influenced by the recognition of
RBSE, whose taxation, which amounts to R$ 492.1 million, will be deferred as receipt of payment of the
RBSE financial asset.
51
Marketletter 2Q16
CGTEE
CGTEE presented in the 2Q16 a result 88.1% higher than the result for the 1Q16, from a loss of R$ 279.6
million to a loss of R$ 33.2 million in 2Q16.
Operating Revenue
Net Operating Revenue increased by 1,590% relative to the 1Q16, from R$ 13.6 million to R$ 230.2
million, due mainly to the factors described below.
In generation:
Supply Revenues increased by 1,012.6% relative to the 1Q16, from R$ 21.9 million to R$ 243.2 million,
due to mainly to the acknowledgment of revenue estimate from financial settlements in the Electric
Energy Trading Chamber (CCEE), including prior periods.
Operating Expenses
Operating Expenses decreased in the 2Q16 relative to the 1Q16, from R$ 190.1 million to R$ 151.7
million, due mainly to the factors described below.
Personnel, Materials and Services expenses increased by 9.2% relative to the 1Q16, from R$ 68.7 million
to R$ 62.4 million.
Personnel expenses increased by 8.1% relative to the 1Q16, from R$ 26.2 to R$ 28.3 million, due mainly
to the increase in provision for vacations.
Materials expenses decreased by 7.4% relative to the 1Q16, from R$ 22.9 million to R$ 21.2 million, due
mainly to a reduction in the price of lime, used in the reduction of polluting gases.
Services expenses decreased by 34.5% relative to the 1Q16, from R$ 19.6 million to R$ 12.9 million, due
mainly to reduced cost of maintenance for power plant equipment.
Energy Purchased for Resale expenses decreased by 45.7% relative to the 1Q16, from R$ 61.3 million to
R$ 33.3 million, due to the reversal of provision for compensation to client distributors for insufficient
power generation.
Fuel costs decreased by 21.9% relative to the 1Q16, from R$ 12.9 million to R$ 10.1 million due mainly
to a small decline in coal consumption in light of lower energy generation in the 2Q16.
Operating Provisions presented larger reversals, from R$ 6.1 million to R$ 0.1 million in the 2Q16, due
mainly to reversals of provisions for labor lawsuits.
52
Marketletter 2Q16
Other Expenses increased by 40.9% relative to the 1Q16, from R$ 12.6 million to R$ 17.7 million, due
mainly to contractual indemnity to the lime supplier.
Financial Result
Net Financial Result changed from a negative amount of R$ 103.2 million in the 1Q16 to a negative
amount of R$ 111.7 million in the 2Q16, mainly due to Debt Charges, which increased by 8.8% relative
to the 1Q16, from R$ 100.2 million to R$ 109.0 million, on account of the increasing balance of loans
payable.
53
Marketletter 2Q16
Eletropar
The company presented, in the 2Q16, a result 71% higher than in the 1Q16, from a profit of R$ 1.4
million to a profit of R$ 2.4 million, mainly due to the factors described below.
Shareholdings
Shareholdings increased by 151.3% relative to the 1Q16, from R$ 0.9 million to R$ 2.2 million, due to
the acknowledgment of equivalence of the CTEEP and in the EMAE case because there was no
equivalence in the 1Q16.
Operating Expenses
Operating Expenses decreased relative to the 1Q16, from R$ R$ 1.9 million to R$ 1.7 million, due mainly
to the factors described below.
Personnel, Materials and Services expenses increased by 4.2% relative to the 1Q16, from R$ 0.97 million
to R$ 1.01 million.
Personnel expenses showed no change relative to the 1Q16, remaining at R$ 0.8 million.
Materials expenses increased by 90.9% relative to the 1Q16, from R$ 0.01 million to R$ 0.02 million, due
mainly to the seasonality of office supplies purchases. Such purchases occur every 4 to 6 months.
Services expenses increased by 14.7% relative to the 1Q16, from R$ 0.18 million to R$ 0.20 million, due
mainly to the payment to Bradesco for the book-entry services concerning the "payment of dividends"
event.
Operating Provisions decreased by 91.6% relative to the 1Q16, from R$ 0.71 million to R$ 0.06 million,
due mainly to the acknowledgment in the 1Q16 of loss in Eletropaulo's shares, classified as available for
sale, which did not occur in the 2Q16 since they have appreciated.
Other Expenses increased by 151% relative to the 1Q16, from R$ 0.03 million to R$ 0.06 million, due
mainly to the CVM annual membership fee, which is accounted for in January.
Financial Result
Net Financial Result changed from R$ 2,8 million in the 1Q16 to R$ 1.5 million in 2Q16, mainly due to
Financial Investment Revenues that decreased by 30.5% relative to the 1Q16, from R$ 2,899 million to
R$ 2,014 million in the 2Q16, especially due to reduction of the amount in Investment Funds.
54
Marketletter 2Q16
Amazonas GT
The company presented, in the 2Q16, a net result 24.0% higher than in the 1Q16, from a loss of R$
134.3 million in the 1Q16 to a loss of R$ 102.0 million in the 2Q16, due mainly to the factors described
below.
Operating Revenue
Net Operating Revenue increased by 38.9% relative to the 1Q16, from R$ 65.6 million in the 1Q16 to R$
91.2 million in the 2Q16, mainly due to the factors described below.
In generation:
Supply Revenues increased by 33.8% relative to the 1Q16, from R$ 114.7 million to R$ 153.6 million,
due mostly to the result of contracts for purchase and sale of electric energy (CCVE) with the Amazonas
Distribuidora de Energia.
Operating Expenses
Operating Expenses decreased in the 2Q16 relative to the 1Q16, from R$ 136.1 million to R$ 101.8
million, mainly due to the factors described below.
Personnel, Materials and Services expenses increased by 19.7% relative to the 1Q16, from R$ 35.2
million to R$ 42.1 million.
Personnel expenses increased by 3.9% relative to the 1Q16, from R$ 29.4 million to R$ 30.6 million.
Materials expenses increased by 42.6%, from R$ 1.8 million to R$ 2.6 million.
Services Expenses increased by 126.8% relative to the 1Q16, from R$ 3.9 million to R$ 8.9 million, due
to mainly to restatement of surveillance and cleaning services.
Fuel expenses decreased by 104.2% relative to the 1Q16, from a gross amount of R$ 129.4 million to a
gross amount of R$ 5.4 million, due mainly to the deactivation of some fuel-based plants. It is worth
highlighting that, as of April, only the block 4 of the Mauá thermal plant was in operation and, therefore,
there was a significant decrease in fuel consumption.
Operating Provisions decreased by 155.1% relative to the 1Q16, from R$ 1.4 million (provision) to R$ 0.7
million (reversal), due mainly to the settlement of labor indemnifications.
Recovery of Expenses - System Service Charge - ESS increased by 95.1% relative to the 1Q16, from R$
77.2 million to R$ 150.6 million, due mainly to the recording, in the 1Q16 of the deduction of PIS and
Cofins on the compensation of the ESS, in the amount of R$ 32.6 million for the fiscal year of 2015.
55
Marketletter 2Q16
Other Expenses increased by 565.3% relative to the 1Q16, from R$ 29.4 million to R$ 195.9 million, due
mainly to the recording of the expenses with purchased fuel for thermal plant lessors, as of the 2Q16,
pursuant to the provisions of MME Ordinance No. 015/2016.
Financial Result
Net Financial Result changed from a negative amount of R$ 63.8 million in the 1Q16 to a negative
amount of R$ 77.2 million in the 2Q16, due mainly to the factors described below.
Revenues from Financial Investments decreased by 32.9% relative to the 1Q16, from R$ 7.4 million to
R$ 5.0 million.
Debt Charges increased by 17.7% relative to the 1Q16, from R$ 56.8 million to R$ 66.8 million, due
mainly to moratorium interest on the Contract No. 3,251/15, which, as of March, with the end of the
grace period, began to be charged. The company, however, is not liquidating this liability. Debt
renegotiation of this contract is under way with the Eletrobras holding company.
Net Monetary Variations decreased by 70.2% relative to the 1Q16, from R$ 17.1 million negative to R$
5.1 million negative, due mainly to a reduction on the index used to update the El Paso lawsuits.
Other Financial Income increased by 55.2% relative to the 1Q16, from R$ 2.7 million to R$ 4.2 million,
due mainly to disallowances made on invoices from energy lessors.
Other Financial Expenses increased by 100% relative to the 1Q16, since in the 1Q16, only an amount of
R$ 0.2 million was recorded in this section and, in the 2Q16, an amount of R$ 14.4 million was recorded,
due mainly to the recording of interest and fines on the PIS and the Cofins not collected in the 1Q16.
56
Marketletter 2Q16
IV.3.3 Analysis Result of Distribution Companies
ED Amazonas Energia
The company presented, in the 2Q16, a net result 40.4% higher than in the 1Q16, from a loss of R$ 817
million in the 1Q16 to a loss of R$ 487.5 million in the 2Q16, due mainly to the factors described below.
Operating Revenue
Net Operating Revenue increased by 12.3% relative to the 1Q16, from R$ 645.6 million to R$ 724.8, due
mainly to the factors described below.
In generation:
Supply Revenues increased by 99% relative to the 1Q16, from R$ 76.1 million to R$ 151.5 million.
Short-Term Energy revenues increased by 243.82% relative to the 1Q16, from R$ 38.3 million to R$
131.6 million, due mainly to the revenue from energy sold in the CCEE at the price of settlement of
differences - PLD in February and March 2016 which was recorded in April 2016.
Construction Revenues increased by 100% relative to the 1Q16, from R$ 0 million to R$ 4.3 million, with
no effect in the result since it has value equivalent to the construction cost.
In distribution:
Supply Revenues decreased by 4% relative to the 1Q16, from R$ 634.5 million to R$ 609.2 million, due
mainly to restatement.
The Regulatory Assets and Liabilities account (Installement "A" - CVA) increased by 180.8% relative to
the 1Q16, from R$ 15 million negative to R$ 42 million negative, due mainly to the constitution amount
of negative CVA for 2016 only recorded in May 2016, since the value of the ACR acknowledged in the
tariff was higher than the average tariff of contracts traded in the ACR.
Other Operating Revenues
Other Operating Revenues increased by 62.97% relative to the 1Q16, from R$ 55 million to R$ 91
million, due mainly to the accounting value of R$ 20 million related to the balance of the reduction of
tariffs of March 2016 which was recorded in April 2016.
Operating Expenses
Operating Expenses decreased in the 2Q16 relative to the 1Q16, from R$ R$ 942.8 million to R$ 912.4
million, due mainly to the factors described below.
57
Marketletter 2Q16
Personnel, Materials and Services expenses increased by 30.2% relative to the 1Q16, from R$ 122.3
million to R$ 159.3 million.
Personnel expenses increased by 17.21% relative to the 1Q16, from R$ 79 million to R$ 92 million, due
mainly to increased medical and dental care expenses.
Services Expenses increased by 55.61% relative to the 1Q16, from R$ 39 million to R$ 60 million, due to
mainly to costs of services for the maintenance of plants and distribution networks.
Expenses with Energy Purchased for Resale increased by 16.94% relative to the 1Q16, from R$ 400
million to R$ 468 million, due mainly to the cost of energy traded with the CCEE and to the Price of
Settlement of Differences - PLD in February and March 2016, which was recorded in April 2016.
Expenses with Charges on the Usage of the Electric Network decreased by 15.56% relative to the 1Q16,
from R$ 23 million to R$ 20 million, due mainly to a recording in March 2016 of previous months' invoices
of the Transmission System.
Fuel Expenses decreased by 278.67% relative to the 1Q16, from a negative amount of R$ 88 million to a
positive amount of R$ 157 million, due mainly to the acknowledgment of the compensation of the CCC.
Operating Provisions increased by 159.30% relative to the 1Q16, from R$ 105 million to R$ 273 million,
due mainly to the provision for civil lawsuits, with emphasis on the collection from the following
Independent Producers (PIES): R$ 32 million from the Companhia Energética Manauara, R$ 90 million
from PIE Breitener Tambaqui and R$ 31 million from PIE Rio Amazonas Energia S/A.
Financial Result
Net Financial Result changed from a negative amount of R$ 384.9 million in the 1Q16 to a negative
amount of R$ 241.4 million in the 2Q16, due mainly to the factors described below.
Moratorium increased by 83.51% relative to the 1Q16, from R$ 17 million to R$ 31 million, due mainly to
a recording in June 2016 of a moratorium in the amount of R$ 31 million on the energy bill of arrears on
energy account for the light bill settlement in installments.
Net Monetary Variations decreased by 367.80% relative to the 1Q16, from a negative monetary variation
of R$ 1.4 million to a positive monetary variation of R$ 4 million, due mainly to the monetary update
relative to the liquidation of advance payments for the purchase of generating groups in the amount of
R$ 4.6 million.
58
Marketletter 2Q16
Other Financial Revenues increased by 189.56% relative to the 1Q16, from R$ 159 million to R$ 460
million, due mainly to the acknowledgment of accrued interests on the CCC/CDE compensation of
expenses for the acquisition of fuel until April 30th of 2016, not yet reimbursed for force of requirement
of economic and energy efficiency, pursuant to article 13, proposition IX of Law 10,438/2002 updated by
Law 13,299/16.
Other Financial Expenses increased by 34.34% relative to the 1Q16, from R$ 441 million to R$ 593
million, due mainly to updates on the debt with BR Distribuidora.
Shareholdings
The
result of Shareholdings presented a variation by 56.8% relative to the 1Q16, from a negative
amount of R$ 135 million in the 1Q16 to a negative amount of R$ 58 million in the 2Q16, influenced by
the result of the subsidiary Amazonas GT.
59
Marketletter 2Q16
ED Acre
The company presented a variation by 5.3% higher in the 2Q16 relative to the 1Q16, from a loss of R$
56.3 million to a loss of R$ 59.3 million, due mainly to the factors described below.
Operating Revenue
Net Operating Revenue increased by 41.1% relative to the 1Q16, from R$ 94.3 million to R$ 133.5
million, due mainly to the factors described below.
In distribution:
Supply Revenues decreased by 5.47% relative to the 1Q16, from R$ 147.6 million to R$ 139.5 million,
due mainly to non-charging of tariff flags as of April.
CVA revenues increased by 989% relative to the 1Q16, from R$ 2.2 million negative to R$ 19.4 million,
due mainly to the accounting for the CVA in the period from August 2015 to May 2016.
Other Revenues decreased by 40.94% relative to the 1Q16, from R$ 7.4 million to R$ 4.4 million, due
mainly to the decrease in the value of the VNR revenue that is updated at the IPCA rate, which decreased
in the 2Q16.
Operating Expenses
Operating Expenses increased in the 2Q16 relative to the 1Q16 from R$ 139.2 million to R$ 145.4
million, due mainly to the factors described below.
Personnel, Materials and Services expenses increased by 1.3% relative to the 1Q16, from R$ 22.4 million
to R$ 22.7 million.
Personnel expenses decreased by 9.8% relative to the 1Q16, from R$ 11.2 million to R$ 10.1 million.
Materials Expenses increased by 15.95% relative to the 1Q16, from R$ 0.3 million to R$ 0.2 million, with
no significant variation.
Services Expenses increased by 13.13% relative to the 1Q16, from R$ 11,0 million to R$ 12.4 million,
due to mainly to on-call services and maintenance of energized lines.
Energy Purchased for Resale expenses decreased by 25.28% relative to the 1Q16, from R$ 70.3 million
to R$ 52.6 million, due to the fact that the company is overcontracted.
Fuel Expenses increased by 227.83% relative to the 1Q16, from R$ 7.3 million to R$ 24.1 million, due
mainly to the increase in the disallowance of acknowledgment for the compensation of the CCC.
60
Marketletter 2Q16
Operating Provisions decreased by 153.16% relative to the 1Q16, from R$ 9.8 million negative to a
reversal of R$ 5.2 million, due mainly to reversals of provisions for doubtful accounts (PCLD) as a result
of negotiations with public service clients.
Other Expenses increased by 146% relative to the 1Q16, from R$ 11.0 million to R$ 26.8 million, due
mainly to reclassification of regulatory penalties in the amount of R$ 9,9 million that were recorded as
Financial Expenses in the 1Q16, and to credit losses with customers amounted to R$ 4.2 million.
Financial Result
Net Financial Result changed from a negative amount of R$ 11.7 million in the 1Q16 to a negative
amount of R$ 47.4 million in the 2Q16, mainly due to the factors described below.
Debt Charges increased by 69.2%, from R$ 7.6 million to R$ 12.9 million, due mainly to the nonsettlement of contracts with Eletrobras Holding.
Moratorium increased by 84.5%, from R$ 4.0 million to R$ 7.5 million, due mainly to the increase in
trading interest with the Cruzeiro do Sul municipality and the state of Acre.
Net Monetary Variations increased by 598%, from R$ 5.6 negative to R$ 39.1 million negative, due
mainly to financial charges relative to the payment in installments of the Tax on the Circulation of Goods
and Transportation and Communication Services - ICMS and penalties issued by the local revenue office
(SEFAZ/AC).
61
Marketletter 2Q16
ED Alagoas
The company presented, in the 2Q16, a result 9.05% higher than in the 1Q16, from a loss of R$ 56.6
million to a loss of R$ 51.5 million, due mainly to the factors described below.
Operating Revenue
Net Operating Revenue decreased by 26.2% relative to the 1Q16, from R$ 407.3 million to R$ 300.4
million due mainly to the factors described below.
In distribution:
Supply Revenues decreased by 25.23% relative to the 1Q16, from R$ 555.6 million to R$ 415.4 million,
due mainly to the change in the tariff flag and the decreased energy consumption given the economic
scenario.
CVA revenues increased by 433.3% relative to the 1Q16, from R$ 7.1 million negative to R$ 37.7 million
negative, due mainly to the amortization of the CVA in the period and the period of 2015/2016 to be
approved at the next rate adjustment.
Other Revenues increased by 33.5% relative to the 1Q16, from R$ 40.7 million to R$ 54.3 million, due
mainly to reclassification and restatements.
Operating Expenses
Operating Expenses decreased relative to the 1Q16, from R$ R$ 424.3 million in the 1Q16 to R$ 312.7
million in the 2Q16, due mainly to the factors described below.
Personnel, Materials and Services expenses increased by 5% relative to the 1Q16, from R$ 55.1 million
to R$ 57.9 million.
Personnel expenses increased by 4.6% relative to the 1Q16, from R$ 36.8 million in the 1Q16 to R$ 35.1
million in the 2Q16.
Materials expenses increased by 73.31% relative to the 1Q16, from R$ 0.3 million to R$ 0.5 million, due
mainly to expenses with materials, cleaning and maintenance of buildings and facilities.
Services expenses increased by 23.9% relative to the 1Q16, from R$ 18.03 million to R$ 22.3 million.
Energy Purchased for Resale expenses decreased by 39.14% relative to the 1Q16, from R$ 268.2 million
to R$ 163.2 million, due mainly to the smaller volume of energy purchased.
62
Marketletter 2Q16
Operating Provisions decreased by 125.69% relative to the 1Q16, from R$ 5.3 million to R$ 1.3 million,
mainly due to transfer to the losses account with irrecoverable write-offs.
Other Expenses decreased by 8.44% relative to the 1Q16, from R$ 32.8 million to R$ 30.0 million, due
mainly to reversal of provision of Inefficiency for having a surplus recorded in December 2015.
Financial Result
Net Financial Result changed from a negative amount of R$ 39.6 million in the 1Q16 to a negative
amount of R$ 39.2 million in the 2Q16, with no significant variation between these quarters.
63
Marketletter 2Q16
ED Piauí
The company's result presented a variation by 37.1% relative to the result of the 1Q16, from a loss of R$
147.5 million in the 1Q16 to a loss of R$ 92.9 million in the 2Q16, due mainly to the factors described
below.
Operating Revenue
Net Operating Revenue increased by 1.5% relative to the 1Q16, from R$ 302.8 million to R$ 307.4
million, due mainly to the factors described below.
In distribution:
Supply Revenues decreased by 1.75% relative to the 1Q16, from R$ 418.4 million to R$ 411.1 million,
due mainly to the reduction of tariff flags.
CVA revenues decreased by 4.39% relative to the 1Q16, from R$ 11.4 million to R$ 10.9 million, due to
the verification of the CVA deltas as a result of restatement adjustments.
Operating Expenses
Operating Expenses decreased in the 2Q16 relative to the 1Q16, from R$ R$ 388.7 million to R$ 353.0
million, due mainly to the factors described below.
Personnel, Materials and Services expenses increased by 10.6% relative to the 1Q16, from R$ 68.3
million to R$ 75.5 million.
Personnel expenses increased by 6.59% relative to the 1Q16, from R$ 44.2 million to R$ 47.1, due
mostly to new hires as a consequence of insourcing.
Materials costs decreased by 2.59% relative to the 1Q16, from R$ 1.35 million to R$ 1.31 million, due
mainly to the reduction of expenses with materials for maintenance of the distribution network.
Services expenses increased by 19.32% relative to the 1Q16, from R$ 22.7 million to R$ 27.1 million,
due mainly to an increase in expenses with contracts for consumption measurement and invoicing and
delivery of bills.
Energy Purchased for Resale expenses increased by 2.88% relative to the 1Q16, from R$ 211.4 million to
R$ 217.4 million, due mainly to an increase in short-term energy caused by the elevation of involuntary
exposure.
Expenses with Charges on the Usage of the Electric Network decreased by 28.55% relative to the 1Q16,
from R$ 30.7 million to R$ 22.0 million, due mainly to a reduction in the system service charge.
64
Marketletter 2Q16
Operating Provisions decreased by 974.52% relative to the 1Q16, from a negative amount of R$ 12.9
million to a positive amount of R$ 112.8 million, due mainly to transfer of provisions from the Doubtful
Accounts (PCLD) to losses with irrecoverable write-offs. The utilities class stands out, especially the
AGESPISA.
Other Expenses increased by 300.84% relative to the 1Q16, from R$ 29.2 million to R$ 117.2 million,
due to the write-off of invoices for losses on credit receivables, which were previously classified as
doubtful accounts, as mentioned above.
Financial Result
Net Financial Result changed from a negative amount of R$ 61.6 million in the 1Q16 to a negative
amount of R$ 47.2 million in the 2Q16, due mostly to the factors described below.
Debt Charges decreased by 21.5% relative to the 1Q16, from R$ 54.4 million to R$ 42.7 million, due
mostly to the reversal of the charges on renegotiated contracts in the 2Q16 whose value was
incorporated into the balance due.
Moratorium increased by 11.33% relative to the 1Q16, from R$ 17.4 million to R$ 19.4 million, due
mainly to an upgrade of consumer credits by means of a campaign for regularization of debts in
installments.
Net Monetary Variations decreased by 32.38% relative to the 1Q16, from R$ 22.7 million negative to R$
15.3 million negative, due mainly to a major upgrade of taxes in the 1Q16. In the 2Q16 all accrued taxes
were set in installments.
The update of Regulatory Assets decreased by 83.65% relative to the 1Q16, from R$ 4.2 million to R$
0.7 million, due mainly to the adjustment in the calculation of amortization of CVA and Financial Items.
Other Financial Expenses increased by 53.48% relative to the 1Q16, from R$ 6.1 million to R$ 9.3
million, due mainly to default with suppliers.
65
Marketletter 2Q16
ED Rondônia
The company presented a result 319.26% lower than in the 1Q16, from a loss of R$ 25.0 million to a loss
of R$ 104.9 million, mainly due to the factors described below.
Operating Revenue
Net Operating Revenue decreased by 10.3 relative to the 1Q16, from R$ 407.1 million to R$ 448.8
million, due mainly to the factors described below.
Supply Revenues decreased by 4.4% relative to the 1Q16, from R$ 445 million to R$ 425.6 million,
showing no significant variation.
CVA Revenues increased by 4.3% relative to the 1Q16, from R$ 108.9 million to R$ 113.7 million,
showing no significant variation.
Construction Revenues increased by 96.0%, from R$ 35.9 million to R$ 70.3 million, but with no effect on
the result since it has equivalent value at the cost of construction.
Operating Expenses
Operating Expenses decreased in the 2Q16 relative to the 1Q16, from R$ R$ 364.9 million to R$ 475.2
million, due mainly to the factors described below.
Personnel, Materials and Services expenses decreased by 5.7% relative to the 1Q16, from R$ 63.8 million
to R$ 60.1 million.
Personnel expenses decreased by 2.0% relative to the 1Q16, from R$ 30.4 million to R$ 29.8 million,
showing no significant variation.
Services Revenues decreased by 9.0% relative to the 1Q16, from R$ 31.9 million to R$ 29 million,
showing no significant variation.
Energy Purchased for Resale expenses increased by 52.6% relative to the 1Q16, from R$ 208.1 million to
R$ 317.5 million, due mainly to the reduction of expense recoveries on the CCC, considering that the cost
of the MWh in the Bilateral contract with the Termonorte II was below average ACR, leading to a
verification of negative repayment.
Other Expenses decreased by 88% relative to the 1Q16, from R$ 33.3 million to R$ 4.0 million, due
mainly to the acknowledgement of the New Replacement Value revenue based on base pay update
approved by ANEEL in the last rate adjustment regulated by Law 12,783/2013.
66
Marketletter 2Q16
Financial Result
Net Financial Result changed from a negative amount of R$ 67.2 million in the 1Q16 to a negative
amount of R$ 78.5 million in the 2Q16, mainly due to the factors described below.
Revenues from Financial Investments increased by 100.1% relative to the 1Q16, from R$ 1.1 million to
R$ 2.2 million.
Net Monetary Variations decreased by 67.3% relative to the 1Q16, from a negative amount of R$ 11.3
million to a negative amount of R$ 3.7 million, due mainly to the reduction in negative monetary
adjustments and the increase in positive monetary adjustments corresponding to installments of debt
negotiations with customers.
The Update of Regulatory Liabilities (CVA) decreased by 84,8% relative to the 1Q16, from a negative
amount of R$2.6 million to a negative amount of R$ 0.4 million, due to the monthly amortizations
performed in the quarter.
Other Financial Revenues presented a result 19.8% lower relative to the 1Q16, from R$ 111.1 million to
R$ 89.1 million, due to mainly to the calculation of PIS and COFINS on the updates of rights
reimbursements to cover the Debt Acknowledgement Agreement with Eletronorte.
67
Marketletter 2Q16
ED Roraima
The company presented, in the 2Q16, a result lower than in the 1Q16, from a loss of R$ 66.1 million in
the 1Q16 to a loss of R$ 82.9 million in the 2Q16, due mainly to the factors described below.
Operating Revenue
Net Operating Revenue increased by 1.3% relative to the 1Q16, from R$ 65.5 million to R$ 66.3 million,
due mainly to the factors described below.
In generation:
Supply revenues increased by 20.4% relative to the 1Q16, from R$ 6.9 million to R$ 8.3 million.
In distribution:
Supply Revenues decreased by 6.81% relative to the 1Q16, from R$ 72.2 million to R$ 67.3 million.
The Regulatory Assets and Liabilities account (Installment ''A'' - CVA) did not have variations between the
quarters.
Other Operating Revenues
Other Operating Revenues decreased by 4.3% relative to the 1Q16, from R$ 2.2 million to R$ 2.1 million,
showing no significant variation.
Operating Expenses
Operating Expenses increased relative to the 1Q16, from R$ R$ 111.4 million to R$ 141.2 million, due
mainly to the factors described below.
Personnel, Materials and Services expenses increased by 8% relative the 1Q16, from R$ 20.8 million to
R$ 22.4 million.
Personnel expenses increased by 7.9% relative to the 1Q16, from R$ 17.3 million to R$ 18.6 million, due
to mostly to insourcing.
Materials expenses decreased by 122.1% relative to the 1Q16, from R$ 0.26 million to a reversal of R$
0.06 million, due to restatement.
Services Expenses increased by 18.4% relative to the 1Q16, from R$ 3.3 million to R$ 3.9 million,
especially expenses with legal publications services.
Expenses with Energy Purchased for Resale decreased by 5.9% relative to the 1Q16, from R$ 47.8 million
to R$ 45 million, due to the small volume of energy imported from Venezuela through Eletronorte.
68
Marketletter 2Q16
Fuel Expenses increased by 116% relative to the 1Q16, from R$ 21.6 million to R$ 46.7 million, due
mainly to the need for additional power generation for sale, due to lower energy imports from Venezuela,
as mentioned above.
Operating Provisions increased by 10.6% relative to the 1Q16, from a loss of R$ 14.7 million to R$ 16.3
million.
Financial Result
Net Financial Result improved by 60.3%, from a negative amount of R$ 20.2 million in the 1Q16 to a
negative amount of R$ 8 million in the 2Q16.
Revenues from Financial Investments increased by 258% relative to the 1Q16, from R$ 0.4 million
negative to R$ 0.6 million positive due to restatement.
Debt Charges increased by 101.7% relative to the 1Q16, from R$ 1.5 million to R$ 3.1 million, due to
mainly to financing debts with Eletrobras.
Moratorium decreased by 72% relative to the 1Q16, from R$ 18.4 million to R$ 5.2 million.
Other Financial Revenues decreased by 25.4% relative to the 1Q16, from R$ 4.2 million to R$ 3.1 million,
due mainly to restatements.
69
Marketletter 2Q16
V. Market Data of Eletrobras Companies
V.1 Installed Capacity – MW
Empresas
Company
Integral
Responsability (a)
Integral
Responsability under
O&M Regime (b)
9,281
2,214
4,212
1,990
476
670
7,000
1,299
78
8,399
4,617
-
202
121
1,251
2,161
1,203
-
403
-
189
1
348
254
99
-264
202
9,480
11,864
11,393
1,990
1,679
670
7,000
1,299
440
-
-
-
-
440
403
626
46,016
Eletrobras Holding(1)
Eletronorte
Chesf
Furnas
Eletronuclear
Eletrosul
CGTEE
Itaipu Binacional
Amazonas GT
Distribution
Companies
Total
SPE under
O&M Regime
(d)
SPE (c)
27,582
13,094
4,937
(1) The Artilleros Wind farm was not considered, because it is na enterprise located abroad.
Physical
Aggregation
2016
Total
(a+b+c+d)
V.2 Transmission Lines - Km
Company
Eletronorte
Chesf
Furnas
Eletrosul
Amazonas GT
Distribution
Companies
Total
Integral
Responsability (a)
Integral
Responsability
under O&M Regime
(b)
Physical
Aggregation 2016
SPE (c)
Total (a+b+c)
754
1,281
1,328
1,383
439
10,084
18,946
18,759
9,426
-
2,072
1,668
1,546
1,088
-
62
500
358
90
-
12,910
21,894
21,632
11,897
439
374
-
-
52
374
5,558
57,215
6,373
1,062
69,146
70
Marketletter 2Q16
VI. Generation Data – Asset under Integral Responsability
VI.1 Installed Capacity - MW
VI.1.2 Generation Assets and Generated Energy
VI.1.2.1 Generation Assets and Generated Energy – Enterprises under Integral Responsability
Company
Eletronorte
Chesf
Furnas
Eletronuclear
Eletrosul
CGTEE
Enterprise
Location
(State)
Complexo de Tucuruí
HPU Samuel
HPU Curuá-Una
TPU Rio Madeira(1)
TPU Santana
TPU Rio Branco I(2)
TPU Rio Branco II(2)
TPU Rio Acre
TPU – Santarém
PA
RO
PA
RO
AP
AC
AC
AC
PA
TPU Senador Arnon
Afonso Farias de Mello(3)
RR
Curemas
Sobradinho
Camaçari(5)
Mascarenhas de Moraes
Itumbiara
Simplício(8)
Batalha
Serra da Mesa
(48.46%)(6)
Manso (70%)(6)
Santa Cruz(7)
Roberto Silveira
(Campos)
Angra I
Angra II
HPU Mauá(9)
HPU Passo São João
HPU São Domingos
SHU Barra do Rio
Chapéu
SHU João Borges
Wind Farm Cerro Chato I
Wind Farm Cerro Chato
II
Wind Farm Cerro Chato
III
WPP Coxilha Seca
WPP Capão do Inglês
WPP Galpões
Megawatt Solar
P. Médici (Candiota)
Candiota III – Fase C
S. Jerônimo (Candiota)
Nutepa (Candiota)
Beginning
of
Operation
End of
Operation
Intalled
Capacity
(MW)
Energy
Assured
(Average
MW)
Generated Energy - MWh
1Q16
2Q16
Jul/24
Sep/29
Jul/28
Sep/18
May/19
Jul/20
Jul/20
Abr/25
(4)
8,535.00
216.75
30.30
119.35
177.74
18.65
32.75
45.49
18.75
4,140.00
92.70
24.00
-
8,805,785.48
91,832.13
30,945.77
4,297.35
751.03
7,855,727.30
177,220.68
59,328.28
130.09
Aug/24
85.99
-
-
-
PB
BA
BA
MG
GO/MG
RJ
MG
Nov/84
Jul/89
Apr/77
Apr/68
Mar/93
Feb/98
Apr/81
Dec/94
Jun/14
1st Unit
(mach. 2)
dec/90;
2nd Unit
(mach. 1)
jun/91;
3rd Unit
(mach. 3)
dec/93
Jun/57
Apr/79
Feb/79
Apr/73
Feb/80
Jun/13
May/14
Nov/24
Feb/52
Aug/27
Oct/23
Feb/20
Aug/41
Aug/41
3.52
1,050.30
346.80
476.00
2,082.00
305.70
52.50
1.00
531.00
45.80
295.00
1,015.00
175.40
48.80
0.01
370,501.43
11,924.42
139,809.28
586,925.51
277,837.41
23,342.12
0.00
389,763.98
0.00
320,224.31
1,249,001.46
170,049.07
34,123.36
GO
Apr/98
Nov/39
1,275.00
671.00
722,992.60
831,069.41
MT
RJ
Oct/00
Mar/67
Feb/35
Jul/15
212.00
500.00
92.00
401.20
217,603.71
704,804.13
142,129.40
453,909.47
RJ
Apr/77
Jul/27
30.00
21.00
16,340.84
129.76
RJ
RJ
PR
RS
MS
Jan/85
Sep/00
Nov/12
Mar/12
Jun/13
Dec/24
Aug/40
Jul/42
Aug/41
Dec/37
640.00
1,350.00
177.93
77.00
48.00
509.80
1,204.70
96.90
41.10
36.40
1,405,740.06
2,952,960.82
380,794.00
125,326.00
93,120.30
1,205,129.21
2,968,983.88
301,610.35
106,211.77
57,809.45
SC
Feb/13
May/34
15.15
8.61
24,285.10
18,691.56
SC
RS
Jul/13
Jan/12
Dec/35
Aug/45
19.00
30.00
10.14
11.33
24,807.90
19,829.07
18,618.04
23,343.54
RS
Aug/11
Aug/45
30.00
11.33
20,163.80
24,032.06
RS
Jun/11
Aug/45
30.00
11.33
20,132.42
23,783.89
RS
RS
RS
SC
RS
RS
RS
RS
Dec/15
Dec/15
Dec/15
Sep/14
Jan/74
Jan/11
Apr/53
Feb/68
May/49
May/49
May/49
Jul/15
Jul/41
Jul/15
Jul/15
30.00
10.00
8.00
0.93
320.00
350.00
0.00
0.00
11.69
3.90
3.12
NA
39.86
221.06
0.00
0.00
22,393.40
7,279.90
5,822.70
38.00
183,512.40
470,856.22
-
28,064.74
9,401.06
7,861.61
87.97
247,771.61
336,289.40
0.00
0.00
14,000.00
8,577.00
25,631,062.00
26,006,172.0
0
249.75
282.48
502.16
132.30
186.00
179.80
115,560.06
269,990.11
234,991.64
106,664.80
236,702.70
164,768.20
Itaipu
Binacional
Itaipu Binacional
PR
Mar/85
Amazonas
GT
HPU Balbina
TPU Aparecida
TPU Mauá
AM
AM
AM
Jan/89
Feb/84
Apr/73
Mar/27
Jul/20
Jul/20
71
Marketletter 2Q16
TPU São José
TPU Flores
TPU Iranduba
AM
AM
AM
Feb/08
Feb/08
Nov/10
Aug/16
Aug/16
Aug/16
73.40
124.70
66.6
50.00
80.00
25
50,127.36
31,512.81
38,514.74
43,214.03
68,431.19
54,413.68
(1) Order No. 223 of 01.28.2014 ANEEL declares as unserviceable assets of TPU Rio Madeira.
(2) Order No. 136 of 01.21.2014 ANEEL, recommends the MME extinction of the public service commitment of TPUs Rio Branco I and Rio Branco II.
(3) Ceded in lending for Boa Vista Energy from February 10, 2010.
(4) MME Ordinance No. 454 of 12/23/2013, provides that the deadline will be until it comes into operation a structural solution to supply the loads of Tramo
West, constant in the study EPE-DEE-AED-RE-005/2013 Company Energy-EPE Research.
(5) The listed capacity is 5 machines totaling 346.803 MW. The plant is bi-fuel (oil and gas). We were asked to cancel the award of the thermal plant Camaçari,
whose process is in the MME for deliberation. Because of Aneel DSP No. 4792 Order of December 15, 2014, as well as ANEEL No. 247 of February 3, 2015, the
plant is operating only with the generating unit No. 3 with 69.12 MW of power . The installed capacity will be adjusted upon cancellation definitively by Aneel.
(6) HPP's shared, but FURNAS adiquire the partner fraction through power purchase agreements - considered GF and Total gerção each HPP.
(7) The power of 500 MW excludes GU 3:04 whose commercial operation is temporarily suspended by Aneel, as Order No 3263 of 19 October 2012. It includes,
however, the power of 150 MW not available due the delay in the plant expansion works at the end of which the GU 11:21 operate in combined cycle with GU
1 and 2. the physical guarantee (assured energy) of 401.2 MW is on the installed capacity of 500 MW.
(8) 175.40 MW average correspond to physical guarantee Simplicio only. The Simplicio Tapir complex will have 191.30 MW of assured power when Anta is in
commercial operation.
(9) The amounts reported refer to the Company's stake in the venture (Consortium Mauá 49% Eletrosul).
VI.1.2.2 Generation Assets and Generated Energy – Enterprises under Integral Responsibility – O&M
Company
Eletronorte
Chesf
Furnas
HPU Coaracy Nunes
Funil
Pedra
Araras
Paulo Afonso
Complex
Luiz Gonzaga
(Itaparica)
Boa Esperança
(Castelo Branco)
Xingó
Furnas
Luis Carlos Barreto
(Estreito)
Porto Colômbia
Marimbondo
Funil
Corumbá I
-
Eletronuclear
Eletrosul
CGTEE
Itaipu
Binacional
Beginning
End of
of
Operation
Operation
Location
(State)
Enterprise
Energy
Assured
(Average
MW)
Intalled
Capacity
(MW)
Generated Energy (MWh)
1Q16
2Q16
AP
BA
BA
CE
Oct/75
Mar/62
Apr/78
Feb/67
Dec-42
Dec/42
Dec/42
Jul/15
78.0
30.00
20.01
4.00
62.6
10.91
3.74
0.03
137,835.11
2,604.23
13,366.99
-
154,362.50
3,481.18
-
BA
Jan/55
Dec/42
4,279.60
2,225.00
1,843,824.52
1,749,017.54
PE
Feb/88
Dec/42
1,479.60
959
813,768.06
770,196.75
PI
Jan/70
Dec/42
237.30
143
271,241.36
218,826.27
SE
MG
Apr/94
Mar/63
Dec/42
Dec/42
3,162.00
1,216.00
2,139.00
598
2,129,035.28
209,317.51
1,999,317.64
480,994.99
SP/MG
Jan/69
Dec/42
1,050.00
495
317,249.37
522,227.48
MG/SP
SP/MG
RJ
GO
-
Mar/73
Apr/75
Apr/69
Apr/97
-
Dec/42
Dec/42
Dec/42
Dec/42
-
320.00
1,440.00
216.00
375.00
-
185
363,708.13
726 1,856,133.86
121
257,836.21
209
389,752.01
-
305,881.68
1,336,137.81
137,780.91
336,984.42
-
-
-
-
-
-
-
-
-
-
-
-
-
-
-
-
-
-
-
-
-
-
-
VI.1.3.Energy Sold
VI.1.3.1 Energy Sold by enterprises not renewed by 12,783/13 Law
1Q16
R$ Million
Company
Buyer
Eletronorte
Eletrobras System
Others
Chesf
Furnas
Eletronuclear
Eletrosul
CGTEE
Itaipu Binacional
Eletrobras System
Others
Eletrobras
Others
Eletrobras
Others
Eletrobras
Others
Eletrobras
Others
Eletrobras
System
System
System
System
System
131.73
803.38
2Q16
MWh
R$ Million
653,014.32
5,328,219.86
129.71
767.60
MWh
639,086.45
5,139,327.88
0.00
0.00
0.00
0.00
224.80
85.32
802.39
32.20
683.32
99.62
139.12
846.72
1,828,519
378,756
3,729,292
154,453.19
3,277,694
529,343
712,679.18
22,388,370.00
225.10
90.21
736.44
32.20
683.32
97.46
128.23
882.25
1,615,944.28
397,127.56
3,463,328.85
154,523.94
3,279,194.99
508,265.52
702,714.96
23,310,105.00
72
Marketletter 2Q16
Others
Eletrobras System
Others
Amazonas GT
102.78
114.70
0.00
3,060,479
733,046.90
-
76.036425
153.61
-
2,508,398
871,901.91
-
VI.1.3.2 Energy Sold by enterprises renewed by 12,783/13 Law – O&M
Company
Eletronorte
Chesf
Furnas
Eletronuclear
Eletrosul
CGTEE
Itaipu Binacional
Amazonas GT
1Q16
Buyer
Eletrobras
Others
Eletrobras
Others
Eletrobras
Others
Eletrobras
2Q16
R$ Million
System
System
System
MWh
0.26
3.20
26.60
293.60
15.66
183.74
10,187
126,937
919,624
10,791,102
402,650
4,724,802
-
-
System
Others
Eletrobras System
Others
Eletrobras System
Others
Eletrobras System
Others
Eletrobras System
Others
R$ Million
MWh
0.28
3.54
26.60
293.30
15.98
187.48
11,442.76
142,236.79
919,203.33
10,786,163.09
402,466.16
4,722,639.28
VI.1.3.3 CCEE Settlement (Spot and MRE)
Net
Company
Eletronorte
Chesf
Furnas
Eletronuclear
Eletrosul
CGTEE
Itaipu Binacional
Amazonas GT
R$ Million
1Q16
MWh
1Q16
R$ Million
2Q16
MWh
2Q16
95.01
-22.42
-163.53
-0.69
7.08
n/a
52.49
2,550,023.85
-64,103.47
239,685.48
123,435.32
n/a
40,446.49
78.51
13.51
60.86
-0.87
8.87
n/a
138.92
1,718,866.90
-2,981.80
98,279.70
68,705.74
n/a
-12,071.05
73
Marketletter 2Q16
VI.1.4 Energy purchased for Resale*
Company
Buyer
1Q16
2Q16
R$ Million
MWh
R$ Million
MWh
Eletrobras System
Others
44.82
275,600.00
38.92
263,802.00
Eletrobras System
Chesf
Others
70.48
444,857.26
80.68
467,261.66
Eletrobras System
Furnas
Others
136.46
832,254.23
151.72
831,876.82
Eletrobras System
n/a
n/a
n/a
n/a
Eletronuclear
Others
n/a
n/a
n/a
n/a
Eletrobras System
71.48
356,819.55
70.13
356,656.25
Eletrosul
Others
Eletrobras System
51.48
294,975.00
47.25
294,840.00
CGTEE
Others
Eletrobras System
n/a
n/a
n/a
n/a
Itaipu
Binacional
Others
n/a
n/a
n/a
n/a
Eletrobras System
Amazonas GT
Others
*Energy purchased for resale reported in the table above refers exclusively to energy purchased by each Eletrobras Company without
considering the energy purchased by SPEs that are subsidiaries of these companies. The analysis of IV.3.2 item considers the energy
purchased for resale consolidated, due to this reason ther is difference between values.
Eletronorte
VI.1.5 Average Rate
VI.1.5.1 Enterprises not renewed by 12,783/13 Law
Eletrobras Companies
Eletronorte
Chesf
Furnas
Eletronuclear
Eletrosul
CGTEE
Itaipu Binacional (1)
Amazonas GT
1Q16
2Q16
156.34
123.49
216.09
208.48
188.19
194.75
22.60
169.25
154.18
139.33
214.13
208.38
191.76
182.47
22.60
169.25
(1) Amounts in U$/Kw.
VI.1.5.2 Enterprises renewed by 12,783/13 Law – O&M
Eletrobras Companies
Eletronorte
Chesf
Furnas
Eletronuclear
Eletrosul
CGTEE
Itaipu
Amazonas GT
1Q16
2Q16
25.17
28.00
38.89
n/a
n/a
n/a
n/a
n/a
24.89
27.33
39.70
n/a
n/a
n/a
n/a
n/a
74
Marketletter 2Q16
VI.1.6 Fuel used by Electric Energy Production*
Eletrobras
Companies
Eletronorte
Chesf
Furnas
Eletronuclear
Eletrosul
CGTEE
Itaipu
Binacional
Amazonas
GT
Type
Special
Diesel Oil
Diesel Oil
Gas
Special
Diesel Oil
Fuel Oil B1
Diesel Oil
Gas
Uranium
n/a
Coal
Fuel Oil
Diesel Oil
Unit
1Q16
2Q16
Amount
R$ Million
Amount
R$ Million
Litre
1,107,000
3.7
-
-
Litre
m3
-
-
-
-
4,141,057
7.80
-
-
Litre
-
-
-
-
Ton
Litre
m3
kg
n/a
Ton
kg
Litre
-
-
-
-
-
-
-
-
354,282,168
141.62
164,373,673
103.52
103,561
96.90
102,727
96.12
n/a
n/a
n/a
n/a
746,831
34.46
663,970
30.62
3,185,880
5.63
5,436,160
9.24
16,600
0.04
-
-
n/a
n/a
n/a
n/a
35,905,308
129.40
3,368,524
-5.50
n/a
n/a
Diesel Oil
Litre
*Net of taxes
75
Marketletter 2Q16
VII. Transmission – Assets under Integral Responsibility
VII.1 – Transmission Lines Extension
VII.1.1 Transmission Lines Extension – Enterprises not renewed by 12,783/13 Law – O&M - Km
Eletrobras
Companies
Eletronorte
Chesf
Furnas
Eletrosul
Amazonas GT
Amazonas
Energia
Total
765 KV
600 KV
525 KV
500 KV
440 KV
345 KV
230 KV
138 KV
<138 KV
Total
-
-
1,047
-
844
-
-
161
-
754
1,281
295
439
28
-
323
12
-
754
1,281
1,328
1,383
439
-
-
-
-
-
-
-
-
374
374
-
-
1,047
844
-
161
2,769
28
709
5,558
VII.1.2 Transmission Lines Extension – Enterprises renewed by 12,783/13 Law - Km
Eletrobras
Companies
Eletronorte
Chesf
Furnas
Eletrosul
Amazonas GT
Amazonas
Energia
Total
765 KV
600 KV
525 KV
500 KV
440 KV
345 KV
230 KV
138 KV <138 KV
Total
2,698
-
1,612
-
2,722
-
3,243
5,372
4,005
-
-
6,145
-
5,679
12,800
1,929
4,800
-
959
463
2,205
1,848
-
203
311
165
56
-
10,084
18,946
18,759
9,426
-
-
-
-
-
-
-
-
-
-
-
2,698
1,612
2,722
12,620
-
6,145
25,208
5,475
735
57,215
VII.2 Transmission Losses - %
Eletrobras Companies
Eletronorte
Chesf
Furnas
Eletrosul
1Q16
2Q16
1.28%
2.58%
2.14%
1.55%
1.28%
3.21%
2.29%
1.34%
VII.3 Substation
VII.3.1 Substation - Eneterprises renewed in terms of 12,783/13 Law
Eletrobras
Companies
SS
Altamira
Location
(State)
Beginning of
Operation
End of
Concession
120.3
PA
Jun/98
Dec/42
Cametá
23.6
PA
Aug/98
Dec/42
Carajás
0.3
PA
Nov/06
Dec/42
454.0
1,063.8
300.6
500.2
PA
PA
PA
PA
Dec/81
Oct/81
Dec/98
Sep/95
Dec/42
Dec/42
Dec/42
Dec/42
969.0
PA
Oct/81
Dec/42
60.3
58.4
602.0
3,817.4
401.7
2,829.0
500.6
PA
PA
PA
PA
PA
MA
MA
MA
Dec/98
Jun/99
Dec/81
Dec/81
Jul/13
Dec/82
Dec/82
Jun/98
Dec/42
Dec/42
Dec/42
Dec/42
Dec/42
Dec/42
Dec/42
Dec/42
Guamá
Marabá
Rurópolis
Santa Maria
Eletronorte
Transformation Capacity
(MVA)
Tucuruí
Transamazônica
Tucuruí-Vila
Utinga
Vila do Conde
Integradora
São Luis I
São Luis II
Miranda II
76
Marketletter 2Q16
Chesf
Peritoró
Presidente Dutra
Coelho Neto
Imperatriz
Porto Franco
Colinas
Miracema
Barra do peixe
Couto Magalhães
Coxipó
Jauru
Nova Mutum
Rondonopolis
Sinop
Sorriso
Epitaciolândia
SSna Madureira
Rio Branco
Ariquemes
Ji-Paraná
Porto Velho
Abunã
Samuel
Pimenta Bueno
Vilhena
Jaru
Coaracy Nunes
Portuária
Amapá
Tartarugalzinho
Calçoene
Santana
Santa Rita
Equatorial
Macapá II
Boa Vista
SS Lifting Apolonio Sales
Plant
SS Lifting Luiz Gonzaga
Plant
SS Lifting Paulo Afonso I
Plant
SS Lifting Paulo Afonso II
Plant
SS Lifting Paulo Afonso
III Plant
SS Lifting Paulo Afonso
IV Plant
SS Lifting Piloto Plant
SS Lifting Xingó Plant
SS Lifting Araras Plant
SS Lifting B. Esperança
Plant
SS Lifting Funil Plant
SS Lifting Pedra Plant
SS Pau Ferro
SS Paraiso
SS Bom Nome
SS Irecê
SS Milagres
SS Mirueira
SS Moxotó
SS Mulungú
SS Pilões II
SS Coteminas
SS Brotas de Macaubas
SS Tacaratu(1)
SS Quixerê(1)
SS Campo Formoso
300.1
721.0
130.0
1,842.2
399.0
1.5
362.5
150.6
15.1
571.2
600.5
60.6
400.9
356.0
60.6
22.1
18.8
423.0
120.3
380.6
525.6
110.6
0.3
110.6
120.6
30.2
40.1
20.0
10.1
40.2
10.1
120.5
80.0
80.0
53.4
301.7
77
MA
MA
MA
MA
MA
TO
TO
MT
MT
MT
MT
MT
MT
MT
MT
AC
AC
AC
RO
RO
RO
RO
RO
RO
RO
RO
AP
AP
AP
AP
AP
AP
AP
AP
AP
RR
Dec/82
Dec/82
Jan/00
Dec/82
Feb/94
Mar/99
Mar/99
Nov/93
Oct/81
Jul/87
Jun/03
Sep/96
Jul/83
Sep/96
Sep/96
Mar/08
Oct/08
Nov/12
Aug/94
Sep/94
Jul/89
May/02
Jul/89
Jun/08
Oct/08
Sep/97
Nov/75
Apr/96
Dec/01
Jun/00
May/02
Oct/75
Dec/07
Aug/00
Nov/96
Jul/01
Dec/42
Dec/42
Dec/42
Dec/42
Dec/42
Dec/42
Dec/42
Dec/42
Dec/42
Dec/42
Dec/42
Dec/42
Dec/42
Dec/42
Dec/42
Dec/42
Dec/42
Dec/42
Dec/42
Dec/42
Dec/42
Dec/42
Dec/42
Dec/42
Dec/42
Dec/42
Dec/42
Dec/42
Dec/42
Dec/42
Dec/42
Dec/42
Dec/42
Dec/42
Dec/42
Dec/42
480.0
AL
Feb-77
Dec-42
1,665.0
PE
May-88
Dec-42
202.5
BA
Jan-55
Dec-42
495.0
BA
Jan-62
Dec-42
960.0
BA
Jan-71
Dec-42
2,700.0
BA
Nov-79
Dec-42
3.0
3,330.0
5.0
BA
SE
CE
Jan-53
Nov-94
Feb-60
Dec-42
Dec-42
Dec-42
280.0
PI
Mar-70
Dec-42
43.2
27.0
301.0
200.0
388.0
229.0
2,120.0
401.0
20.0
10.0
-
BA
BA
PE
RN
PE
BA
CE
PE
BA
BA
PB
PB
BA
PE
CE
BA
Jan-59
Nov-78
Aug-02
Feb-04
Oct-63
Sep-81
Jan-64
Aug-78
Jan-72
May-75
Oct-12
Dec-09
Jul-12
Dec-14
Nov-14
Dec-15
Dec-42
Dec-42
Dec-42
Dec-42
Dec-42
Dec-42
Dec-42
Dec-42
Dec-42
Dec-42
Dec-42
Dec-42
Dec-42
Dec-42
Dec-42
Dec-42
Marketletter 2Q16
SS
SS
SS
SS
SS
SS
SS
SS
SS
SS
SS
SS
SS
SS
SS
SS
SS
SS
SS
SS
SS
SS
SS
SS
SS
SS
SS
SS
SS
SS
SS
SS
SS
SS
SS
SS
SS
SS
SS
SS
SS
SS
SS
Kv
SS
Kv
SS
SS
SS
SS
SS
SS
SS
SS
SS
SS
SS
SS
SS
SS
SS
SS
SS
SS
SS
SS
SS
SS
SS
Jaguarari
Sapeaçu
Sobradinho
Sobral II
Tacaimbó
Cícero Dantas
Açu II
Angelim
Angelim II
Bongi
Campina Grande II
Itapebi
Funil
Senhor Do Bonfim II
Eunápolis
Picos
Modelo Reduzido
Mossoró II
Barreiras
Sto. Antonio de Jesus
Icó
Mussuré II
Paulo Afonso
Penedo
Cauípe
Pici II
Piripiri
Pituaçu
Santa Cruz II
Banabuiú
Currais Novos II
Santana dos Matos II
Coremas
Fortaleza
Joairam
Juazeiro da Bahia II
Matatu
Natal II
Itabaianinha
Pirapama II
Russas II
Elizeu Martins
Boa Esperança 230
Boa Esperança 500
Xingó 500 Kv
Paulo Afonso IV
Recife II
S. João do Piaui
Zebu
Abaixadora
Bom Jesus da Lapa
Gov. Mangabeira
Quixadá
Jacaracanga
Ribeirão
Rio Largo II
Messias
Camaçari II
Catu
Cotegipe
Teresina
Fortaleza II
Goianinha
Teresina II
Delmiro Gouveia
Maceió
Itabaiana
78
900.0
400.0
301.0
101.0
378.0
310.0
530.0
410.0
550.0
433.3
400.0
173.0
12.5
400.0
401.0
301.0
200.0
401.0
302.0
201.0
400.0
330.0
402.0
100.0
121.0
92.0
50.0
300.0
405.0
451.0
402.0
380.0
401.0
173.0
400.0
300.0
101.0
BA
BA
BA
CE
PE
BA
RN
PE
PE
PE
PB
BA
BA
BA
BA
PI
BA
RN
BA
BA
CE
PB
AL
AL
CE
CE
PI
BA
RN
CE
RN
RN
PB
CE
PE
BA
BA
RN
SE
PE
CE
PI
Jan-80
May-03
Oct-79
Nov-73
Jun-85
May-56
Nov-89
Jan-56
Jan-80
May-56
May-64
Jan-03
Jan-56
May-81
Sep-98
Jul-92
Jan-67
Jan-77
Jun-96
Mar-97
May-97
Mar-79
Mar-74
May-97
Mar-01
May-05
Aug-73
Mar-83
Mar-63
Jan-64
Nov-75
Nov-75
Dec-90
Jan-64
Jul-06
Apr-81
Jan-65
Jan-79
Feb-96
Feb-72
Nov-82
Jan-06
Dec-42
Dec-42
Dec-42
Dec-42
Dec-42
Dec-42
Dec-42
Dec-42
Dec-42
Dec-42
Dec-42
Dec-42
Dec-42
Dec-42
Dec-42
Dec-42
Dec-42
Dec-42
Dec-42
Dec-42
Dec-42
Dec-42
Dec-42
Dec-42
Dec-42
Dec-42
Dec-42
Dec-42
Dec-42
Dec-42
Dec-42
Dec-42
Dec-42
Dec-42
Dec-42
Dec-42
Dec-42
Dec-42
Dec-42
Dec-42
Dec-42
Dec-42
127.0
PI
Mar-70
Dec-42
300.0
PI
Nov-80
Dec-42
1,200.0
2,410.0
418.0
38.0
110.0
162.0
200.0
301.0
300.0
301.0
1,201.0
2,605.0
300.0
302.0
590.0
1,800.0
300.0
900.0
401.0
400.0
223.0
SE
AL
PE
PI
AL
BA
BA
BA
CE
BA
PE
AL
AL
BA
BA
BA
PI
CE
PE
PI
CE
AL
SE
Nov-94
Jan-79
Jan-79
Nov-80
Nov-76
Oct-67
Sep-81
Mar-60
Jul-03
Jan-82
Oct-94
Dec-62
Nov-94
Jan-79
May-56
Jan-56
Apr-70
May-00
Jan-61
May-00
Jun-89
Sep-02
May-57
Dec-42
Dec-42
Dec-42
Dec-42
Dec-42
Dec-42
Dec-42
Dec-42
Dec-42
Dec-42
Dec-42
Dec-42
Dec-42
Dec-42
Dec-42
Dec-42
Dec-42
Dec-42
Dec-42
Dec-42
Dec-42
Dec-42
Dec-42
Marketletter 2Q16
Furnas(2)
Eletrosul
SS Itaparica
SS Jardim
SS Sobral III
SS Xingó 69 Kv
SS Olindina
SS Luiz Gonzaga 500kv
SS Floresta II(1)
Adrianópolis
Angra
Araraquara
Bandeirantes
Barro Alto
Brasília Geral
Brasília Sul
Cachoeira Paulista
Campinas
Campos
Foz do Iguaçu
Grajaú
Guarulhos
Gurupi
Ibiúna
Imbariê
Iriri
Itabera
Itutinga
Ivaiporã
Jacarepaguá
Macaé
Mogi das Cruzes
Niquelândia
Pirineus
Poços de Caldas
Resende
Rio Verde
Rocha Leão
Samambaia
São José
Tijuco Preto
Viana
Vitória
Corumbá
Funil
Furnas
Luiz C. Barreto
Marimbondo
Porto Colômbia
Alegrete
Anastácio
Areia
Assis(3)
Atlântida 2
Biguaçu
Blumenau
Campos Novos
Canoinhas
Caxias
Caxias 5(3)
Charqueadas
Curitiba
Desterro
Dourados
Farroupilha
Florianópolis
Gravataí
Gravataí 3
Ilhota
Itajaí
10.0
1,601.0
1,200.0
12.5
40.0
3,290.0
974.6
1,433.3
183.0
300.0
2,094.2
583.3
1,970.0
1,283.3
15,968.0
2,800.0
12,050.4
10,956.0
1,350.0
1,166.7
1,846.7
333.3
4,250.0
2,600.0
17,014.7
750.0
969.2
556.0
300.0
1,399.2
1,333.3
2,393.3
425.0
83.0
150.0
672.0
336.0
249.0
300.0
1,962.0
2,466.0
375.0
2,016.0
215.0
88.0
1,344.0
150.0
300.0
88.0
75.0
2,016.0
165.0
100.0
450.0
79
PE
SE
CE
SE
BA
PE
PE
RJ
RJ
SP
GO
GO
DF
DF
SP
SP
RJ
PR
RJ
SP
TO
SP
RJ
RJ
SP
MG
PR
RJ
RJ
SP
GO
GO
MG
RJ
GO
RJ
DF
RJ
SP
ES
ES
GO
RJ
MG
SP
MG
MG
RS
MS
PR
SP
RS
SC
SC
SC
SC
RS
RS
RS
PR
SC
MS
RS
SC
RS
RS
SC
SC
Jan-83
Aug-79
Apr-00
Jan-87
Apr-80
May-88
Oct-14
Nov-70
Apr-71
Apr-76
Oct-72
Mar-82
Feb-60
Mar-73
Oct-76
Sep-72
Feb-73
Dec-82
Dec-79
Sep-63
Mar-99
Apr-84
Oct-68
Oct-09
Sep-82
Apr-67
Oct-82
Dec-67
Nov-01
Mar-64
Oct-99
Nov-06
Sep-63
Apr-09
Dec-75
Dec-72
Mar-98
Aug-91
Sep-82
Dec-05
Nov-78
Mar-97
Dec-69
Sep-63
Mar-69
Aug-75
Jul-73
May-71
Aug-94
Aug-80
Mar-79
May-07
Apr-08
Apr-79
Sep-82
Feb-88
Dec-01
Jun-05
Jan-72
Oct-80
Dec-08
Nov-87
Jun-73
Dec-74
Sep-82
Nov-07
Dec-76
Jan-02
Dec-42
Dec-42
Dec-42
Dec-42
Dec-42
Dec-42
Dec-42
Dec-42
Dec-42
Dec-42
Dec-42
Dec-42
Dec-42
Dec-42
Dec-42
Dec-42
Dec-42
Dec-42
Dec-42
Dec-42
Dec-42
Dec-42
Dec-42
Dec-42
Dec-42
Dec-42
Dec-42
Dec-42
Dec-42
Dec-42
Dec-42
Dec-42
Dec-42
Dec-42
Dec-42
Dec-42
Dec-42
Dec-42
Dec-42
Dec-42
Dec-42
Dec-42
Dec-42
Dec-42
Dec-42
Dec-42
Dec-42
Dec-42
Dec-42
Dec-42
Dec-42
Dec-42
Dec-42
Dec-42
Dec-42
Dec-42
Dec-42
Dec-42
Dec-42
Dec-42
Dec-42
Dec-42
Dec-42
Dec-42
Dec-42
Dec-42
Dec-42
Marketletter 2Q16
Joinville
Joinville Norte
Jorge Lacerda "A"
Londrina
Nova Santa Rita
Palhoça
Passo Fundo
Salto Osório
Salto Santiago
Santo Ângelo
Siderópolis
Tapera 2
Xanxerê
691.0
300.0
399.8
1,344.0
2,016.0
384.0
168.0
33.3
15.0
1,344.0
352.0
166.0
600.0
SC
SC
SC
PR
RS
SC
RS
PR
PR
RS
SC
RS
SC
Nov-74
Jun-09
Jun-73
Apr-88
Aug-09
Jan-84
Nov-92
Oct-75
Nov-80
Dec-99
Apr-75
Mar-05
Jun-83
Dec-42
Dec-42
Dec-42
Dec-42
Dec-42
Dec-42
Dec-42
Dec-42
Dec-42
Dec-42
Dec-42
Dec-42
Dec-42
(1) Substations transferred to Chesf by donation by acessantes as contractual clause between ANEEL and the agents who needed to build these facilities.
(2) Total Transformation Capacity (MVA Total) = operating capacity + capacity + capacity reservation under review.
(3) Transformers installed in third part substations.
VII.3.2 Substation – Enterprise not renewed in terms of 12,783/13 Law
Eletrobras
Companies
Eletronorte
SS
Transformation Capacity
(MVA)
Ribeiro Gonçalves
Balsas
São Luis III
Miranda II (ATR1)
Lucas do Rio Verde
Nobres
Tucuruí
Lechuga
Coletora Porto Velho
Miramar
SS Lifting Curemas Plant
SS Lifting Therm. Camaçari
Plant
SS Lifting Sobradinho Plant
Furnas(2)
Beginning of
Operation
End of
Concession
350.0
200.0
300.3
450.0
75.0
200.0
300.0
450.0
5,438.4
MA
MA
MA
MA
MT
MT
PA
AM
RO
Dec/11
Dec/11
May/10
Nov/10
Apr/13
Sep/13
Dec/14
Mar/15
Mar/13
Jan/39
Jan/39
Mar/38
Jan/39
Jun/41
Dec/41
Dec/41
May/42
Feb/39
450.0
PA
Apr/16
Apr/46
5.0
PB
Jan/68
Nov/24
400.0
BA
Sep/78
Aug/27
1200.0
BA
Oct/79
Feb/22
Tauá II
Ibicoara
Santa Rita II
Suape III
Natal III
Zebu II
Brumado
Camaçari IV
Suape II
202.0
410.0
450.0
300.0
300.0
200.0
2,400.0
1,200.0
CE
BA
PB
PE
RN
AL
BA
BA
PE
Dec/07
Jan/11
Jul/12
Jul/12
Aug/12
Jul/12
Aug/10
Nov/12
Dec/12
Mar/35
Jun/37
Aug/39
Jan/39
Aug/39
Aug/39
Jun/37
Jul/40
Jan/39
SS Arapiraca III
100.0
AL
Jun/13
Oct/40
SS Extremoz II
150.0
RN
Feb/14
Nov/40
SS João Câmara
360.0
RN
Feb/14
Nov/40
SS Acaraú
200.0
CE
Apr/14
Nov/40
SS
SS
SS
SS
SS
SS
SS
SS
SS
SS
SS
SS
450.0
750.0
300.0
300.0
300.0
100.0
BA
CE
CE
RN
BA
BA
BA
PB
PE
RN
PE
BA
Jun/14
Dec/13
Oct/13
Sep/14
Dec/15
Dec/15
Dec/15
Dec/15
Dec/15
Dec/15
Apr/16
Apr/16
Nov/40
Nov/40
Jun/42
Jun/42
Oct/41
Dec/41
Oct/41
Jun/42
Oct/40
SS
SS
SS
SS
SS
SS
SS
SS
SS
Chesf
Location
(State)
Igaporã
Aquiraz II (1)
Pecém II (1)
Ceará Mirim II (1)
Bom Jesus da Lapa II
Igaporã III
Pindaí II
Campina Grande III (1)
Garanhuns II (1)
Lagoa Nova II
Mirueira II
Polo
Zona Oeste
1,200.0
RJ
Dec/14
May/42
Batalha
Campos
Itumbiara
90.0
186.0
5,075.0
MG
RJ
MG
Aug/06
Dec/68
Mar/73
Aug/41
Jul/27
Feb/20
80
Marketletter 2Q16
Eletrosul
(1)
(2)
(3)
(4)
(5)
Manso
Mascarenhas de Moraes
Santa Cruz(3)
São Gonçalo
Serra da Mesa
Simplício
Foz do Chapecó
Missões
Biguaçu
Caxias 6
Ijuí 2
Lageado Grande
Nova Petrópolis 2
Uruquaiana Frequency
Converter
Ivinhema 2(5)
Biguaçu - Extension
Itajaí – Extension
Joinville Norte - Extension
Nova Santa Rita – Extension
Tapera 2 - Extension
312.5
1,650.7
1,544.0
42.5
1,576.4
497.5
150.0
150.0
1,344.0
330.0
166.0
75.0
83.0
MT
MG
RJ
RJ
GO
RJ
RS
RS
SC
RS
RS
RS
RS
Nov/00
Dec/56
Jun/67
Jul/77
Mar/98
Aug/06
Dec/12
Nov/10
Apr/08
Aug/12
Apr/13
Nov/12
Nov/12
Feb/35
Oct/23
Jul/15
(4)
Nov/39
Aug/41
Jun/41
Jan/39
Mar/35
Oct/40
Oct/40
Oct/40
Oct/40
109.7
RS
Sep/94
Jul/21
300.0
300.0
150.0
150.0
672.0
83.0
MS
SC
RS
SC
RS
RS
Jan/16
Oct/12
Dec/13
Sep/13
Dec/13
Nov/12
Jan/44
Dec/42
Dec/42
Dec/42
Dec/42
Dec/42
Substations belonging to SPEs in which CHESF has its own equipment installed at least one line of input.
Total Transformation Capacity (MVA Total) = operating capacity + capacity + capacity reservation under review.
Affected but not yet extended.
Extension denied.
Transformers installed in third part substations.
81
Marketletter 2Q16
VIII.Distribution Data
VIII.1 Distribution Data
Company
Extension of Distribution
Lines (Km)
Number of
Customers
Number of
Municipalities
Assisted
Substations
19,660
42,360
250,515
1,088,084
0
102
15
40
ED Acre
ED Alagoas
ED Amazonas
Energia
ED Piauí
ED Rondônia
ED Roraima
47,793
924,710
61
24
85,727
57,720
3,600
1,192,118
600,329
110,207
244
52
0
84
60
3
VIII.2 Energy Sold – MWh
Company
1Q16
ED Acre
ED Alagoas
ED Amazonas Energia
ED Piauí
ED Rondônia
ED Roraima
Total
2Q16
243,983
872,817
1,503,876
765,182
717,507
200,319
4,303,683
239,089
805,717
1,460,731
811,192
711,682
190,045
4,218,457
VIII.2.1 Energy Sold by Consumer Class
Class
1Q16
R$ Million
Residential
Industrial
Commercial, services
and others activities
Rural
Public Utilities
Public Ilumination
Public service
Own Consumption
Others
Total
2Q16
MWh
R$ Million
MWh
957.1
259.7
1,765,185.8
679,363.7
913.7
256.9
1,713,191.3
656,385.1
494.6
955,193.1
487.6
946,576.7
74.5
156.1
63.0
59.0
3.3
114.7
2,181.9
201,325.7
341,586.1
187,477.9
161,338.0
8,770.7
2,888.5
4,303,129.3
63.9
166.3
59.8
58.5
2.2
14.4
2,023.3
166,163.3
367,762.1
193,153.8
163,978.2
7,934.0
3,312.3
4,218,456.7
VIII.3 Energy purchased for resale*
Company
Buyer
1Q16
R$ Million
2Q16
MWh
R$ Million
MWh
Eletrobras System
145.78
243,429.00
100.00
239,089
Others
Eletrobras System
56.30
262,812
71.05
258,143
ED Alagoas
Others
231.90
1,051,246
113.70
1,032,570
Eletrobras System
2,062,635
153.61
871,902
ED Amazonas Energia
Others
133.36
511,184
161.03
612,984
Eletrobras System
53.78
380,422
54.20
384,602
ED Piauí
Others
188.33
762,631
185.22
848,869
Eletrobras System
34.53
188,340
51.36
206,632
ED Rondônia
Others
181.65
990,742
270.20
1,086,963
Eletrobras System
58.29
261,740
55.13
247,561
ED Roraima
Others
46.97
38,822
46.60
23,172
*In the distribution companies, it is considered the gross amount without the CDE/CCC discounts, while in section IV.2.3 values are
ED Acre
net.
82
Marketletter 2Q16
VIII.4 Network Expansion – number of new connections
Company
ED
ED
ED
ED
ED
ED
1Q16
Acre
Alagoas
Amazonas Energia
Piaui
Rondonia
Roraima
2Q16
406
10,301
11,328
13,166
8,394
909
851
32,513
9,745
12,991
7,092
1,461
VIII.5 Fuel used to produce electric energy*
Company
ED Acre
ED Alagoas
ED Amazonas
Energia
ED Piauí
ED Rondônia
ED Roraima
Type (Unit)
Diesel Oil
Gas (m3)
Diesel Oil
Gas (m3)
Diesel Oil
Gas (m3)
Diesel Oil
Gas (m3)
Diesel Oil
Gas (m3)
Diesel Oil
Gas (m3)
Amount
1Q16
R$ Million
2Q16
Amount
R$ Million
(L)
15,458,374.0
44.9
14,972,912.0
43.5
(L)
-
-
-
-
(L)
117,843,801.0
392.2
113,541,586.0
379.3
(L)
-
-
-
-
(L)
32,421,500.0
99.5
14,445,551.0
40.1
(L)
10,937,402.3
26.0
6,569,168.0
20.2
*Net of taxes
VIII.6 Quality Indicators and Operational Performance
Company
ED
ED
ED
ED
ED
ED
DEC/ Stoppage
Duration –
hours
FEC Stoppage
Frequency
27.1
13.3
23.5
13.4
5.9
22.3
18.9
9.1
15.0
8.9
4.4
22.8
Acre
Alagoas
Amazonas Energia
Piauí
Rondônia
Roraima
Losses (%)
TMA – Average Time
of Assistence –
minutes
Technical
Commercial
9.9
10.3
7.8
11.2
11.2
7.0
14.4
16.1
35.2
15.6
17.7
5.6
480.9
238.9
309.9
415.7
266.9
103.0
VIII.7 Default
Class
Public Utilities
Industrial
Residential
Commercial, services and
others activities
Others
Total
ED
Acre
ED
Alagoas
ED
Amazonas
Energia
ED
Piauí
ED
Rondônia
ED Roraima
29.38
3.93
25.01
35.77
18.35
89.58
36.20
33.97
161.56
8.57
9.85
123.59
27.47
13.00
64.98
7.33
0.57
8.38
144.72
79.66
473.10
7.88
34.41
68.92
39.83
22.64
2.30
175.98
8.36
74.56
42.39
220.50
67.41
368.06
33.54
215.38
33.57
161.66
10.54
29.12
83
Total
195.81
1,069.28
Marketletter 2Q16
IX.Employees - Effective Headcount
IX.1 By Department
Company
Administrative
Eletronorte
Chesf
Furnas
Eletronuclear
Eletrosul
CGTEE
Amazonas GT
Itaipu Binacional
ED Acre
ED Alagoas
ED Amazonas Energia
ED Piauí
ED Rondônia
ED Roraima
Eletropar
Total
Operational
1,000
1,498
1,155
502
528
107
105
996
158
318
474
221
168
142
4
8,474
2,017
3,066
2,594
1,435
777
489
355
381
93
794
1,254
1,209
535
211
0
15,515
IX.2 Complementary Work-force
2Q16
Eletrobras Companies
Eletronorte
Chesf
Furnas
Eletronuclear
Eletrosul
CGTEE
Amazonas GT
Itaipu Binacional
ED Acre
ED Alagoas
ED Amazonas Energia
ED Piauí
ED Rondônia
ED Roraima
Eletropar
Total
237
0
1,077
0
0
0
0
0
402
541
0
1,602
1,374
164
0
5,397
84
Marketletter 2Q16
X. Investments
X.1 Total Investment
Generation
Eletrobras
Eletronorte
Chesf
Furnas
Eletronuclear
Eletrosul
CGTEE
Amazonas GT
Itaipu Binacional
ED Amazonas Energia
Generation - Maintenance
Eletrobras
Eletronorte
Chesf
Furnas
Eletronuclear
Eletrosul
CGTEE
Amazonas GT
Itaipu Binacional
ED Amazonas Energia
Generation – Partnership Investments
Eletrobras
Eletronorte
Chesf
Furnas
Eletronuclear
Eletrosul
CGTEE
Amazonas GT
Itaipu Binacional
ED Amazonas Energia
1Q16
2Q16
0.99
2.48
7.15
253.88
13.43
1.26
14.91
-
0.49
2.63
4.32
337.20
0.19
0.53
63.51
1.84
1Q16
2Q16
1.79
8.40
5.21
7.01
0.40
1.13
0.04
-
0.74
8.03
12.62
40.30
0.04
1.16
0.02
3.35
1Q16
2Q16
255.00
364.16
266.18
349.10
143.33
-
133.50
235.74
10.00
91.32
94.45
-
85
2016 Budget
41.00
104.50
51.61
4.006.43
65.35
30.58
225.07
7.21
2016 Budget
21.00
46.60
68.90
213.21
11.79
18.79
26.80
4.50
2016 Budget
250.64
286.81
789.21
844.30
238.60
-
Marketletter 2Q16
Transmission
Eletrobras
Eletronorte
Chesf
Furnas
Eletrosul
Amazonas GT
ED Amazonas Energia
Other Companies (*)
1Q16
2Q16
4.40
86.35
178.42
40.83
21.15
0.53
0.48
94.69
137.22
49.79
35.69
0.14
1.61
2016 Budget
12.00
588.92
476.96
350.10
879.69
22.20
19.78
(*) Includes the companies Cepel, Eletropar, Uirapuru, TSBE, RBSE, LVTE.
Transmission - Maintenance
Eletrobras
Eletronorte
Chesf
Furnas
Eletrosul
Amazonas GT
ED Amazonas Energia
Other Companies (*)
1Q16
2Q16
5.24
29.27
33.58
0.80
-
3.93
26.15
48.04
0.54
-
2016 Budget
55.00
99.16
300.63
7.51
4.22
(*)Includes the companies Cepel, Eletropar, Uirapuru, TSBE, RBSE, LVTE.
Transmission – Partnership
Investments
Eletrobras
Eletronorte
Chesf
Furnas
Eletrosul
Amazonas GT
ED Amazonas Energia
Other Companies (*)
1Q16
2Q16
18.00
0.74
29.91
1.60
-
196.96
191.35
1.50
-
(*) Includes the companies Cepel, Eletropar, Uirapuru, TSBE, RBSE, LVTE.
86
2016 Budget
194.46
15.00
607.56
103.42
-
Marketletter 2Q16
Distribution
ED
ED
ED
ED
ED
ED
Acre
Alagoas
Amazonas Energia
Piauí
Rondônia
Roraima
Distribution - Maintenance
ED
ED
ED
ED
ED
ED
1Q16
2Q16
4.53
13.44
20.61
12.06
15.79
4.84
6.76
20.06
34.18
14.85
18.31
7.59
2016 Budget
59.41
169.91
551.82
215.93
133.42
29.81
1Q16
2Q16
2016 Budget
Acre
Alagoas
Amazonas Energia
Piauí
Rondônia
Roraima
2.56
8.35
12.15
6.59
8.44
0.69
2.59
10.82
10.32
14.02
10.22
0.98
15.07
59.91
79.75
56.49
44.19
4.74
Others
1Q16
2Q16
2016 Budget
0.06
3.39
12.30
14.78
0.35
1.41
0.29
0.04
7.50
9.05
17.96
2.43
7.32
0.74
0.42
0.05
4.29
16.45
16.81
2.08
0.42
1.02
7.13
7.83
33.02
4.08
11.61
0.62
1.49
Eletrobras
Eletronorte
Chesf
Furnas
Eletronuclear
Eletrosul
CGTEE
Amazonas GT
Itaipu Binacional
ED Acre
ED Alagoas
ED Amazonas Energia
ED Piauí
ED Rondônia
ED Roraima
Other Companies(*)
(*) Include the companies Cepel, Eletropar, Uirapuru, TSBE, RBSE, LVTE.
The 2016 budget was changed according to Decree of 02/25/2016
87
37.80
49.40
105.53
142.12
19.88
30.43
35.97
16.84
28.38
66.28
199.47
137.47
86.20
6.07
10.18
Marketletter 2Q16
X.2 New Investments
X.2.1 Generation
X.2.1.1 Integral Responsability
Company
Chesf
Unit
WPP Casa Nova I
WPP Casa Nova II
WPP Casa Nova III
Furnas
SHU Anta
Eletronuclear
Angra 3
Eletrosul
Amazonas Energia
State
BA
BA
BA
RJ/MG
(9)
SHU Santo Cristo
SHU Coxilha Rica (10)
TPU Mauá 3
RJ - Angra dos
Reis
SC
SC
Amazonas
Investiment (R$ Million)
Total
Up to 2Q16
800.00
102.50
93.10
2,296.6(3)
Basis: Dec/08
26,144
(6)
165.40
1,183.28
Installed Capacity
(MW)
Energy Assured
(MW)
Beginning of
Operation
(1)
End of Concession
May/12
Aug/16
Aug/16
Jan/46
May/49 (2)
May/49 (2)
662.48
4.78
3.16
180
28
24
61.4
7.1
5.5
2,483.42
28
15.9(5)
GU1 and GU2: See (4)
Mar/07
1,405
1,214.2
Dec/22
Jul/08
19.5
18
590.75
11.04
10.1
-
-
8.064
(7)
19.45
10.08
78.62
Dec/16
Dec/17
Dec/17
Beginning of
Construction
-
Dec/60
Jun/42
Jun/42
(1) Dec/16: Start of 36 wind turbine operation; Dec/17: park complete operating (120 turbines).
(2) According to the MME Ordinance No. 220 of 05.26.2014 and MME Ordinance No. 225 of 05.28.2014.
(3) Includes Simplicio, which is already in operation.
(4) Scheduled date for start of commercial operation of the generating units of PCH Anta as Match DE.E.026.2016 of June 23, 2016, sent to ANEEL: UG1 - 05.01.2018 and UG2 – 09.01.18. It is worth mentioning that the contract supplier
consortium was terminated.
(5) Assured Energy is only the increase to occur when the Anta commercial operation. It does not include the assured energy of Simplicio, reported in Section 1.2.
(6) Includes direct costs of R$ 21,051 million approved in RDE 1302.007/16 de 07/26/2016, approving the new entry into operation date. With indirect costs of R$ 26,144 million.
(7) Includes direct costs and estimated indirect.
(8) No operating license for Angra 3. It is considered 40 years from 1.1.2021 by analogy with Angra 2.
(9) The implementation of this project awaits evaluation. Considered the original budget from August/2013 to be re-evaluated when the deployment resumes.
(10) Start of construction and indefinite operation negative opinion function of the National Artistic Heritage Institute - IPHAN.
88
(8)
Marketletter 2Q16
X.2.1.2 Special Proposed Company
SPE
Plant
Eletrobras
Companies
(%)
Installed
Location
Capacity
(State)
(MW)
Energy
Assured
(MW)
Beginning
Beginning of
End of
of
Construction Concession
Operation
Investiment (R$
Million)
Total
PA
11,233.10
4,418.90
Apr/16
Aug/11
Aug/45
Final
working
Basis:
35,131.72
April
Basis/10:
27,706.00
Up to
2Q16
Working
Schedule
(%)
Partners
Eletrobras Holding
(15.00%)
Chesf (15.00%)
Eletronorte
(19.98%)
Privados (50.02%)
Norte Energia S.A. (1)
HPU Belo Monte
Eletronorte
(19.98%)
Chesf (15%)
Eletrobras
Holding (15%)
Cia. Energética Sinop
S.A.
HPU Sinop
Eletronorte
(24.5%)
Chesf (24.5%)
MT
400.00
239.8
Jan/18
Dec/13
Dec/47
2,598.76
1,023.80
67.40%
ESBR Participações S.A.
(2)
HPU Jirau
Chesf (20%)
Eletrosul (20%)
RO
3,750.00
2,205.10
Sep/13
Dec/09
Aug/43
19,385.00
18,879.68
97.00%
Acauã Energia S.A.
WPP Acauã
BA
12.00
3.1
May/17
mai/15
Apr/49
37.40
31.90
80.40%
Sequóia (0.00668%)
Angical 2 Energia S.A.
WPP Angical 2
BA
14.00
5.1
Apr/17
mai/15
Apr/49
55.87
47.05
78.10%
Sequóia (0.04%)
Arapapá Energia S.A.
WPP Arapapá
BA
10.00
2.2
Jun/17
mai/15
Apr/49
28.58
18.28
53.50%
Sequóia (0.1%)
Caititú 2 Energia S.A.
WPP Caititú 2
BA
14.00
5.1
Sep/17
mai/15
Apr/49
57.20
42.97
65.10%
Sequóia (0.04%)
Caititú 3 Energia S.A.
WPP Caititú 3
BA
14.00
4.7
Sep/17
mai/15
Apr/49
57.75
42.22
65.50%
Sequóia (0.04%)
Carcará Energia S.A.
WPP Carcará
BA
10.00
4.6
Aug/17
mai/15
Apr/49
60.64
48.52
75.30%
Sequóia (0.04%)
Coqueirinho 2 Energia
S.A.
Corrupião 3 Energia
S.A.
WPP
Coqueirinho 2
WPP Corrupião
3
BA
20.00
8.5
Mar/17
mai/15
Jun/49
100.15
89.71
81.10%
Sequóia (0.0238%)
BA
14.00
4.2
Aug/17
mai/15
Apr/49
58.39
45.70
69.60%
Sequóia (0.04%)
Papagaio Energia S.A.
WPP Papagaio
BA
18.00
4.9
Apr/17
mai/15
Jun/49
62.64
48.80
67.30%
Sequóia (0.04%)
Tamanduá Mirim 2
Energia S.A.
WPP Tamanduá
Mirim 2
BA
24.00
8
Jun/17
mai/15
Jun/49
103.59
82.05
72.60%
Sequóia (16.99%)
Teiú 2 Energia S.A.
WPP Teiú 2
BA
14.00
4.2
Jul/17
mai/15
Apr/49
48.41
33.69
63.90%
Teles Pires Participações
S.A. (3)
HPU Teles Pires
Chesf
(99.93%)
Chesf
(99.96%)
Chesf (99.9%)
Chesf
(99.96%)
Chesf
(99.96%)
Chesf
(99.96%)
Chesf
(99.98%)
Chesf
(99.96%)
Chesf
(99.96%)
Chesf
(83.01%)
Chesf
(99.95%)
Furnas
(24.5%)
Eletrosul
(24.72%)
PA/MT
1,091.88
363.3
Nov/15
89
Aug/11
Jun/46
4,507.20
29,949.22
434.31
87.94%
100.00%
Chesf (24.5%)
Eletronorte (24.5%)
EDFNT (51.00%)
Suez Energy (40%)
Mizha Energia
(20%)
Eletrosul (20%)
Sequoia (0.05%)
Eletrosul(24.72%)
Neoenergia
(50.56%)
Odebrecht Part.
Marketletter 2Q16
Invest. (0.09%)
Madeira Energia S.A.
(3)
HPU Santo
Antônio
Empresa de Energia São
Manoel S.A.
Central Geradora
Famosa I S.A.
Central Geradora
Pau Brasil S.A.
Central Geradora
Rosada S.A.
Central Geradora
São Paulo S.A.
Eólica
Eólica
Eólica
Eólica
Furnas (39%)
RO
417.57
206.2
Mar/12
Aug/08
Jun/43
20,743.00
4,027.40
99.74%
HPU São
Manoel
Furnas
(33.33%)
MT/PA
700.00
421.7
From
Jan/18
Aug/14
Apr/49
3,178.00
245.00
49.23%
Famosa I
Furnas (49%)
RN
22.50
11.1
May/18
Aug/16
May/47
78.68
7.58
0.00%
Pau Brasil
Furnas (49%)
CE
15.00
7.7
May/18
Aug/16
Mar/47
78.68
5.05
0.00%
Rosada
Furnas (49%)
RN
30.00
13.4
May/18
Aug/16
May/48
78.68
9.57
0.00%
São Paulo
Furnas (49%)
CE
17.50
8.1
May/18
Aug/16
Mar/47
78.68
5.59
0.00%
Energia dos Ventos V
S.A.
São Januário
Furnas
(99.99%)
CE
19.20
9
Jul/19
Jan/17
Jul/47
109.06
10.69
0.00%
Energia dos Ventos VI
S.A.
Nossa Senhora
de Fátima
Furnas
(99.99%)
CE
28.80
12.8
Jul/19
Jan/17
Aug/47
109.06
10.69
0.00%
Energia dos Ventos VII
S.A.
Jandaia
Furnas
(99.99%)
CE
28.80
14.1
Jul/19
Jan/17
Aug/47
109.06
10.69
0.00%
Energia dos Ventos VIII
S.A.
São Clemente
Furnas
(99.99%)
CE
19.20
9.3
Jul/19
Jan/17
Jul/47
109.06
10.69
0.00%
Energia dos Ventos IX
S.A.
Jandaia I
Furnas
(99.99%)
CE
19.20
9.9
Jul/19
Jan/17
Jul/47
109.06
10.69
0.00%
Bom Jesus Eólica S.A.
Bom Jesus
Furnas (49%)
CE
18.00
8.1
May/18
Aug/16
Apr/49
136.16
8.10
0.00%
90
Odebrecth
Energia(18.6%)
Cemig (10.0%)
SAAG (12.4%)
Andrade Gutierrez
(12.4%)
Fundo de Invest. and
Participações
Amazônia Energia
(20.0%)
EDP – Energias do
Brasil S.A.(33.33%)
CWEI (33.33%)
PF Participações
(51.00%)
PF Participações
(51.00%)
PF Participações
(51.00%)
PF Participações
(51.00%)
Alupar(0 %)
Central Eólica
Goiabeira (0.01%)
Alupar(0 %)
Central Eólica
Goiabeira (0.01%)
Alupar(0 %)
Central Eólica
Goiabeira (0.01%)
Alupar(0%)
Central Eólica
Goiabeira (0.01%)
Alupar(0 %)
Central Eólica
Goiabeira (0.01%)
Fundo de
Investimento em
Participações Caixa
Milão (50.99%)
Central Eólica Bom
Jesus Ltda. (0.01%)
Marketletter 2Q16
Cachoeira Eólica S.A.
Cachoeira
Furnas (49%)
CE
12.00
5
May/18
Aug/16
Apr/49
136.16
8.10
0.00%
Pitimbu Eólica S.A.
Pitimbu
Furnas (49%)
CE
18.00
7.2
May/18
Aug/16
Mar/49
136.16
8.10
0.00%
São Caetano Eólica S.A.
São Caetano
Furnas (49%)
CE
25.20
11
May/18
Aug/16
Apr/49
136.16
8.10
0.00%
São Caetano I Eólica
S.A.
São Caetano I
Furnas (49%)
CE
18.00
7.7
May/18
Aug/16
Apr/49
136.16
8.10
0.00%
São Galvão Eólica S.A.
São Galvão
Furnas (49%)
CE
22.00
9.5
May/18
Aug/16
Mar/49
136.16
8.10
0.00%
Carnaúba I Eólica S.A.
Carnaúba I
Furnas (49%)
RN
22.00
9.4
May/18
Aug/16
Jul/49
142.02
7.83
0.00%
Carnaúba II Eólica S.A.
Carnaúba II
Furnas (49%)
RN
18.00
7.3
May/18
Aug/16
Jul/49
142.02
7.83
0.00%
Carnaúba III Eólica S.A.
Carnaúba III
Furnas (49%)
RN
16.00
7.5
May/18
Aug/16
Jul/49
142.02
7.83
0.00%
91
Fundo de
Investimento em
Participações Caixa
Milão (50.99%)
Central Eólica Bom
Jesus Ltda. (0.01%)
Fundo de
Investimento em
Participações Caixa
Milão (50.99%)
Central Eólica Bom
Jesus Ltda. (0.01%)
Fundo de
Investimento em
Participações Caixa
Milão (50.99%)
Central Eólica Bom
Jesus Ltda. (0.01%)
Fundo de
Investimento em
Participações Caixa
Milão (50.99%)
Central Eólica Bom
Jesus Ltda. (0.01%)
Fundo de
Investimento em
Participações Caixa
Milão (50.99%)
Central Eólica Bom
Jesus Ltda. (0.01%)
Fundo de
Investimento em
Participações Caixa
Milão (50.99%)
Central Eólica Bom
Jesus Ltda. (0.01%)
Fundo de
Investimento em
Participações Caixa
Milão (50.99%)
Central Eólica Bom
Jesus Ltda. (0.01%)
Fundo de
Investimento em
Participações Caixa
Milão (50.99%)
Central Eólica Bom
Marketletter 2Q16
Jesus Ltda. (0.01%)
Carnaúba V Eólica S.A.
Carnaúba V
Furnas (49%)
RN
24.00
10.1
May/18
Aug/16
Jul/49
142.02
7.83
0.00%
Cervantes I Eólica S.A.
Cervantes I
Furnas (49%)
RN
16.00
7.1
May/18
Aug/16
Jul/49
142.02
7.83
0.00%
Cervantes II Eólica S.A.
Cervantes II
Furnas (49%)
RN
12.00
5.6
May/18
Aug/16
Jul/49
142.02
7.83
0.00%
Punaú I Eólica S.A.
Punaú I
Furnas (49%)
RN
24.00
11
May/18
Aug/16
Jul/49
142.02
7.83
0.00%
Geradora Eólica Arara
Azul S.A.
Arara Azul
Furnas (90%)
RN
27.50
10.7
Oct/18
Jan/17
Nov/49
88.58
There is
no
amount
0.00%
Geradora Eólica Bentevi
S.A.
Bentevi
Furnas (90%)
RN
15.00
5.7
Oct/18
Jan/17
Nov/49
88.58
There is
no
amount
0.00%
92
Fundo de
Investimento em
Participações Caixa
Milão (50.99%)
Central Eólica Bom
Jesus Ltda. (0.01%)
Fundo de
Investimento em
Participações Caixa
Milão (50.99%)
Central Eólica Bom
Jesus Ltda. (0.01%)
Fundo de
Investimento em
Participações Caixa
Milão (50.99%)
Central Eólica Bom
Jesus Ltda. (0.01%)
Fundo de
Investimento em
Participações Caixa
Milão (50.99%)
Central Eólica Bom
Jesus Ltda. (0.01%)
Eólica Tecnologia
Ltda (7.00%)
Ventos Tecnologia
Elétrica Ltda
(2.99%)
Central Eólica Arara
Azul Ltda (0.01%)
Eólica Tecnologia
Ltda (7.00%)
Ventos Tecnologia
Elétrica Ltda
(2.99%)
Central Eólica
Bentevi Ltda
(0.01%)
Marketletter 2Q16
Geradora Eólica Ouro
Verde I S.A.
Ouro Verde I
Furnas (90%)
RN
27.50
10.7
Oct/18
Jan/17
Nov/49
88.58
There is
no
amount
0.00%
Geradora Eólica Ouro
Verde II S.A.
Ouro Verde II
Furnas (90%)
RN
30.00
11.2
Oct/18
Jan/17
Nov/49
88.58
There is
no
amount
0.00%
Geradora Eólica Ouro
Verde III S.A.
Ouro Verde III
Furnas (90%)
RN
25.00
9.4
Oct/18
Jan/17
Nov/49
88.58
There is
no
amount
0.00%
Geradora Eólica Ventos
de Santa Rosa S.A.
Santa Rosa
Furnas (90%)
CE
20.00
8.4
Oct/18
Jan/17
Oct/49
91.20
There is
no
amount
0.00%
Geradora Eólica Ventos
de Uirapuru S.A.
Uirapuru
Furnas (90%)
CE
28.00
12.6
Oct/18
Jan/17
Oct/49
91.20
There is
no
amount
0.00%
Geradora Eólica Ventos
do Angelim S.A.
Ventos de
Angelim
Furnas (90%)
CE
24.00
10.3
Oct/18
Jan/17
Nov/49
91.20
There is
no
amount
0.00%
93
Eólica Tecnologia
Ltda (7.00%)
Ventos Tecnologia
Elétrica Ltda
(2.99%)
Central Eólica Ouro
Verde I Ltda
(0.01%)
Eólica Tecnologia
Ltda (7.00%)
Ventos Tecnologia
Elétrica Ltda
(2.99%)
Central Eólica Ouro
Verde II Ltda
(0.01%)
Eólica Tecnologia
Ltda (7.00%)
Ventos Tecnologia
Elétrica Ltda
(2.99%)
Central Eólica Ouro
Verde III (0.01%)
Eólica Tecnologia
Ltda (7.00%)
Ventos Tecnologia
Elétrica Ltda
(2.99%)
Central Eólica Santa
Rosa Ltda (0.01%)
Eólica Tecnologia
Ltda (7.00%)
Ventos Tecnologia
Elétrica Ltda
(2.99%)
Central Eólica
Uirapuru Ltda
(0.01%)
Eólica Tecnologia
Ltda (7.00%)
Ventos Tecnologia
Elétrica Ltda
(2.99%)
Central Eólica
Angelim Ltda
(0.01%)
Marketletter 2Q16
Consórcio Serra do Mel
Serra do Mel I
Furnas (90%)
RN
28.00
13
Oct/18
Jan/17
Oct/49
135.29
There is
no
amount
0.00%
Consórcio Serra do Mel
Serra do Mel II
Furnas (90%)
RN
28.00
12.8
Oct/18
Jan/17
Oct/49
135.29
There is
no
amount
0.00%
Consórcio Serra do Mel
Serra do Mel III
Furnas (90%)
RN
28.00
12.5
Oct/18
Jan/17
Nov/49
135.29
There is
no
amount
0.00%
Geradora Eólica
Itaguaçu da Bahia SPE
S.A.
Itaguaçu da
Bahia
Furnas (49%)
BA
28.00
14
Feb/19
May/18
Sep/49
144.93
6.96
0.00%
Geradora Eólica Ventos
de Santa Luiza SPE S.A.
Ventos de
Santa Luiza
Furnas (49%)
BA
28.00
14.2
Feb/19
Jan/17
Sep/49
144.93
6.96
0.00%
Geradora Eólica Ventos
de Santa Madalena SPE
S.A.
Ventos de
Santa Madalena
Furnas (49%)
BA
28.00
14.7
Feb/19
Jan/17
Sep/49
144.93
6.96
0.00%
Geradora Eólica Ventos
de Santa Marcella SPE
S.A.
Ventos de
Santa Marcella
Furnas (49%)
BA
28.00
13.6
Feb/19
Jan/17
Sep/49
144.93
6.96
0.00%
Geradora Eólica Ventos
de Santa Vera SPE S.A.
Ventos de
Santa Vera
Furnas (49%)
BA
28.00
15.2
Feb/19
Jan/17
Sep/49
144.93
6.96
0.00%
94
Eólica Tecnologia
Ltda (9.99%)
Gestamp Eólica
Brasil Ltda (0.01%)
Eólica Tecnologia
Ltda (9.99%)
Gestamp Eólica
Brasil Ltda (0.01%)
Eólica Tecnologia
Ltda (9.99%)
Gestamp Eólica
Brasil Ltda (0.01%)
Salus Fundo de
Investimento em
Participações
(49.00%)
Casa dos Ventos
Energias Renováveis
S.A. (2.00%)
Salus Fundo de
Investimento em
Participações
(49.00%)
Casa dos Ventos
Energias Renováveis
S.A. (2.00%)
Salus Fundo de
Investimento em
Participações
(49.00%)
Casa dos Ventos
Energias Renováveis
S.A. (2.00%)
Salus Fundo de
Investimento em
Participações
(49.00%)
Casa dos Ventos
Energias Renováveis
S.A. (2.00%)
Salus Fundo de
Investimento em
Participações
(49.00%)
Casa dos Ventos
Energias Renováveis
S.A. (2.00%)
Marketletter 2Q16
Geradora Eólica Ventos
de Santo Antônio SPE
S.A.
Ventos de
Santo Antônio
Furnas (49%)
BA
28.00
16.1
Feb/19
Jan/17
Sep/49
144.93
6.96
0.00%
Geradora Eólica Ventos
de São Bento SPE S.A.
Ventos de São
Bento
Furnas (49%)
BA
28.00
14.4
Feb/19
Jan/17
Sep/49
144.93
6.96
0.00%
Geradora Eólica Ventos
de São Cirilo SPE S.A.
Ventos de São
Cirilo
Furnas (49%)
BA
28.00
14.7
Feb/19
Jan/17
Sep/49
144.93
6.96
0.00%
Geradora Eólica Ventos
de São João SPE S.A.
Ventos de São
João
Furnas (49%)
BA
28.00
15
Feb/19
Jan/17
Sep/49
144.93
6.96
0.00%
Geradora Eólica Ventos
de São Rafael SPE S.A.
Ventos de São
Rafael
Furnas (49%)
BA
28.00
13.8
Feb/19
Jan/17
Sep/49
144.93
6.96
0.00%
(1) Operating with 1,258.9 MW.
(2) Operating with 3,150 MW.
(3) Installed capacity is still under implementation. Physical security is the additional value corresponding to the installed power still being implemented.
95
Salus Fundo de
Investimento em
Participações
(49.00%)
Casa dos Ventos
Energias Renováveis
S.A. (2.00%)
Salus Fundo de
Investimento em
Participações
(49.00%)
Casa dos Ventos
Energias Renováveis
S.A. (2.00%)
Salus Fundo de
Investimento em
Participações
(49.00%)
Casa dos Ventos
Energias Renováveis
S.A. (2.00%)
Salus Fundo de
Investimento em
Participações
(49.00%)
Casa dos Ventos
Energias Renováveis
S.A. (2.00%)
Salus Fundo de
Investimento em
Participações
(49.00%)
Casa dos Ventos
Energias Renováveis
S.A. (2.00%)
Marketletter 2Q16
X.2.2 Transmission
X.2.2.1 Integral Responsability
X.2.2.1.1 Transmission Line
Eletrobras Companies
Eletronorte
From - To
TL Utinga - Miramar 230 kv Adequation
Eunápolis-Teixeira Freitas II
C1
Funil-Itapebi C3
Eunápolis-Teixeira Freitas II
C2
Pau Ferro-Santa Rita II
Paraíso-Açu II
Açu II-Mossoró II
Chesf
Total Investment (R$
Million)
Lines Extension (km)
Tension (kV)
Beginning of Operation
End of Concession
3.06
68
230
Feb/16
Dec/42
30.09
145.00
230
Dec/17
Oct/38
41.07
223.00
230
Dec/17
Apr/37
44.15
152.00
230
Dec/17
Aug/39
36.11
84.89
230
Nov/17
Aug/39
230
Oct/17
Nov/40
69.00
0
Oct/17
Nov/40
Morro do Chapéu II-Irecê
22.13
65.00
230
Oct/16
Oct/41
Paraíso-Lagoa Nova II
33.11
65.00
230
Aug/16
Aug/41
Teresina II-Teresina III
13.76
26.00
230
Aug/16
Dec/41
Recife II-Suape II C2
41.91
44.00
230
Mar/18
Dec/41
105.00
230
out/18
Dec/41
31.00
230
Dec/17
Dec/41
1.30
230
Sep/17
May/42
20.00
230
Aug/17
May/42
45.00
230
Feb/18
May/42
5.00
230
Feb/18
May/42
40.00
230
Jul/17
Jun/42
56.17
230
Jul/17
Jun/42
110.00
230
Dec/17
Jun/42
Camaçari IV-Sapeaçu
Sapeaçu-Sto.Antonio de Jesus
C3
Jardim-N Sra do Socorro
Messias-Maceió II
Camaçari IV-Pirajá
Pituaçú-Pirajá
84.29
13.6
47.07
Mossoró II-Mossoró IV
Ceará Mirim II-Touros II
81.74
Russas II-Banabuiu C2
Furnas
96.70
123.00
TL Mascarenhas – Linhares
and SS Linhares
67.2
(Basis: Dec/08)
99
230
Apr/17
Jul/40
TL Xavantes – Pirineus (1)
31.18
(Basis: Sep/11)
50
230
Oct/17
Dec/41
96
Marketletter 2Q16
Port. Jorge Lacerda A Palhoça, in SS Garopaba
Port. TL Porto Primavera Ivinhema, in SS Nova
Andradina (Enersul)
Port. Blumenau - Palhoça, in
SS Gaspar 2
9.89
5.4
138
(2)
Dec/42
9.85
11
138
Jul/16
Dec/42
8.50
2
230
Sep/16
Dec/42
Capivari do Sul - Viamão 3
53.11
71.8
230
Mar/18
Mar/45
Capivari do Sul - Guaíba 3
223.42
170
525
Mar/18
Mar/45
Capivari do Sul - Gravataí
94.15
73.7
525
Mar/18
Mar/45
Guaíba 3 - Povo Novo C2
234.16
235.6
525
Mar/18
Mar/45
Marmeleiro 2 - Povo Novo C2
163.77
152
525
Mar/18
Mar/45
Marmeleiro 2 - Santa Vitória
do Palmar 2 - C2
54.77
48.3
525
Mar/18
Mar/45
Guaíba 3 - Nova Santa Rita C2
Eletrosul
58.84
37
525
Mar/18
Mar/45
Gravataí - Guaíba 3 C1
169.65
68.7
525
Mar/18
Mar/45
Guaíba 2 - Guaíba 3 C1
15.73
19.1
230
Mar/18
Mar/45
Guaíba 2 - Guaíba 3 C2
15.73
19.1
230
Mar/18
Mar/45
0.93
10.8
525
Mar/18
Mar/45
426.80
Port. Nova Santa Rita - Povo
Novo, in SS Guaíba 3
Candiota 2 - Guaíba 3 C2
271
525
Mar/18
Mar/45
Port. Bagé 2 - Presidente
Médici, in SS Candiota 2
Porto Alegre 1 - Porto Alegre 8
- Underground
Porto Alegre 1 - Porto Alegre
12 - Underground
8.32
6.4
230
Mar/18
Mar/45
22.99
4
230
Mar/18
Mar/45
23.10
3.5
230
Mar/18
Mar/45
Gravataí 3 - Salto Osório 3
50.75
67.5
230
Mar/18
Mar/45
2.31
1.6
230
Mar/18
Mar/45
1.69
0.8
230
Mar/18
Mar/45
1.69
0.8
230
Mar/18
Mar/45
Port. Lagoa dos Barros Osório 2
Port. Nova Prata 2 - Passo
Fundo (C1) in SS Vila Maria
Port. Nova Prata 2 - Passo
Fundo (C2) in SS Vila Maria
Livramento 3 - Alegrete 2
63.84
122.1
230
Mar/18
Mar/45
125.71
224
230
Mar/18
Mar/45
7.98
6
230
Mar/18
Mar/45
Livramento 3 - Maçambará 3
102.20
186.4
230
Mar/18
Mar/45
Port. Maçanbará - Santo
ângelo (C1) in SS Maçambará
0.36
1.2
230
Mar/18
Mar/45
Livramento 3 - Santa Maria 3
Livramento 3 - Cerro Chato
97
Marketletter 2Q16
3
Port. Maçanbará - Santo
Ângelo (C2) in SS Maçambará
3
0.36
0.6
230
Mar/18
Mar/45
(1) The transmission line was energized in 03/25/2016, the detached form the circuit 1 (CELG), and still depends on the completion of the line inputs at substations associated with the project.
(2) The definition of operating start depends substation deployment Celesc distributor.
X.2.2.1.2 Substations
Total Investment (R$
Million)
Transformation
Capacity (MVA)
Location (State)
Beginning of
Operation
SS Miramar - Stage 2 EL 230 kv to SS Utinga
SS Rondonópolis - Stage AT4
SS Tucuruí - Stage BY RLL
SS Tucuruí - Stage AT2 and Pátio 230kv
SS Utinga - EL 230kv to Miramar - C1 and C2
SS 230/69 kv Morro do Chapéu II
SS 230/69 kv Ibiapina
SS 230/69 kv Teresina III
SS 230/69 kv N.S. Socorro
SS 230/69 kv Maceió II
SS 230/138 kv Poções II
SS 230/69 kv Pirajá
SS 230/69 kv Jaboatão II
SS 230/69 kv Touros II
SS 230/69 kv Mossoró IV
SS 230/138 kV Teixeira de Freitas II
Garopaba - Two EL implementation modules
Gaspar - Two EL implementation modules
10.57
15.92
8.86
73.70
16.47
24.33
51.22
29.21
94.43
0.00
0.00
30.57
68.77
46.18
0.00
17.91
7.48
6.80
----------150
200
400
300
400
200
360
300
150
100
100
-
230
230
500
500
230
BA
CE
PI
SE
AL
BA
BA
PE
RN
RN
BA
SC
SC
Mar/16
Feb/16
Feb/16
Feb/16
Feb/16
Oct/16
Aug/16
Aug/16
Sep/17
Aug/17
Jul/17
Nov/17
Nov/17
Jul/17
Jul/17
Dec/17
(1)
Sep/16
Dec/42
Dec/42
Dec/42
Dec/42
Dec/42
Oct/41
Aug/41
Dec/41
May/42
May/42
May/42
May/42
Jun/42
Jun/42
Jun/42
Oct/38
Dec/42
Dec/42
Biguaçu - Expansion "J"
37.58
672
SC
Sep/16
Mar/35
34.17
-
SC
Jun/17
Mar/35
5.41
12.20
11.79
50
150
150
SC
SC
SC
Sep/16
Sep/16
Sep/16
Dec/42
Dec/42
Dec/42
10.60
75
SC
Nov/16
Oct/40
4.96
-
MS
Jul/16
Dec/42
Eletrobras Companies
Eletronorte
Chesf
Eletrosul
SS
Biguaçu - Expansion – Bar Reactors Bench 525 kV - 200
MVAr
Canoinhas - Expansion "G"
Desterro - Expansion "A"
Joinville Norte - Expansion "E"
Lageado Grande II - Imp. 2nd Transformer 230/138 kV
and connections
Nova Andradina (Enersul) - Two EL implementation
98
End of
Concession
Marketletter 2Q16
modules 138 Kv
Canoinhas - Expansion "F"
Santo Ângelo - Expansion "G"
Tapera - Expansion "C" - 50 MVAr
Dourados – Two benches capacitors of 230kV of 50 Mvar
Capivari do Sul 525/230/138 kV
Viamão 3 (Expansion) 230 kV
Gravataí 3 (Expansion) 525 kV
Guaíba 3 525/230 kV
Guaíba 2 (Expansion) 230 kV
Sta Vitória do Palmar (Expansion) 525 kV
Marmeleiro (Expansion) 525 kV
Povo Novo (Expansion) 525 kV
Nova Santa Rita (Expansion) 525 kV
Candiota 2 525/230 kV
Livramento 3 – synchronous compensator 230 kV
Maçambará 3 230 kV
Alegrete 2 (Expansion) 230 kV
Santa Maria 3 (Expansion) 230 kV
Cerro Chato (Expansion) 230 kV
Porto Alegre 1 (Expansion, GIS) 230/69 kV
Porto Alegre 8 (Expansion) 230 kV
Porto Alegre 12 (Expansion, GIS) 230 kV
Osório 3 230 kV
Gravataí 3 (Expansion) 230 kV
Vila Maria 230/138 kV
7.92
44.30
8.15
16.10
165.90
7.20
21.48
210.72
11.66
16.04
46.23
43.51
8.49
99.57
109.33
39.34
7.49
9.18
4.30
56.38
7.99
8.00
22.83
7.44
43.80
(1) The definition of operating start depends on substation deployment Celesc distributor.
99
150
672
1544
1344
1344
249
300
SC
RS
RS
MS
RS
RS
RS
RS
RS
RS
RS
RS
RS
RS
RS
RS
RS
RS
RS
RS
RS
RS
RS
RS
RS
Jan/18
Feb/18
Jan/18
Apr/18
Mar/18
Mar/18
Mar/18
Mar/18
Mar/18
Mar/18
Mar/18
Mar/18
Mar/18
Mar/18
Mar/18
Mar/18
Mar/18
Mar/18
Mar/18
Mar/18
Mar/18
Mar/18
Mar/18
Mar/18
Mar/18
Dec/42
Dec/42
Dec/42
Dec/42
Mar/45
Mar/45
Mar/45
Mar/45
Mar/45
Mar/45
Mar/45
Mar/45
Mar/45
Mar/45
Mar/45
Mar/45
Mar/45
Mar/45
Mar/45
Mar/45
Mar/45
Mar/45
Mar/45
Mar/45
Mar/45
Marketletter 2Q16
X.2.2.2 Special Proposed Company
X.2.2.2.1 Transmission Lines
SPE
From - To
Transnorte Energia
S.A.
Belo Monte
Transmissora de
Energia S.A.
TDG Transmissora
Delmiro Gouveia S.A.
Transenergia Goiás
S.A.
Triângulo Mineiro
Transmissora S.A.
Paranaíba
Transmissora de
Energia S.A.
Lago Azul
Transmissora S.A.
Eng. Lechuga - Equador
Equador - Boa Vista
Mata de Santa
Genebra
Transmissora S.A.
Itatiba – Bateias
Vale do São
Bartolomeu
Transmissora de
Energia S.A.
Fronteira Oeste
Transmissora de
Energia S.A.
Paraíso Transmissora
de Energia S.A.
Eletrobras
Companies (%)
Up to 2Q16
Lines
Extension
(km)
Tension
(kV)
Beginning of
Operation
End of
Concession
Investiment (R$ Million)
(1)
Total
Eletronorte (49%)
488.58
399.57
170.86
0.00
400.3
315.20
500
Feb/18
Jan/42
Eletronorte (24.5%)
Furnas (49.9%)
5,578.00
2,049.00
2092
±800
Feb/18
Jun/44
TL São Luiz II/ São Luiz III
Chesf (49%)
425.00
382.00
156
230
Dec/16
Jul/40
Serra da Mesa – Niquelândia
Furnas (99%)
130.00
87.40
100
230
May/17
Marimbondo II - Assis
Furnas (49%)
327.38
312.84
296.5
500
Aug/16
244
500
Aug/16
373
500
Aug/16
Xingu – Estreito
Barreiras II - Rio das Éguas
Rio das Éguas - Luziânia
Barro Alto - Itapaci
Araraquara II - Itatiba
Araraquara II - Fernão Dias
Luziânia - Brasília Leste
Furnas (24.5%)
1,061.20
997.53
Furnas (49.9%)
36.00
24.50
Furnas (49.9%)
2.021 (2)
598.52
Furnas (39%)
293.30
209.98
Brasília Sul - Brasília Geral
Santo Ângelo/Maçambará
Pinhalzinho/Foz do Chapecó, double
circuit
Paraíso 2-Chapadão;
Campo Grande 2-Paraíso 2;
TL Portioning Chapadão - Campo
Grande 2 - C1 in SS Paraíso 2
69
230
Nov/16
399
500
Sep/17
207
241
500
500
Sep/17
Sep/17
67
500
Feb/17
13.5
230
Aug/16
Eletrosul (51%)
110.57
17.27
199
72
230
230
Sep/17
Jun/17 and Jan/18
Jan/44
Eletrosul (24.5%)
133.97
5.68
65
217
1
230
Sep/17
Mar/18
Sep/17
Mar/45
(1) Investment Total Amount on the basis of the development of the business plan.
(2) Includes the substations and refers to June/16.
100
Marketletter 2Q16
X.2.2.2.2 Substations
SPE
Transnorte Energia S.A.
Mata de Santa Genebra
Transmissora S.A.
Vale do São Bartolomeu
Transmissora de
Energia S.A.
Belo Monte
Transmissora de
Energia S.A.
Triângulo Mineiro
Transmissora S.A.
Fronteira Oeste
Transmissora de
Energia S.A. (3)
Transmissora Sul
Litorânea de Energia TSLE
SS
SS Boa Vista - CER
SS Engenheiro Lechuga
SS Equador
SS Boa Vista
SS Santa Bárbara
D’Oeste 440 kV, Static
Compensator (300,+300) Mvar;
SS Itatiba 500 kV,
Static Compensator;
(-300,+300) Mvar.
SS 500/440 kV Fernão
Dias 1.200 MVA – 1st
Transf. bench
SS 500/440 kV Fernão
Dias 2.400 MVA
2nd and 3rd Transf.
bench
SS Brasília Leste
Converter Station
CA/CC,±800 kV, 4.000
MW, with SS 500 kV
Xingu;
Converter Station
CA/CC, ±800 kV, 3.850
MW, with SS 500 kV
Estreito
SS Marimbondo II
SS Assis
Pinhalzinho, in 230/138
kV (ATF1, ATF2 e
ATF3);
Extensions SS
Maçarambá, Foz do
Chapecó and Santo
Angelo.
Extension SS Povo
Novo 525/230 kV
Eletrobras
Companies (%)
Total Investiment
(R$ Million)
Eletronorte (49%)
100.14
26.24
111.44
100.24
Transformation
Capacity (MVA)
-
Furnas (49.9%)
Furnas (39%)
Furnas (24.5%)
Location (State)
Beginning of
Operation
RR
AM
RR
RR
May/15
SP
Nov/16
Feb/18
0
End of Concession
Jan/42
May/44
0
2,049
SP
Nov/16
0
SP
Feb/18
1,080
DF
Sep/16
4,000
Xingu (PA)
Feb/18
0
Oct/43
Jun/44
3,850
Estreito (MG)
Feb/18
Furnas (49%)
0
(1)
(2)
MG
SP
Aug/16
Aug/16
Aug/43
Aug/43
Eletrosul (51%)
58.69
450
SC/RS
Jun/17
Jan/44
Eletrosul (%)
36.99
672
RS
Aug/17
Aug/42
101
Marketletter 2Q16
Paraíso Transmissora
de Energia S.A.
Campo Grande 2 EL
230 PAR2;
Chapadão EL PAR2;
Paraíso 2, 230/138 kV.
Eletrosul (24.5%)
72.23
300
(1) 4 single-phase reactors of 45.3 MVAr each.
(2) 7 single-phase reactors of 45.3 MVAr each.
(3) The expansions of SSs Maçambara and Santo Angelo are scheduled for Sep/17. SSlocated in SC, and expanded in the RS.
102
MS
Mar/18
Sep/17
Sep /17
Mar/45
Marketletter 2Q16
XI. SPEs Data
XI.1 Operational Data
XI.1.1 Generation
XI.1.1.1 Operational Assets and Generated Energy
SPE
EAPSA - Energia Águas Da
Pedra S.A.
Amapari Energia S.A. (1)
Brasventos Miassaba 3
Geradora de Energia S.A
Brasventos Eolo Geradora
de Energia S.A.
Rei dos Ventos 3 Geradora
de Energia S.A.
ESBR Participações S.A.
(3)
Plant
HPU
Dardanelos
TPU Serra do
Navio
Wind Farm
Miassaba 3
Wind Farm Rei
dos Ventos 1
Wind Farm Rei
dos Ventos 3
HPU Jirau
Location
(State)
Installed
Capacity
(MW)
Assured Energy
(MW Average)
Eletronorte (24.5%)
Chesf (24.5%)
MT
261.0
154.9
Eletronorte (49%)
AP
23.3
RN
Eletrobras
Companies (%)
Generated Energy
MWh
1Q16
2Q16
Beginning of
Operation
End of
Concession
319,240
234,471
Aug/11
Jul/42
21.0
-
-
Jun/08
May/37
68.5
22.8
26
40
jul/14 (2)
Aug/45
RN
58.5
21.9
29
35
jul/14 (2)
Dec/45
RN
60.1
21.1
29
37
jul/14 (2)
Dec/45
MT
3,150.0
2,205.1
3,652,694
3,160,404
Aug/11
Jul/42
Chesf (15%)
Eletronorte (19.98%)
Eletrobras Holding
(15%)
PA
1,258.9
4,571.0
-
1,100,654
abr/16
Aug/45
Eletronorte (24.5%)
Furnas (24.5%)
Eletronorte (24.5%)
Furnas (24.5%)
Eletronorte (24.5%)
Furnas (24.5%)
Chesf (20%)
Eletrosul (20%)
Norte Energia S.A. (4)
HPU B. Monte
Pedra Branca S.A.
Pedra Branca
São Pedro do
Lago
Sete
Gameleiras
WPP Baraúnas I
Chesf (49%)
PA
30.0
12.2
26,718
26,718
abr/16
Aug/45
Chesf (49%)
BA
30.0
13.5
28,908
28,908
Mar/13
Feb/46
Chesf (49%)
BA
30.0
12.6
27,375
27,375
Mar/13
Feb/46
Chesf (49%)
BA
32.9
12.4
17,312
17,312
Mar/13
Feb/46
WPP Mussambê
WPP Morro
Branco I
WPP Banda de
Couro
WPP Baraunas
II
Chesf (49%)
BA
32.9
12.0
16,942
16,942
Oct/15
Apr/49
Chesf (49%)
BA
32.9
12.9
16,388
16,388
Oct/15
Apr/49
Chesf (49%)
BA
29.7
12.9
5,360
5,360
Oct/15
Apr/49
Chesf (1.76%)
BA
21.6
7.8
4,540
4,540
Mar/16
Jul/49
Chesf (1.56%)
BA
29.6
14.8
15,004
29,973
Mar/16
Jul/49
São Pedro do Lago S.A.
Sete Gameleiras S.A.
Baraúnas I Energética S.A.
Mussambê Energética S.A.
Morro Branco I Energética
S.A.
Banda de Couro
Energética S.A.
Baraúnas II Energética
S.A.
V. de Santa Joana IX
Energia Renováveis S.A.
(5)
Santa Joana IX
103
Marketletter 2Q16
V. de Santa Joana X
Energia Renováveis S.A.
(5)
V. de Santa Joana XI
Energia Renováveis S.A.
(5)
V. de Santa Joana XII
Energia Renováveis S.A.
(5)
V. de Santa Joana XIII
Energia Renováveis S.A.
(5)
V. de Santa Joana XV
Energia Renováveis S.A.
(5)
V. de Santa Joana XVI
Energia Renováveis S.A.
(5)
V. de Santa Joana I
Energia Renováveis S.A.
(6)
V. de Santa Joana III
Energia Renováveis S.A.
(6)
V. de Santa Joana IV
Energia Renováveis S.A.
(6)
V. de Santa Joana V
Energia Renováveis S.A.
(6)
V. de Santa Joana VII
Energia Renováveis S.A.
(6)
V. de Santo Augusto IV
Energia Renováveis S.A.
(6)
U.E.E. Caiçara I S.A. (7)
Santa Joana X
Chesf (49%)
PI
29.6
15.5
16,105
30,973
Aug/15
Aug/35
Santa Joana XI
Chesf (49%)
PI
29.6
16.0
16,632
29,127
Jul/15
Aug/35
Santa Joana
XII
Chesf (49%)
PI
28.9
17.4
22,752
34,464
Jul/15
Aug/35
Santa Joana
XIII
Chesf (49%)
PI
29.6
16.2
17,242
30,148
Jul/15
Aug/35
Santa Joana XV
Chesf (49%)
PI
28.9
17.3
21,221
34,571
Jul/15
Aug/35
Santa Joana
XVI
Chesf (49%)
PI
28.9
17.8
20,567
35,422
Jul/15
Aug/35
WPP Santa
Joana I
Chesf (49%)
PI
28.9
14.7
20,320
20,690
Jul/15
Aug/35
WPP Santa
Joana III
Chesf (49%)
PI
29.6
14.3
25,084
14,779
Jan/16
Dec/35
WPP Santa
Joana IV
Chesf (49%)
PI
28.9
14.2
17,474
24,787
Mar/16
Dec/35
WPP Santa
Joana V
Chesf (49%)
PI
28.9
14.1
18,897
26,088
Jan/16
Dec/35
WPP Santa
Joana VII
Chesf (49%)
PI
27.2
14.8
22,109
26,604
Jan/16
Dec/35
WPP Santo
Augusto IV
Chesf (49%)
PI
28.9
15.7
22,832
25,627
Jan/16
Dec/35
WPP Caiçara I
Chesf (49%)
PI
27.0
15.1
21,296
27,246
Feb/16
Dec/35
U.E.E. Caiçara II S.A. (7)
WPP Caiçara II
Chesf (49%)
RN
18.0
9.6
14,553
18,624
Nov/15
Jun/47
U.E.E. Junco I S.A. (7)
WPP Junco I
Chesf (49%)
RN
24.0
13.1
17,963
23,150
Nov/15
Jul/47
U.E.E. Junco II S.A (7)
Eólica Serra das Vacas I
S.A. (8)
Eólica Serra das Vacas II
S.A. (8)
Eólica Serra das Vacas III
S.A. (8)
WPP Junco II
Serra das
Vacas I
Serra das
Vacas II
Serra das
Vacas III
Chesf (49%)
RN
24.0
13.3
18,428
22,754
Nov/15
Jul/47
Chesf (49%)
RN
23.9
12.2
22,908
23,517
Nov/15
Jul/47
Chesf (49%)
PE
22.3
9.9
17,359
18,310
Dec/15
Jun/49
Chesf (49%)
PE
22.2
11.0
20,989
19,545
Dec/15
Jun/49
104
Marketletter 2Q16
Eólica Serra das Vacas IV
S.A. (8)
Enerpeixe S.A.
Baguari Geração de
Energia S.A.
Retiro Baixo Energética
S.A.
Foz de Chapecó Energia
S.A.
Serra do Facão Energia
S.A.
Madeira Energia S.A.
Tijoá Participações e
Investimentos S.A.
Teles Pires Participações
S.A.
Eólica Livramento S.A.
(12)
Santa Vitória do Palmar
S.A.
Eólica –Chuí Holding S.A.
Hermenegildo I S.A.
Hermenegildo II S.A.
Hermenegildo III S.A.
Chuí IX S.A.
Serra das
Vacas IV
HPU Peixe
Angical
HPU Baguari
HPU Retiro
Baixo
HPU Foz de
Chapecó
HPU Serra do
Facão
HPU Santo
Antônio (9)
HPU Três
Irmãos (10)
HPU Teles Pires
(11)
Wind Farms de
Cerro Chato IV,
V, VI,
Ibirapuitã and
Trindade
Wind Farms
Geribatu I to X
Wind Farms
Chuí I to V, and
Minuano I and
II
Wind Farms
Verace 24 to 27
Wind Farms
Verace 28 to 31
Wind Farms
Verace 34 to 36
Wind Farm
Chuí 09
Chesf (49%)
PE
22.3
10.5
20,290
20,076
Dec/15
Jun/49
Furnas (40%)
TO
498.8
280.5
-
-
Jun/06
Nov/36
Furnas (15%)
MG
140.0
80.0
5,215
28,848
Sep/09
Aug/41
Furnas (49%)
MG
82.0
38.5
83,611
-
Mar/10
Aug/41
Furnas (40%)
RS/SC
855.0
432.0
-
1,206,771
Oct/10
Nov/36
Furnas (49.5%)
GO
212.6
182.4
113,508
106,671
Jul/10
Nov/36
Furnas (39%)
RO
3,150.4
2,218.0
3,468,985
3,634,245
Mar/12
Jun/43
Furnas (49.9%)
SP
807.5
217.5
-
-
Oct/14
Sep/44
PA/MT
727.9
567.4
-
-
Nov/15
Jun/46
Eletrosul (59%)
RS
25.2
30.1
16,219
20,504
Nov/13
Mar/47
Eletrosul (49%)
RS
258.0
109.2
175,256
191,250
Feb/15
Apr/47
Eletrosul (49%)
RS
144.0
59.9
93,512
102,236
May/15
Apr/47
Eletrosul (99.99%)
RS
57.3
24.9
45,226
179,954
Nov/15
Jun/49
Eletrosul (99.99%)
RS
57.3
25.3
40,525
45,516
Dec/15
Jun/49
Eletrosul (99.99%)
RS
48.3
21.0
27,811
37,836
Dec/15
Jun/49
Eletrosul (99.99%)
RS
17.9
7.4
12,793
14,145
Oct/15
May/49
Furnas (24.5%)
Eletrosul (24.72%)
(1) The plant is dead since 07.04.2014. The Data Collection System - SCD has been disabled.
(2) Decision obtained through a writ of mandamus with an injunction.
(3) The first turbine began operating in Sep / 2013 with 75MW of installed capacity. In the second quarter 2016 the company totaled 42 machines in operation, resulting in an installed capacity of 3,150 MW in operation, of a total capacity of 3,750 MW. Increased physical guarantee of UHE
Jirau due to revision of the hydraulic loss, as MME Ordinance No. 337 of 11.10.2015.
(4) 04 generating units in commercial operation totaling 1258.9 MW in commercial operation, of a total capacity of 11,233.1 MW.
(5) The participation of SPEs V. Santa Joana IX, X, XI, XII, XIII, XIV and XV Energia Renováveis S.A.were merged into the Chapada company Piaui I Holding S.A.
(6) The participation of SPEs V. Santa Joana I, III, IV, V, VII and Santo Augusto IV Energia Renováveis S.A.were merged into the Chapada company Piaui II Holding S.A.
(7) The shares of the SPEs WPP Caiçara I S.A., WPP Caiçara II S.A., WPP Junco I S.A. and WPP Junco II S.A. were merged into the company Vamcruz Participacoes S.A.
(8) The participation of SPEs were merged into the company Serra das Vacas Holding S.A.
(9) 44 units (out of 50) in operation to the 2T16, totaling 3,150.43 MW of a total power of 3,568 MW. Physical guarantee corresponds to GU in operation.
(10) The granting of HPP Three Brothers, owned by CESP and won in Nov/2011 was not renewed under the terms of Law No. 12,783/2013. In Auction No. 002/2014 - ANEEL, held on 03.28.2014, the FURNAS consortium (49.9%) and FIP CONSTANTINOPLE (50.1%) was crowned winner in
the competition for granting of concession of UHE Three Brothers, upon the proposal of hiring of electricity generation service, at the lowest cost of generation Assets Management (GAG), including operating costs, maintenance, management, compensation and amortization of the
hydroelectric plant, where appropriate, under what regime in art. 8 of Law No. 12,783 of 01.11.2013, a period of 30 years from the effective date of its Concession Agreement, which was signed on 09.10.2014.
(11) 2 units (out of 5) in operation to the 1T16, totaling 727.92 MW, for a total capacity of 1819.8 MW. Physical guarantee corresponds to GU in operation.
(12) In 25.2 MW commercial operation of a total of 79.2 MW, corresponding to Ibirapuitã park. The Aneel Order 3,373 of October 2, 2015, temporarily suspended the commercial operation of the other parks.
105
Marketletter 2Q16
XI.1.1.2 Energy Sold
SPE
EAPSA - Energia Águas Da Pedra S.A.
Eletrobras Companies (%)
Eletronorte (24.5%)
Chesf (24.5%)
Buyer
Eletrobras System
Others
Eletrobras System
Amapari Energia S.A.
Eletronorte (49%)
Others
Brasventos Miassaba 3 Geradora de Energia S.A
Brasventos Eolo Geradora de Energia S.A.
Rei dos Ventos 3 Geradora de Energia S.A.
ESBR Participações S.A.
Norte Energia S.A.
Eletronorte (24.5%)
Furnas (24.5%)
Eletronorte (24.5%)
Furnas (24.5%)
Eletronorte (24.5%)
Furnas (24.5%)
Chesf (20%)
Eletrosul (20%)
Chesf (15%)
Eletronorte (19.98%)
Eletrobras Holding (15%)
Eletrobras System
Others
Eletrobras System
Others
Eletrobras System
Others
Eletrobras System
Others
Eletrobras System
Others
Eletrobras System
Pedra Branca S.A.
Chesf (49%)
Others
Eletrobras System
São Pedro do Lago S.A.
Chesf (49%)
Others
Sete Gameleiras S.A.
Chesf (49%)
Eletrobras System
106
Sell Type
1Q16
R$ million
2Q16
MWh
R$ million
MWh
A
B
A
B
A
B
A
B
A
B
A
B
A
B
A
B
A
B
A
B
A
B
A
B
A
B
62.00
5.70
6.30
6.30
63.19
101.06
356.70
171.75
-
332,274
26.40
28.92
28.64
532,234.59
470,194.52
2,981,697.64
799,077.83
-
60.00
8.60
7.70
8.20
65.09
101.02
337.18
136.29
-
314,225.32
39.80
35.32
37.34
584,458.95
469,979.33
2,832,908.02
634,084.75
-
A
-
-
98.05
880,523.52
B
A
B
A
B
A
B
A
B
A
2.76
2.13
2.98
2.30
2.82
15,078.18
11,639.81
16,314.09
12,594.23
15,448.95
2.76
2.13
2.98
2.30
2.82
15,078.18
11,639.81
16,314.09
12,594.23
15,448.95
Marketletter 2Q16
Others
Eletrobras System
Baraúnas I Energética S.A.
Chesf (49%)
Others
Eletrobras System
Mussambê Energética S.A.
Chesf (49%)
Others
Eletrobras System
Morro Branco I Energética S.A.
Chesf (49%)
Others
Eletrobras System
Banda de Couro Energética S.A.
Chesf (49%)
Others
Eletrobras System
Baraúnas II Energética S.A.
Chesf (1.76%)
Others
Eletrobras System
V. de Santa Joana IX Energia Renováveis S.A.
Chesf (1.56%)
Others
Eletrobras System
V. de Santa Joana X Energia Renováveis S.A.
Chesf (49%)
Others
Eletrobras System
V. de Santa Joana XI Energia Renováveis S.A.
Chesf (49%)
Others
Eletrobras System
V. de Santa Joana XII Energia Renováveis S.A.
Chesf (49%)
Others
V. de Santa Joana XIII Energia Renováveis S.A.
Chesf (49%)
Eletrobras System
Others
107
B
A
B
A
B
A
B
A
B
A
B
A
B
A
B
A
B
A
B
A
B
A
B
A
B
A
B
A
B
A
B
A
B
A
B
A
B
A
B
A
B
A
2.18
3.16
3.13
3.24
0.09
0.70
0.07
0.59
3.70
3.81
3.95
4.29
3.76
-
11,926.05
23,396.00
23,150.09
23,992.40
576.25
4,784.18
488.10
4,052.38
28,842.00
29,716.00
30,808.50
33,430.50
29,279.00
-
2.18
3.16
3.13
3.24
0.09
0.70
0.07
0.59
3.70
3.81
3.95
4.29
3.75
-
11,926.05
23,396.00
23,150.09
23,992.40
576.25
4,784.18
488.10
4,052.38
28,828.80
29,702.40
30,794.40
33,415.20
29,265.60
-
Marketletter 2Q16
Eletrobras System
V. de Santa Joana XV Energia Renováveis S.A.
Chesf (49%)
Others
Eletrobras System
V. de Santa Joana XVI Energia Renováveis S.A.
Chesf (49%)
Others
Eletrobras System
V. de Santa Joana I Energia Renováveis S.A.
Chesf (49%)
Others
Eletrobras System
V. de Santa Joana III Energia Renováveis S.A.
Chesf (49%)
Others
Eletrobras System
V. de Santa Joana IV Energia Renováveis S.A.
Chesf (49%)
Others
Eletrobras System
V. de Santa Joana V Energia Renováveis S.A.
Chesf (49%)
Others
Eletrobras System
V. de Santa Joana VII Energia Renováveis S.A.
Chesf (49%)
Others
Eletrobras System
V. de Santo Augusto IV Energia Renováveis S.A.
Chesf (49%)
Others
Eletrobras System
U.E.E. Caiçara I S.A.
Chesf (49%)
Others
Eletrobras System
U.E.E. Caiçara II S.A.
Chesf (49%)
Others
U.E.E. Junco I S.A.
Chesf (49%)
Eletrobras System
108
B
A
B
A
B
A
B
A
B
A
B
A
B
A
B
A
B
A
B
A
B
A
B
A
B
A
B
A
B
A
B
A
B
A
B
A
B
A
B
A
B
A
B
4.20
4.29
4.27
3.89
4.12
4.09
4.30
4.47
4.31
0.53
2.97
0.10
-
32,775.00
33,430.50
31,766.70
28,957.40
30,686.20
30,470.10
31,982.80
33,279.40
29,497.50
2,202.62
20,327.06
439.45
-
4.20
4.29
5.04
4.89
4.87
4.83
5.07
5.32
4.31
0.25
2.97
0.05
-
32,760.00
33,415.20
32,104.80
31,231.20
31,012.80
30,794.40
32,323.20
34,288.80
29,484.00
912.62
20,317.75
167.79
-
Marketletter 2Q16
Others
Eletrobras System
U.E.E. Junco II S.A
Chesf (49%)
Others
Eletrobras System
Eólica Serra das Vacas I S.A.
Chesf (49%)
Others
Eletrobras System
Eólica Serra das Vacas II S.A.
Chesf (49%)
Others
Eletrobras System
Eólica Serra das Vacas III S.A.
Chesf (49%)
Others
Eletrobras System
Eólica Serra das Vacas IV S.A.
Chesf (49%)
Others
Eletrobras System
Enerpeixe S.A.
Furnas (40%)
Others
Eletrobras System
Baguari Geração de Energia S.A.
Furnas (15%)
Others
Eletrobras System
Retiro Baixo Energética S.A.
Furnas (49%)
Others
Eletrobras System
Foz de Chapecó Energia S.A.
Furnas (40%)
Others
Serra do Facão Energia S.A.
Furnas (49.5%)
Eletrobras System
Others
109
A
B
A
B
A
B
A
B
A
B
A
B
A
B
A
B
3.89
0.32
3.65
0.62
3.90
3.16
0.05
-
26,442.87
1,335.70
24,911.19
2,568.13
26,657.00
21,631.50
1,166.00
-
3.89
0.15
3.65
0.28
3.90
3.15
0.03
-
26,430.77
560.78
24,899.78
1,039.79
26,644.80
21,621.60
375.00
-
A
3.77
25,764.20
3.52
24,024.00
B
A
B
A
B
A
B
0.02
3.72
0.04
-
563.00
25,392.20
971.00
-
0.00
3.36
0.02
-
70.00
22,932.00
260.00
-
A
-
-
-
-
B
A
16.92
86,464.12
16.14
80,425.51
B
-
-
-
-
A
B
A
B
A
B
A
B
A
B
A
B
A
16.30
0.50
57.85
83,445.95
2,185.00
277,344.48
117.77
86.17
92.85
549,238.70
377,395.20
260,010.62
Marketletter 2Q16
Eletrobras System
Madeira Energia S.A.
Furnas (39%)
Others
Eletrobras System
Tijoá Participações e Investimentos S.A.
Furnas (49.9%)
Others
Teles Pires Participações S.A.
Furnas (24.5%)
Eletrosul (24.72%)
Eletrobras System
Others
Eletrobras System
Eólica Livramento S.A.
Eletrosul (59%)
Others
Eletrobras System
Santa Vitória do Palmar S.A.
Eletrosul (49%)
Others
Eletrobras System
Eólica –Chuí Holding S.A.
Eletrosul (49%)
Others
Eletrobras System
Hermenegildo I S.A.
Eletrosul (99.99%)
Others
Eletrobras System
Hermenegildo II S.A.
Eletrosul (99.99%)
Others
Eletrobras System
Hermenegildo III S.A.
Eletrosul (99.99%)
Others
Eletrobras System
Chuí IX S.A.
Eletrosul (99.99%)
Others
A - Energy sales in the regulated enviroment - revenues from quotas..
B - Through contracts on the open market or bilateral agreements.
110
B
A
B
A
B
A
B
A
B
A
B
A
B
A
B
A
B
A
B
A
B
A
B
A
B
A
B
A
B
A
B
A
B
A
B
A
B
A
B
A
B
27.30
429.37
279.70
-
124,827.00
3,467,135.93
1,365,312.40
-
32.96
417.88
333.32
-
150,696.00
3,293,109.46
1,530,957.77
-
2.13
23.30
13.00
2.32
6.32
2.53
6.13
2.16
5.06
0.75
1.78
-
16,219.23
175,256.37
93,511.50
15,513.50
42,389.00
1.00
16,824.50
41,296.50
14,421.00
34,086.00
5,025.50
12,017.50
1.00
2.70
25.42
14.21
2.32
6.31
2.00
2.53
6.13
2.16
5.05
0.75
1.78
2.00
20,504.28
191,250.00
102,235.89
15,506.40
42,369.60
3.00
16,816.80
41,277.60
14,414.40
34,070.40
5,023.20
12,012.00
3.00
Marketletter 2Q16
XI.1.1.3 Average Rate – R$/MWh
SPE
Eletrobras Companies (%)
EAPSA - Energia Águas Da Pedra S.A.
Amapari Energia S.A.
Brasventos Miassaba 3 Geradora de Energia S.A
Brasventos Eolo Geradora de Energia S.A.
Rei dos Ventos 3 Geradora de Energia S.A.
ESBR Participações S.A.
Norte Energia S.A
Pedra Branca S.A.
São Pedro do Lago S.A.
Sete Gameleiras S.A.
Baraúnas I Energética S.A.
Mussambê Energética S.A.
Eletronorte (24.5%)
Chesf (24.5%)
Eletronorte (49%)
Eletronorte (24.5%)
Furnas (24.5%)
Eletronorte (24.5%)
Furnas (24.5%)
Eletronorte (24.5%)
Furnas (24.5%)
Chesf (20%)
Eletrosul (20%)
Chesf (15%)
Eletronorte (19.98%)
Eletrobras Holding (15%)
Chesf (49%)
Chesf (49%)
Chesf (49%)
Chesf (49%)
Chesf (49%)
1Q16
2Q16
186.57
191.85
0.00
0.00
217.22
217.22
218.22
218.22
218.65
218.65
144.82
141.45
34.81
111.35
182.80
182.80
182.80
135.09
135.09
182.80
182.80
182.80
135.09
135.09
Morro Branco I Energética S.A.
Chesf (49%)
135.09
135.09
Banda de Couro Energética S.A.
Chesf (49%)
147.92
147.92
Chesf (1.76%)
Chesf (1.56%)
Chesf (49%)
Chesf (49%)
Chesf (49%)
Chesf (49%)
Chesf (49%)
Chesf (49%)
Chesf (49%)
Chesf (49%)
Chesf (49%)
Chesf (49%)
Chesf (49%)
145.72
128.28
128.28
128.28
128.28
128.28
128.28
128.28
134.31
134.31
134.31
134.31
134.31
145.72
128.28
128.28
128.28
128.28
128.28
128.28
128.28
157.11
156.67
156.89
156.85
156.88
Baraúnas II
V. de Santa
V. de Santa
V. de Santa
V. de Santa
V. de Santa
V. de Santa
V. de Santa
V. de Santa
V. de Santa
V. de Santa
V. de Santa
V. de Santa
Energética S.A.
Joana IX Energia Renováveis S.A.
Joana X Energia Renováveis S.A.
Joana XI Energia Renováveis S.A.
Joana XII Energia Renováveis S.A.
Joana XIII Energia Renováveis S.A.
Joana XV Energia Renováveis S.A.
Joana XVI Energia Renováveis S.A.
Joana I Energia Renováveis S.A.
Joana III Energia Renováveis S.A.
Joana IV Energia Renováveis S.A.
Joana V Energia Renováveis S.A.
Joana VII Energia Renováveis S.A.
111
Marketletter 2Q16
V. de Santo Augusto IV Energia Renováveis S.A.
WPP Caiçara I S.A.
WPP Caiçara II S.A.
Chesf (49%)
Chesf (49%)
Chesf (49%)
134.31
146.27
146.17
155.25
146.27
146.17
WPP Junco I S.A.
WPP Junco II S.A.
Eólica Serra das Vacas I S.A.
Eólica Serra das Vacas II S.A.
Eólica Serra das Vacas III S.A.
Chesf
Chesf
Chesf
Chesf
Chesf
(49%)
(49%)
(49%)
(49%)
(49%)
147.29
146.55
146.24
151.57
149.71
147.29
146.55
146.28
148.91
147.98
Chesf (49%)
Furnas (40%)
Furnas (15%)
Furnas (49%)
Furnas (40%)
Furnas (49.5%)
Furnas (39%)
Furnas (49.9%)
Furnas (24.5%)
Eletrosul (24.72%)
Eletrosul (59%)
Eletrosul (49%)
Eletrosul (49%)
Eletrosul (99.99%)
Eletrosul (99.99%)
Eletrosul (99.99%)
Eletrosul (99.99%)
151.10
0.00
195.66
195.28
224.49
211.74
146.73
149.06
0.00
200.68
0.00
220.09
215.90
155.72
131.61
132.93
138.97
149.16
148.98
148.75
148.75
131.61
132.93
138.97
149.16
148.98
148.75
148.75
Eólica Serra das Vacas IV S.A.
Enerpeixe S.A.
Baguari Geração de Energia S.A.
Retiro Baixo Energética S.A.
Foz de Chapecó Energia S.A.
Serra do Facão Energia S.A.
Madeira Energia S.A.
Tijoá Participações e Investimentos S.A.
Teles Pires Participações S.A.
Eólica Livramento S.A.
Santa Vitória do Palmar S.A.
Eólica –Chuí Holding S.A.
Hermenegildo I S.A.
Hermenegildo II S.A.
Hermenegildo III S.A.
Chuí IX S.A.
112
Marketletter 2Q16
XI.1.2 Transmission
XI.1.2.1 Operational Asset
XI.1.2.1.1 Transmission Lines
SPE
AETE - Amazônia Eletronorte Transmissora de
Energia S.A.
INTESA - Integração Transmissora de Energia
S.A.
BRASNORTE Transmissora de Energia S.A.
Transmissora Matogrossense de Energia S.A.
– TME
Manaus Transmissora de Energia S.A.
Norte Brasil Transmissora de Energia S.A.
Sistema de Transmissão do Nordeste S.A.
Interligação Elétrica do Madeira S.A.
Interligação Elétrica Garanhuns S.A.
Extremoz Transmissora do Nordeste –ETN
S.A.
From - To
Coxipó-Cuiabá-Rondonópolis
(MT), SS Portioning Cuiabá
Colinas-Miracema-GurupiPeixe Nova-Serra da Mesa 2
(TO/GO)
Jauru - Juba – C2 (MT) and
Maggi - Nova Mutum (MT),
SS Juba and SS Maggi 230/138 kV
TL Jauru / Cuiabá, em 230
kV, Mato Grosso
Oriximiná - Silves - Lechuga
(AM), SS Silves (exItacoatiara) and SS Lechuga
(ex-Cariri)
Collector Porto Velho (RO) Araraquara (SPE)
Teresina II/PI-Sobral III/CE;
Teresina II/PI-Fortaleza
II/CE;
Sobral III/CE-Fortaleza II/CE
TL Collector Porto Velho/
Araraquara II, CS
L.Gonzaga/Garanhuns II;
Garanhuns II/Campina
Grande III;
Garanhuns II/Pau Ferro;
Garanhuns II/Angelim I
TL Ceará Mirim/João Câmara
II
TL Ceará Mirim/ Extremoz II
TL Ceará Mirim/ Campina III,
500 kV
TL Campina Grande
III/Campina Grande II, 230
kV
Eletrobras
Companies (%)
Extension (km)
Tension (kV)
Beginning of
Operation
End of Concession
Eletronorte (49%)
193
230
Aug/05
Feb/34
Eletronorte (37%)
Chesf (12%)
695
500
May/08
Apr/36
Eletronorte (49.71%)
402
230
Sep/09
Mar/38
Eletronorte (49%)
348
500
Nov/11
Nov/39
Eletronorte (30%)
Chesf (19.5%)
559
500
Mar/13
Oct/38
Eletronorte (49%)
2411.9
600
Nov/14
Feb/39
546
500
Jan/06
Feb/34
2375
600
Aug/13
Feb/39
Chesf (49%)
224
190
239
13
500
500
500
230
Nov/15
Nov/15
Dec/15
Mar/16
Dec/41
Chesf (100%)
64
26
201
8,5
500
230
500
230
Oct/14
Oct/14
May/15
May/15
Oct/41
Chesf (49%)
Chesf (24.5%)
Furnas (24.5%)
113
Marketletter 2Q16
Baguari Energia S.A.
HPU Baguari - SS Baguari
Furnas (15%)
0.8
230
Feb/10
Aug/41
Baguari Energia S.A.
SS Baguari - Mesquita –
Governador Valadares
Furnas (15%)
2.5
230
Apr/10
Aug/41
Baguari Energia S.A.
SS Baguari – Mesquita
Furnas (15%)
69
230
Apr/10
Aug/41
Baguari Energia S.A.
SS Baguari - Gov. Valadares
Furnas (15%)
26
230
Apr/10
Aug/41
Centroeste de Minas
Furnas – Pimenta II
Furnas (49%)
62.7
345
Mar/10
Mar/35
Chapecoense Geração S.A.
SS Foz do Chapecó – Gurita
SS Foz do Chapecó – SS
Xanxerê
HPU Foz do Chapecó – SS de
Foz do Chapecó
Furnas (40%)
72.6
230
Mar/11
Nov/36
Furnas (40%)
77.6
230
Mar/11
Nov/36
Furnas (40%)
1
230
Mar/11
Nov/36
Enerpeixe S.A.
Peixe Angical – Peixe 2
Furnas (40%)
17
500
Apr/06
Nov/36
Goiás Transmissão S.A.
Rio Verde Norte – Trindade
Furnas (49%)
193
500
Dec/13
Jul/40
Goiás Transmissão S.A.
Trindade – Xavantes
Furnas (49%)
37
230
Dec/13
Jul/40
Goiás Transmissão S.A.
Trindade – Carajás
Furnas (49%)
29
230
Oct/13
Jul/40
MGE Transmissão S.A.
Mesquita - Viana 2
Furnas (49%)
248
500
Jun/14
Jul/40
MGE Transmissão S.A.
Furnas (49%)
10
345
Jun/14
Jul/40
Furnas (49%)
45
138
Oct/10
Aug/41
Furnas (49.5%)
32
138
Oct/10
Nov/36
Furnas (49%)
52.3
230
Apr/11
Apr/39
Furnas (49%)
34.4
138
May/11
Jun/25
Transenergia Renovável S.A.
Viana 2 – Viana
HPU Retiro Baixo – SS
Curvelo
HPU Serra do Facão – SS
Celg de Catalão
Barra dos Coqueiros –
Quirinópolis
Quirinópolis - TPU
Quirinópolis
Quirinópolis - TPU Boavista
Furnas (49%)
16.7
138
May/11
Jun/25
Transenergia Renovável S.A.
Chapadão – Jataí
Furnas (49%)
131.5
230
Dec/12
Apr/39
Transenergia Renovável S.A.
Jataí – Mineiros
Furnas (49%)
61.4
138
Dec/12
Jun/25
Transenergia Renovável S.A.
Jataí - TPU Jataí
Furnas (49%)
51.2
138
Dec/12
Jun/25
Transenergia Renovável S.A.
Jataí - TPU Água Emendada
Furnas (49%)
32.6
138
Dec/12
Jun/25
Transenergia Renovável S.A.
Mineiros - Morro Vermelho
Morro Vermelho - TPU Morro
Vermelho
Morro Vermelho - TPU Alto
Taquari
Palmeiras – Edéia
Edéia - TPU Tropical
Bionenergia I
Irapé – Araçuaí
Furnas (49%)
45.2
138
Dec/12
Jun/25
Furnas (49%)
31
138
Dec/12
Jun/25
Furnas (49%)
30.2
138
Jun/13
Jun/25
Furnas (49%)
57
230
May/13
Apr/39
Furnas (49%)
48.7
138
May/13
Jun/25
65
230
May/07
Mar/35
Chapecoense Geração S.A.
Chapecoense Geração S.A.
Retiro Baixo Energética S.A.
Serra do Facão Energia S.A.
Transenergia Renovável S.A.
Transenergia Renovável S.A.
Transenergia Renovável S.A.
Transenergia Renovável S.A.
Transenergia Renovável S.A.
Transenergia Renovável S.A.
Transirapé
Furnas (24.5%)
114
Marketletter 2Q16
Transleste
Montes Claros – Irapé
Furnas (24.5%)
138
345
Dec/06
Feb/34
Transudeste
Itutinga – Juiz de Fora
Furnas (25%)
140
345
Feb/07
Mar/35
Transenergia Goiás S.A.
Niquelândia - Barro Alto
Barra da Tijuca – SS
Olímpica;
Gardênia – SS Olímpica
Furnas (49.9%)
Luziânia - Pirapora II
Energia Olímpica S.A.
Energia Olímpica S.A.
Paranaíba Transmissora de Energia S.A.
Vale do São Bartolomeu Transmissora de
Energia S.A.
Samambaia - Brasília Sul
Furnas (99%)
88
230
May/16
Nov/39
10.8
138
May/15
n/a
Furnas (49.9%)
2.9
138
May/15
n/a
Furnas (24.5%)
350
500
May/16
May/43
14
345
May/16
Oct/43
Eletrosul (27.42%)
188
230
Jul/05
Dec/32
Furnas (39%)
Uirapuru
Campos Novos (SC) – Barra
Grande (SC) – Lagoa
Vermelha (RS) – Santa Marta
(RS)
Ivaiporã (PR) – Londrina (PR)
Eletrosul (75%)
120
525
Jul/06
Mar/35
Transmissora Sul Brasileira de Energia – TSBE
Salto Santiago – Itá
Eletrosul (80%)
188
525
Feb/14
May/42
Transmissora Sul Brasileira de Energia – TSBE
Itá – Nova Santa Rita
Eletrosul (80%)
307
525
Aug/14
Jan/00
Transmissora Sul Brasileira de Energia – TSBE
Nova Santa Rita – Camaquã
Eletrosul (80%)
121
230
Dec/14
Jan/00
Transmissora Sul Brasileira de Energia – TSBE
Camaquã – Quinta
Cascavel Oeste – Umuarama,
CS
Povo Novo – Marmeleiro, CS
Nova santa Rita – Povo Novo,
CS
Marmeleiro – Santa Vitória do
Palmar
Eletrosul (80%)
167
230
Dec/14
Jan/00
Eletrosul (49%)
151.5
230
Aug/14
Jan/42
Eletrosul (51%)
152
525
Dec/14
Aug/42
Eletrosul (51%)
268
525
Apr/15
Jan/00
Eletrosul (51%)
48
525
Dec/14
Jan/00
Curitiba/Curitiba Leste (PR)
Eletrosul (20%)
29.04
525
Jun/15
May/42
Etau
Costa Oeste
Transmissora Sul Litorânea de Energia - TSLE
Transmissora Sul Litorânea de Energia - TSLE
Transmissora Sul Litorânea de Energia - TSLE
Marumbi Transmissora de Energia S.A.
XI.1.2.1.2 Substations
SPE
AETE - Amazônia Eletronorte
Transmissora de Energia S.A.
BRASNORTE Transmissora de Energia
S.A.
Manaus Transmissora de Energia S.A.
Substation
SS Portioning Cuiabá
SS
SS
SS
SS
Juba
Maggi - 230/138 kV
Silves (ex-Itacoatiara)
Lechuga (ex-Cariri)
Eletrobras Companies (%)
Eletronorte (49%)
Eletronorte (49.71%)
Eletronorte (30%)
Chesf (19.5%)
115
Transformation
Capacity - MVA
Beginning of
Operation
End of Concession
n/a
Aug/05
Feb/34
Sep/09
Mar/38
Mar/13
Oct/38
300
100
150
1,800
Marketletter 2Q16
INTESA - Integração Transmissora de
Energia S.A.
Transmissora Matogrossense de
Energia S.A. – TME
SS Peixe 2
SS Serra da Mesa 2
Eletronorte (37%)
Chesf (12%)
n/a
May/08
Apr/36
SS Jauru 500/230 kV
Eletronorte (49%)
750
Nov/11
Nov/39
3,150
2,950
May/14
Feb/39
Luziânia Niquelândia Transmissora S.A.
Retifier Station CA/CC of 500 kV
to +/- 600 kV;
Inveter Station CC/CA de +/600 kV to 500 kV.
SS – Pecém II, de 500/230 kV;
SS – Aquiraz, de 230/69 kV
SS – Garanhuns, 500/230 kV
SS – Pau Ferro, 500/230 kV
SS – João Câmara II, 500/138
kV
SS – Ceará Mirim, 500/230 kV
SS – Campina Grande III,
500/230 kV
SS Luziânia
Luziânia Niquelândia Transmissora S.A.
SS Niquelândia
Energia Olímpica S.A.
SS Olímpica 138/13,8 kV
Furnas (49.9%)
120
May/15
n/a
Epansion of SS Corfumbá
Furnas (49%)
150
Jul/13
Jun/41
Baguari Energia S.A.
SS Baguari Plant
Furnas (15%)
155.6
Aug/06
Aug/41
Chapecoense Geração S.A.
SS Foz do Chapecó Plant
Furnas (40%)
978
Nov/01
Nov/36
Enerpeixe S.A.
SS Peixe Angical Plant
Furnas (40%)
525
Nov/01
Nov/36
Goiás Transmissão S.A.
SS Trindade
Furnas (49%)
1,200
Nov/13
Jul/40
Madeira Energia S.A.
SS Santo Antônio Plant
Furnas (39%)
3,630
Aug/07
Jun/43
MGE Transmissão S.A.
Viana 2
Furnas (49%)
900
Aug/14
Jul/40
Retiro Baixo Energética S.A.
SS Retiro Baixo Plant
Furnas (49%)
100
Aug/06
Aug/41
Serra do Facão Energia S.A.
SS Serra do Facão Plant
236.4
Nov/01
Nov/36
Transenergia Renovável S.A
Edéia
Furnas (49%)
150
Feb/12
Jun/25
Transenergia Renovável S.A
Jataí
Furnas (49%)
450
Dec/12
Jun/25
Transenergia Renovável S.A
Mineiros
Furnas (49%)
0
Dec/12
Jun/25
Transenergia Renovável S.A
Morro Vermelho
Furnas (49%)
0
Dec/12
Jun/25
Transenergia Renovável S.A
Quirinópolis
Furnas (49%)
225
Apr/11
Jun/25
Transenergia Renovável S.A
Itatiba
Furnas (49%)
800
Aug/12
Nov/39
Furnas (24.5%)
3,150
May/14
Feb/39
Furnas (24.5%)
2,950
May/14
Feb/39
Interligação Elétrica do Madeira S.A.
TDG – Transmissora Delmiro Gouveia
S.A.
Interligação Elétrica Garanhuns S.A.
Extremoz Transmissora do Nordeste ETN S.A.
Caldas Novas Transmissão S.A.
(1)
Interligação Elétrica do Madeira S.A.
Interligação Elétrica do Madeira S.A.
Retifier Station CA/CC from 500
kV to +/- 600 kV
Inverter Station CC/CA from +/600 kV to 500 kV
Chesf (24.5%)
Furnas (24.5%)
3,600
450
600
1,500
Oct/13
Jul/40
Nov/15
Dec/15
Dec/41
Chesf (100%)
900
900
600
Oct/14
Oct/14
May/15
Oct/41
Furnas (49%)
225
Jun/14
May/42
Furnas (49%)
30
Aug/15
May/42
Chesf (49%)
Chesf (49%)
Furnas (49.5%)
116
Marketletter 2Q16
Etau
Lagoa Vermelha 2 230/138KV
Barra Grande 230/138 KV
(2)
Expansion of SS 525 KV Salto
Santiago;
Expansion of SS 525 kV Itá
Expansion of SS 525/230kV;
Nova Santa Rita;
Camaquã 3 230/69Kv ;
Expansion of SS 230 kV Quinta
Umuarama 230/138 kV
Transmissora Sul Brasileira de Energia
– TSBE
Costa Oeste
(3)
Transmissora Sul Litorânea de Energia
- TSLE
Marumbi Transmissora de Energia S.A.
150
-
Eletrosul (27.42%)
-
Eletrosul (80%)
166
Eletrosul (49%)
Povo Novo525/230 kV;
Santa Vitória do Palmar 525/138
kV;
Marmeleiro 525 kV – Synchrono
Compensator ±200 Mvar;
Expansion of SS Nova Santa Rita
525kV.
Eletrosul (51%)
Curitiba Leste - 525/230 KV
Eletrosul (20%)
300
672
75
-
Jul/05
Dec/32
Feb/14
Aug/14
Aug/14
Dec/14
Dec/14
May/42
Jul/14
Jan/42
Dec/14
Dec/14
Dec/14
Aug/42
Apr/15
672
Jun/15
May/42
(1) This project involves the expansion of SS Corumbá.
(2) Entrance lines and stations associated with TL Campos Novos - Santa Marta located at substations
(3) Commercial operation by sharing with Copel (TL Caiuá).
XI.2 Financing and Loans – R$ million
SPE
Belo Monte Transmissora de Energia
S.A
Energética Águas da Pedra S.A.
Norte Brasil Transmissora de Energia
S.A.
Manaus Transmissora de Energia
S.A.
Transmissora Matogrossense de
Energia S.A.
Eletrobras
Companies
(%)
Eletronorte
(24.5%)
Furnas
(24.5%)
Eletronorte
(24.5%)
Chesf
(24.5%)
Eletronorte
(49%)
Eletronorte
(30%)
Chesf
(19.5%)
Eletronorte
(49%)
BNDES (a)
Others Creditors (b)
2018
2019
2020
2021
2022
-
-
-
-
-
-
-
-
-
-
-
-
-
-
-
34.00
33.70
33.40
33.40
33.40
33.40
135.70
-
-
-
-
-
-
-
337.00
-
-
-
-
-
-
-
-
-
-
-
-
-
-
-
31.55
31.55
31.55
31.55
31.55
31.55
126.40
33.90
33.90
33.90
33.90
33.90
33.90
272.44
791.54
-
-
-
-
-
-
-
-
-
-
-
-
-
-
-
117
2017
2018
2019
2020
2021
2022
After
2022
Total
(a+b)
2017
After
2022
Marketletter 2Q16
Brasventos Eolo Geradora de Energia
S.A.
Brasventos Miassaba 3 Geradora de
Energia S.A.
Rei dos Ventos 3 Geradora de
Energia S.A.
Norte Energia S.A.
Sistema de Transmissão Nordeste
S.A.
Integração Transmissora de Energia
S.A
Eletronorte
(24.5%)
Furnas
(24.5%)
Eletronorte
(24.5%)
Furnas
(24.5%)
Eletronorte
(24.5%)
Furnas
(24.5%)
Eletronorte
(19.98%)
Chesf (15%)
Eletrobras
Holding
(15%)
-
-
-
24,233.00
22,185.00
-
-
24,396.00
22,334.00
-
-
-
-
-
25,539.00
23,381.00
-
-
-
-
193.88
436.20
540.58
612.56
612.56
Chesf (49%)
-
-
-
-
Chesf (12%)
30.92
30.92
30.92
123.00
123.00
17.04
-
-
-
-
-
-
-
46,418.00
-
-
-
-
-
-
-
46,730.00
-
-
-
-
-
-
-
48,920.00
612.56
11,544.66
85.33
266.75
361.67
418.21
418.21
418.21
7,980.79
24,502.16
-
-
-
10.43
21.42
22.53
23.71
18.25
13.50
21.35
131.19
26.25
-
-
-
-
-
-
-
-
-
-
119.01
123.00
123.00
123.00
123.00
702.70
20.00
40.30
58.30
71.80
76.30
80.80
379.70
2,167.90
32.34
32.34
32.34
32.34
32.34
117.83
-
-
-
-
-
-
-
296.56
-
-
-
-
-
-
3.00
4.00
4.00
5.00
6.00
7.00
136.00
165.00
308.92
308.92
314.68
314.68
314.68
314.68
3,790.98
313.66
313.66
313.66
313.66
313.66
313.66
3,837.18
11,386.70
-
Interligação Elétrica Garanhuns S.A.
Chesf
(24.5%)
Furnas
(24.5%)
Chesf (49%)
Transmissora Delmiro Gouveia S.A.
Chesf (49%)
ESBR Participações S.A.
São Pedro do Lago S.A.
Chesf (20%)
Eletrosul
(20%)
Chesf (49%)
5.05
5.05
5.05
5.05
5.05
5.05
34.51
-
-
-
-
-
-
-
64.81
Pedra Branca S.A.
Chesf (49%)
4.90
4.90
4.90
4.90
4.90
4.90
33.47
-
-
-
-
-
-
-
62.87
Sete Gameleiras S.A.
Chesf (49%)
4.91
4.91
4.91
4.91
4.91
4.91
33.59
-
-
-
-
-
-
-
63.05
Baraúnas I Energética S.A.
Chesf (49%)
4.48
4.48
4.48
4.48
4.48
4.48
41.38
-
-
-
-
-
-
-
68.26
Morro Branco I Energética S.A.
Chesf (49%)
4.95
4.95
4.95
4.95
4.95
4.95
50.70
-
-
-
-
-
-
-
80.40
Mussambê Energética S.A.
Chesf (49%)
4.33
4.33
4.33
4.33
4.33
4.33
40.04
-
-
-
-
-
-
-
66.02
Chapada do Piauí I Holding (1)
Chesf (49%)
21.60
39.49
40.38
41.55
42.15
42.76
367.22
2.10
-
-
-
-
-
79.85
677.10
Chapada do Piauí II Holding (2)
Chesf (49%)
34.17
32.95
33.43
33.91
34.40
34.89
311.55
-
-
-
-
-
-
-
515.29
Eólica Serra das Vacas I S.A.
Chesf (49%)
8.46
8.63
8.81
9.00
9.21
9.43
106.23
-
-
-
-
-
-
-
159.77
Eólica Serra das Vacas II S.A.
Chesf (49%)
7.51
7.67
7.83
8.00
8.18
8.38
94.37
-
-
-
-
-
-
-
141.93
Interligação Elétrica do Madeira S.A.
118
Marketletter 2Q16
Eólica Serra das Vacas III S.A.
Chesf (49%)
7.51
7.67
7.83
8.00
8.18
8.38
94.37
-
-
-
-
-
-
-
141.93
Eólica Serra das Vacas IV S.A.
Chesf (49%)
7.51
7.67
7.83
8.00
8.18
8.38
94.37
-
-
-
-
-
-
-
141.93
Vamcruz I
Chesf (49%)
Furnas
(40%)
Furnas
(40%)
Furnas
(39%)
Furnas
(24.5%)
Eletrosul
(24.72%)
Furnas
(49%)
Furnas
(49.5%)
Furnas
(49%)
Furnas
(49%)
Furnas
(49%)
Furnas
(49%)
Furnas
(49%)
Furnas
(49%)
Furnas
(39%)
Furnas
(49.9%)
Furnas
(24.5%)
Furnas
(24.5%)
Furnas
(25%)
Furnas
(33.33%)
Furnas
(24.5%)
Furnas
(49%)
Furnas
-
-
-
-
-
-
-
16.84
16.95
16.95
16.95
16.95
16.95
162.46
264.07
847.59
847.59
847.59
847.59
579.55
-
-
435.38
435.38
435.38
435.38
297.69
-
-
6,009.12
-
-
-
-
-
-
-
-
-
-
-
-
-
-
488.26
579.93
587.03
587.03
7,654.91
-
-
73.79
44.09
138.57
217.69
3,907.68
-
-
14,278.98
-
-
-
-
-
-
-
-
-
-
-
-
-
-
-
-
-
-
-
-
-
-
-
-
-
-
-
-
-
-
364.63
326.38
287.94
249.63
211.81
-
-
-
-
-
-
-
-
-
1,440.37
135.20
118.80
105.70
92.50
79.40
66.20
65.10
-
-
-
-
-
-
-
662.90
-
-
-
-
-
-
-
-
-
-
-
-
-
-
-
-
-
-
-
-
-
-
-
-
-
-
-
-
-
-
-
-
-
-
-
-
-
-
-
-
-
-
-
-
-
-
-
-
-
-
-
-
-
-
-
-
-
-
-
-
-
-
-
-
-
-
-
-
-
-
-
-
-
-
-
-
-
-
-
-
-
-
-
-
-
-
-
-
-
-
-
-
-
-
-
-
-
-
-
-
-
-
-
-
-
-
-
-
-
-
-
-
-
-
-
-
-
-
-
-
-
-
-
-
-
-
-
-
-
-
-
-
-
-
-
-
-
-
-
-
-
-
-
-
-
-
-
-
-
-
-
-
-
-
-
-
-
-
-
-
-
-
-
-
-
-
-
-
-
-
-
-
-
-
-
-
-
-
-
-
-
-
-
-
-
-
-
-
-
-
-
-
-
-
-
-
-
-
-
-
-
-
-
-
-
-
-
-
-
-
Foz do Chapecó
Enerpeixe
Santo Antônio
Teles Pires
Centro Oeste de Minas
Serra do Facão
Retiro Baixo
Goiás Transmissão
MGE Transmissão
Transenergia São Paulo
Transenergia Renovável
Triângulo Mineiro Transmissão S.A.
Vale de São Bartolomeu Transmissão
S.A.
Mata de Santa Genebra S.A.
Companhia Transirapé de
Transmissão S.A.
Companhia Transleste de
Transmissão S.A.
Companhia Transudeste de
Transmissão S.A.
São Manoel
Paranaíba Transmissora de Energia
S.A.
Caldas Novas Transmissão S.A.
Luziânia Transmissora de Energia
119
Marketletter 2Q16
S.A.
(49%)
Geradora Eólica Itaguaçu da Bahia
Geradora Eólica
Luiza
Geradora Eólica
Madalena
Geradora Eólica
Marcella
Geradora Eólica
Vera
Ventos de Santa
Ventos de Santa
Ventos de Santa
Ventos de Santa
Geradora Eólica Ventos de São Cirilo
Geradora Eólica Ventos de São Bento
Geradora Eólica Ventos de São João
Geradora Eólica Ventos de Santo
Antônio
Geradora Eólica Ventos de São
Rafael
Itaguaçu da Bahia Energias
Renováveis S.A.
Uirapuru Transmissora de Energia
S.A.
Transmissora Sul Litorânea de
Energia S.A.
Transmissora Sul Brasileira de
Energia S.A.
Santa Vitória do Palmar Holding S.A.
Marumbi Transmissora de Energia
S.A.
Livramento Holding S.A.
Chuí Holding S.A.
Costa Oeste Transmissora de Energia
S.A.
Fronteira Oeste Transmissora de
Energia
Chuí IX
Hermenegildo I
Hermenegildo II
Furnas
(49%)
Furnas
(49%)
Furnas
(49%)
Furnas
(49%)
Furnas
(49%)
Furnas
(49%)
Furnas
(49%)
Furnas
(49%)
Furnas
(49%)
Furnas
(49%)
Furnas
(49%)
Eletrosul
(75%)
Eletrosul
(51%)
Eletrosul
(80%)
Eletrosul
(49%)
Eletrosul
(20%)
Eletrosul
(59%)
Eletrosul
(49%)
Eletrosul
(49%)
Eletrosul
(51%)
Eletrosul
(99.99%)
Eletrosul
(99.99%)
Eletrosul
(99.99%)
-
-
-
-
-
-
-
-
-
-
-
-
-
-
-
-
-
-
-
-
-
-
-
-
-
-
-
-
-
-
-
-
-
-
-
-
-
-
-
-
-
-
-
-
-
-
-
-
-
-
-
-
-
-
-
-
-
-
-
-
-
-
-
-
-
-
-
-
-
-
-
-
-
-
-
-
-
-
-
-
-
-
-
-
-
-
-
-
-
-
-
-
-
-
-
-
-
-
-
-
-
-
-
-
-
-
-
-
-
-
-
-
-
-
-
-
-
-
-
-
-
-
-
-
-
-
-
-
-
-
-
-
-
-
-
-
-
-
-
-
-
-
-
-
-
-
-
-
-
-
-
-
-
-
-
-
-
-
-
-
-
-
-
-
-
-
-
-
-
-
-
-
6.24
6.24
1.56
-
-
-
-
14.04
34.73
34.73
34.73
34.73
34.73
34.73
243.12
-
-
-
-
-
-
-
451.50
20.19
20.19
20.19
20.19
20.19
20.19
101.54
0.52
0.31
1.86
4.38
6.19
7.74
81.90
325.58
15.29
16.51
18.18
19.64
21.35
22.98
302.34
7.65
8.39
10.29
9.91
12.93
17.11
250.73
733.27
7.91
7.32
6.88
6.59
6.59
6.59
6.06
-
-
-
-
-
-
-
47.94
3.29
3.29
3.29
3.29
3.29
3.29
24.70
-
-
-
-
-
-
-
44.45
23.32
23.32
23.32
23.32
23.32
23.32
209.89
-
-
-
-
-
-
-
349.82
5.25
4.75
4.37
4.04
4.04
4.04
2.21
-
-
-
-
-
-
-
28.69
-
-
-
-
-
-
-
-
-
-
-
-
-
-
-
2.07
2.07
2.07
2.07
2.07
2.07
19.67
0.89
0.89
0.89
0.89
0.89
0.89
8.43
45.85
7.19
7.19
7.19
7.19
7.19
7.19
68.29
3.08
3.08
3.08
3.08
3.08
3.08
29.27
159.16
7.19
7.19
7.19
7.19
7.19
7.19
68.30
3.08
3.08
3.08
3.08
3.08
3.08
29.27
159.20
120
Marketletter 2Q16
Hermenegildo III
Empresa de Transmissão do Alto
Uruguai S.A.
Paraíso Transmissora de Energia S.A.
Eletrosul
(99.99%)
Eletrosul
(51%)
Eletrosul
(24.5%)
6.13
6.13
6.13
6.13
6.13
6.13
58.19
2.63
2.63
2.63
2.63
2.63
2.63
24.94
135.63
7.57
0.63
-
-
-
-
-
-
0.15
10.12
0.16
0.01
-
-
18.64
-
-
-
-
-
-
-
-
-
-
-
-
-
-
-
(1) The participation of SPEs V. Santa Joana IX, X, XI, XII, XIII, XIV and XV Renewable Energy SA were merged into the Chapada company Piaui I Holding S.A.
(2) The participation of SPEs V. Santa Joana I, III, IV, V, VII, Santo Augusto IV Energia Renováveis S.A. were merged into the Chapada company Piaui II Holding S.A.
121


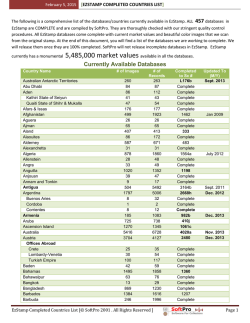

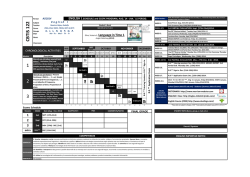

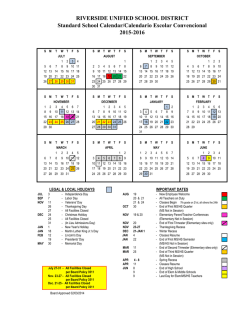

© Copyright 2026