
Red squirrels from south–east Iberia: low genetic diversity at
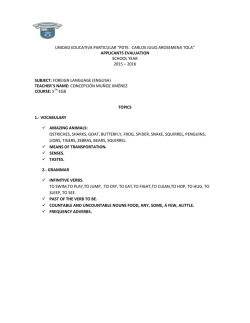
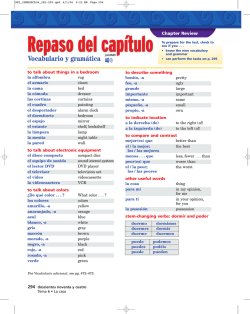
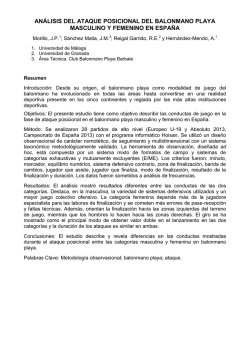
Animal Biodiversity and Conservation 38.1 (2015)
129
Red squirrels from south–east Iberia:
low genetic diversity at the
southernmost species distribution limit
J. M. Lucas, P. Prieto & J. Galián
Lucas, J. M., Prieto, P. & Galián, J., 205. Red squirrels from south–east Iberia: low genetic diversity at the
southernmost species distribution limit. Animal Biodiversity and Conservation, 38.1: 129–138.
Abstract
Red squirrels from southeast Iberia: low genetic diversity at the southernmost species distribution limit.— South–
east Iberia is the southernmost limit of this species in Europe. Squirrels in the region mainly inhabit coniferous
forests of Pinus. In this study, we analyzed the pattern of mitochondrial genetic variation of southern Iberian
red squirrels. Fragments of two mitochondrial genes, a 350–base pair of the displacement loop (D–loop) and
a 359–bp of the cytochrome b (Cytb), were sequenced using samples collected from 88 road–kill squirrels.
The genetic variation was low, possibly explained by a recent bottleneck due to historical over–exploitation
of forest resources. Habitat loss and fragmentation caused by deforestation and geographic isolation may
explain the strong genetic subdivision between the study regions. Six new haplotypes for the D–loop and two
new haplotypes for the Cytb fragments are described. A Cytb haplotype of south–east Iberia was found to be
present in Albania and Japan, suggesting local extinction of this haplotype in intermediate areas. No significant
clustering was found for the south–east of Spain or for the other European populations (except Calabria) in
the phylogenetic analysis.
Key words: Sciurus vulgaris, Mitochondrial DNA, Genetic diversity, Population bottleneck
Resumen
Ardillas rojas del sureste ibérico: baja diversidad genética en el límite austral de la distribución de la especie.— El
sureste ibérico es el límite más austral de la distribución de esta especie en Europa, donde las ardillas habitan
principalmente en bosques de Pinus. En este estudio, se investigó el patrón de variación genética mitocondrial
de las ardillas rojas del sureste ibérico. Se secuenciaron fragmentos de dos genes mitocondriales, 350 pares
de bases de la región control (D–loop) y 359 pb del citocromo b (Cytb) utilizando muestras obtenidas a partir
de 88 ardillas atropelladas. Se encontró una baja variación genética, lo cual podría explicarse por la existencia
de un cuello de botella reciente causado por la sobreexplotación histórica de los recursos madereros de la
zona. La pérdida y fragmentación del hábitat debidas a la deforestación y al aislamiento geográfico podrían
explicar la fuerte subdivisión genética observada entre las regiones del estudio. Se describen seis nuevos
haplotipos para el fragmento D–loop y dos para el Cytb. Un haplotipo encontrado en el sureste ibérico para
el Cytb se observó también en Albania y Japón, lo que sugiere una extinción local de este haplotipo en áreas
intermedias. En los análisis filogenéticos, no se detectó un agrupamiento significativo de las ardillas del sureste
ibérico, ni de ninguna otra población europea (excepto en Calabria).
Palabras clave: Sciurus vulgaris, ADN mitocondrial, Diversidad genética, Cuello de botella poblacional
Received: 9 X 14; Conditional acceptance: 28 I 15; Final acceptance: 23 IV 15
J. M. Lucas, & J. Galián, Depto. de Zoología y Antropología Física, Fac. de Veterinaria, Univ. de Murcia,
Campus de Espinardo, 30100 Murcia, España (Spain).– P. Prieto, Parque Natural de Cazorla, Segura y las
Villas, c/ Martinez Falero 11, 23470 Cazorla, Jaén, España (Spain).
Corresponding author: José Manuel Lucas, e–mail: [email protected]
ISSN: 1578–665 X
eISSN: 2014–928 X
© 2015 Museu de Ciències Naturals de Barcelona
Lucas et al.
130
Introduction
The red squirrel (Sciurus vulgaris Linnaeus, 1758) is
widely distributed from Iberia in the west across the
Palaearctic to the island of Hokkaido (Japan), and
from the UK, Ireland, Scandinavia and Siberia to the
Mediterranean (Corbet, 1978; Lee & Fukuda, 1999;
Lurz et al., 2005). In the Iberian Peninsula, this na�
tive sciurid is continuously distributed from Girona to
Galicia and the Northern Iberian Mountain Range, the
Northern Plateau and the Central Mountain Range,
and southwards to Valencia. It is discontinuously
distributed from Cataluña to Andalucía, and widely
spread in the Baetic Mountain Ranges, including
Murcia, Albacete and Alicante (��������������������
Valverde, 1967; Pur�
roy, 2014). As the result of recent reintroductions, the
species can also be found in
�������������������������
central and north Por�
tugal (Mathias & Gurnell, 1998; Ferreira et al., 2001;
Ferreira & Guerreiro, 2002) (fig. 1A). Most Iberian
squirrels occupy pure pine forest: Pinus halepensis in
the lower altitudes, P. pinaster and P. nigra in middle
levels, and P. mugo in the higher locations (Valverde,
1967). In south–east Iberia, the most common species
of pine is P. halepensis (Aleppo pine), however, even
at relatively medium/high altitudes. This is especially
evident in the region of Murcia where red squirrels are
found in urban parks and adjacent copses, in small to
large villages, and even in cities where Aleppo pine
can be found. In these localities, they have even been
seen feeding on date palms (pers. obs.).
The species is extremely variable in color. Consid�
erable regional variation is superimposed on a striking
polymorphism and equally striking seasonal differenc�
es (Corbet, 1978). Many studies of the morphological
diversity of Spanish squirrels have been made in the
past century, especially in the early nineteen hundreds
(Cabrera, 1905; Miller, 1907, 1909, 1912), which led
to an intense taxonomical discussion. More recently,
the first researcher to provide new material morpho�
logical variation was Valverde (1967). He assigned
his samples to four previously described subspecies
(S. v. alpinus Desmarest, 1822, S. v. numantius
Miller, 1907, S. v. infuscatus Cabrera, 1905 and S. v.
segurae Miller, 1912) and suggested the existence of
a new subspecies, which he named S. v. hoffmanni
Valverde, 1967 from Sierra Espuña (southeast Spain).
However, subsequent authors considered that only
two subspecies are present in Iberia: S. v. fuscoater
Altum, 1876 and S. v. infuscatus (Corbet, 1978; Lurz
et al., 2005; Sidorowicz, 1971) (fig. 1B).
Valverde (1967) emphasized the importance of the
hoffmanni subspecies because of its ecological and
morphological features. These squirrels represent
the southeastern limit of the Iberian distribution of
the species in the xerothermic forest–margin of the
Iberian Peninsula, where it lives in pure Aleppo pine
forest. Moreover, S. v. hoffmanni would be the larg�
est of the European red squirrels, with the palest fur.
Thus, this form should represent the ecological limit
and the most extreme phenotype of Iberian squir�
rels (Valverde, 1967). According to the author, S. v.
hoffmanni is restricted to the Regional Park of Sierra
Espuña, but currently the hoffmanni phenotype can be
easily observed in the Regional Park of Carrascoy–
El Valle further south of this region, separated from
Espuña by the Guadalentín River. The Regional Park
of Sierra Espuña is about 80 km east of the Natural
Park of Sierra de Cazorla, Segura y Las Villas and
they are connected by a northwestern green corridor
(Special Protected Area of Sierra de Burete, Lavia y
Cambrón, and the Northwestern Mountains of Mur�
cia). The Natural Park of Sierra de Cazorla, Segura
y Las Villas is the largest protected area in Spain,
214,300 ha, and it was designated by UNESCO as
a Biosphere Reserve in 1983. There are good–sized
red squirrel populations in this area, and they are still
under taxonomic discussion (S. v. baeticus Cabrera,
1905 = S. v. segurae = S. v. infuscatus).
Beyond the taxonomical discussion, no recent
studies of the ecological characteristics of squirrels
from southeast Iberia have been published. Only one
study has investigated the genetics of some Iberian
populations (Lucas & Galián, 2009), and it found
extremely low genetic variation in the population of
the Regional Park of Sierra Espuña.
We investigated whether the low genetic diversity
found in Sierra Espuña can be considered a pattern
in Southeast Iberia or whether it is a peculiarity of
this population. In order to study the relationships
between the southeastern Iberian squirrels and the
other European populations, we compared our results
with those in the literature. To achieve these objectives
two mitochondrial gene fragments (D–Loop and Cytb)
were analyzed using samples from road–kill animals.
Material and methods
Sample collection
In southeastern Spain, most natural areas are crossed
by roads and frequented by a large number of visitors.
As found in other European populations (Shuttleworth,
2010), road–kill squirrels are frequent in the study area
both in natural and suburban environments.
The study area was divided into five regions accor�
ding to geographical and ecological barriers or distance
between samples clusters (fig. 2). Samples from CSV
and ESP were collected from the reported distribution
of the segurae and hoffmanni subspecies. All of the
samples comprised approximately 2 mm2 of muscle
tissue and were preserved in absolute ethanol, then
stored at –20°C until DNA purification.
DNA extraction and sequencing
Total genomic DNA was extracted from tissue samples
using a Qiagen DNAeasy Tissue Kit, according to
the manufacturer’s protocol. A total of 754–bp were
amplified from two gene regions of the mitochondrial
DNA. A 395–bp fragment of the D–loop was amplified
in 12.5–µl reactions, following the protocol described
by Hale et al., 2004, using 1 µl of tissue DNA and
the red squirrel–specific primers, H16359 (Barratt et
al., 1999) and RScont6 (Hale et al., 2004). A 359–bp
region of the Cytb was amplified using the same pro�
Animal Biodiversity and Conservation 38.1 (2015)
A
S. v. alpinus
S. v. numanticus
S. v. segurae (Cazorla)
131
B
S. v. infuscatus
S. v. hoffmanni
S. v. segurae (Molinicos)
S. v. fuscoater
Fig. 1. Map of the species distribution in the Iberian peninsula (A) modified from Palomo & Gisbert (2002).
Geographic distribution of red squirrel subspecies (B), obtained from Valverde (1967) and Mathias &
Gurnell (1998). Square shape (£) and triangle shape (r) refer to the subspecies infuscatus and fuscoater,
respectively, as synonymised in more recent studies (Sidorowicz, 1971; Corbet, 1978; Lurz et al., 2005).
Fig. 1. Mapa de distribución de la especie en la península ibérica (A), modificado de Palomo & Gisbert
(2002). Distribución geográfica de las subespecies de ardilla roja (B), a partir de la información de Valverde (1967) y Mathias & Gurnell (1998). Los cuadrados (£) y los triángulos (r) hacen referencia a las
subespecies infuscatus y fuscoater respectivamente, sinonimizadas en trabajos más recientes (Sidorowicz,
1971; Corbet, 1978; Lurz et al., 2005).
tocol, except that we used the primers SV14226F and
SV14647R from Grill et al. (2009). Negative (sterile
water) and positive (known squirrel DNA) controls
were always used and the products were visualized on
2% agarose gels alongside a 100–bp size standard to
determine the success of the amplification. The PCR
products were sequenced in both forward and reverse
directions for each sample by Macrogen Inc., Korea.
Data analysis
Consensus sequences for each individual were ob�
tained by aligning the forward and reverse comple�
mentary sequences of each gene (D–loop and Cytb)
with Geneious 4.8.3. D–loop sequences were aligned
in MUSCLE (Edgar, 2004) and Cytb sequences with
ClustalW algorithm (Larkin et al., 2007). The haplotypes
were identified with TCS 1.21 (Clement et al., 2000) and
compared with those available in the GenBank using
BLAST (Altschul et al., 1990). The relative frequencies
of the Cytb and D–loop haplotypes were calculated with
Arlequin 3.1.2.3 (Excoffier & Lischer, 2010). Haplotype
diversity was calculated separately for each gene. Due
to the low diversity found in Cytb sequences, both genes
were combined to investigate the nucleotide diversity.
The molecular diversity indices were determined using
DnaSP 5 (Librado & Rozas, 2009).
The pairwise genetic distances between regions,
which were measured as FST, were calculated from
a distance matrix of D–loop haplotypes based on the
Tamura–Nei model (Tamura & Nei, 1993) in Arlequin
3.1.2.3 (Excoffier & Lischer, 2010).
The genealogical relationships between the D–loop
haplotypes of southeast Iberia were assessed by
constructing a median–joining network in NETWORK
4.6.1 (Bandelt et al.,1999)����������������������������
. Haplotype networks includ�
ing sequences from the GenBank were also calculated
for both genes.
Phylogenetic analyses were conducted in MEGA6
(Tamura et al., 2013) using the maximum likelihood
(ML) method with the nearest neighbour interchange
algorithm. Nucleotide sequences of red squirrels from
other European populations (Hale et al., 2004; Grill et
al., 2009; Doziéres et al., 2012) and of the Japan squirrel
Sciurus lis (Oshida & Masuda, 2000) were downloaded
from GenBank and aligned with our data set. These se�
quences showed a 100% overlapwith the sequences we
analysed. The model of nucleotide substitution that best
fitted the data set was determined with MEGA6 (Tamura
et al., 2013). The stability of the ML tree topologies were
tested using 1,000 bootstrap replicates.
Results
A total of 88 samples from the five regions were
genotyped successfully. Twenty of the samples from
ESP were used in previous work (Lucas & Galián,
Lucas et al.
132
AAL
Segura
River
ESP
MUR
CSV
er
Riv
ín
t
n
ale
CEV
ad
Gu
Fig. 2. Map of the study area. The black dots represent Sciurus vulgaris specimens. The green line marks
the area of the Natural Park of Sierra de Cazorla, Segura y Las Villas, and the orange line delimits the
area of the Natural Park of Sierra Espuña. The five regions in the study area are bounded by black
lines: CSV. Natural Park of Sierra de Cazorla, Segura y Las Villas and surroundings; ESP. Regional Park
of Sierra Espuña and surroundings; MUR. Copses and periurban parks near the city of Murcia; CEV.
Regional Park of Carrascoy–El Valle; AAL. Albacete and Alicante.
Fig. 2. Mapa del área de estudio. Los puntos negros representan los individuos de Sciurus vulgaris. La
línea verde indica el límite del Parque Natural de Sierra de Cazorla, Segura y Las Villas, y la línea naranja
delimita el área del Parque Regional de Sierra Espuña. Las líneas negras definen las cinco regiones en
las que se divide el área de estudio: CSV. Parque Natural de Sierra de Cazorla, Segura y Las Villas y alrededores; ESP. Parque Regional de Sierra Espuña y alrededores; MUR. Bosquetes y parques periurbanos
próximos a la ciudad de Murcia; CEV. Parque Regional de Carrasco y–El Valle; AAL. Albacete y Alicante.
2009). Fragments of the D–loop and Cytb (395–bp
and 359–bp respectively) were obtained for each
sample. As we found that a tRNA was present within
the nucleotide spans of the D–loop fragment, they
were trimmed to 350–bp to adjust the sequence
length to the target gene. Aligned sequence data
were submitted to the GenBank database with ac�
cession numbers KJ146734–KJ146742. We found
a total of six D–loop haplotypes which have never
been reported, and a total of three Cytb haplotypes,
two of which were also found to be exclusive to the
south east of Spain (SvCb2 and SvCb3). SvCb1 was
identical to haplotypes previously found in Albania
(Grill et al., 2009) and Japan (Oshida et al., 2009).
Three of the six haplotypes identified for the D–loop
were found in CSV and two were present throughout
the whole study area. One of the three Cytb haplotypes
was exclusive to CSV but the others were present in
more than one region (table 1). The concatenated alignment was 709–bp long and
contained eight variable positions. These sequences
were collapsed into seven haplotypes. The nucleotide
(π) diversity of the concatenated sequence was zero
in CEV, low in the ESP region, intermediate in MUR
and AAL, and higher in CSV (table 2). The haplotype
diversity (Hd) of the two genes varied in the same
way when treated separately, although it was lower in
the case of the Cytb. Genetic differentiation between
regions was high in almost all cases (table 3).
In the haplotype network (fig. 3), three haplotypes
were placed as external nodes, two belonging to CSV
(one of them unique to this region) and one exclusive
to AAL. The two most common haplotypes (SvCR1
and SvCR2) were both placed as internal nodes, as
was haplotype SvCR4. This haplotype was exclusive
to CSV and located in the center of the network, also
being connected to SvCR3 (exclusive to AAL).
Haplotype SvCb1 was placed in the center of
the Cytb network (data not shown). The SvCb2 and
SvCb3 haplotypes were directly connected to this and
both differed in two nucleotide positions. Haplotype
networks using sequences from the GenBank (data
not shown) did not show any grouping by geographic
region. In the Cytb network, the only haplotype that
showed a clear differentiation was that found in Ca�
labria by Grill et al. (2009).
A phylogenetic analysis was conducted for the
D–loop haplotypes, including haplotypes from Hale
Animal Biodiversity and Conservation 38.1 (2015)
133
A
B
AAL
MUR
SvCR1
SvCR2
SvCR3
SvCR4
SvCR5
SvCR6
CEV
CSV
ESP
Fig. 3. Median–joining network of the six new D–loop haplotypes (A) and their spatial distribution (B): A.
The circles (nodes) in the network represent the haplotypes and the areas of the circles are proportional
to the number of samples for each haplotype. The perpendicular short black lines represent mutations;
B. Each pie in the distribution map represents the proportion of haplotypes in each region and the size
of the pie is proportional to the number of individuals.
Fig. 3. Red haplotípica (basada en el algoritmo de unión de medianas (median–joining) para los seis
nuevos haplotipos del fragmento D–loop (A) y distribución espacial de los mismos (B): A. En la red
haplotípica, los círculos (nodos) representan los haplotipos y las áreas son proporcionales al número
de muestras de cada haplotipo; B. En el mapa de distribución, cada gráfica representa la proporción de
haplotipos en cada región y su tamaño es proporcional al número de muestras.
D–loop haplotypes (fig. 4A). This phylogenetic tree
was conducted under the Hasegawa–Kishino–Yano
(HKY85) model (Hasegawa et al., 1985) with rate
heterogeneity among sites (gamma distribution shape
et al. (2004), Grill et al. (2009) and Doziéres et al.
(2012). A 252–bp alignment was generated. The
tree with the highest log likelihood (–762.4389) was
obtained in the maximum likelihood analysis of the
Table 1. Haplotype frequencies in the five regions and the overall study area. (For abbreviations see figure
2; SE Spain refers to the overall study samples.)
Tabla 1. Frecuencias haplotípicas en las cinco regiones y en toda el área de estudio. (Para las abreviaturas,
véase la figura 2; SE Spain se refiere al total de muestras.)
Haplotype
ESP MUR CEV AAL CSV SE Spain
SvCb1
0.972
0.400
1
0.250
0.654
0.761
SvCb2
0.023
0.600
0
0.750
0.192
0.193
SvCb3
0
0
0
0
0.154
0.045
SvCR1
0.972
0.467
1
0
0.115
0.591
SvCR2
0.028
0.533
0
0.750
0.462
0.273
SvCR3
0
0
0
0.250
0
0.011
SvCR4
0
0
0
0
0.154
0.045
SvCR5
0
0
0
0
0.231
0.068
SvCR6
0
0
0
0
0.038
0.011
Lucas et al.
134
Table 2. Summary of the diversity indices: N. Number of sequences/individuals; π Nucleotide diversity
with standard deviation; h. Number of haplotypes; Hd. Haplotype diversity with standard deviation. (For
other abbreviations see figure 2; SE Spain refers to the overall study samples.)
Tabla 2. Resumen de los índices de diversidad: N. Número de secuencias/individuos; π. Diversidad
nucleotídica con desviación estándar; h. Número de haplotipos; Hd. Diversidad haplotípica con desviación
estándar. (Para las otras abreviaturas, véase la figura 2; SE Spain se refiere al total de muestras.)
N
π
hD–loop hCytb hCombined
HdD–loop
HdCytb
CSV
26
0.00339 ± 0.00030
5
3
6
0.723 ± 0.064 0.532 ± 0.092 0.831 ± 0.032
ESP
36
0.00024 ± 0.00022
2
2
2
0.056 ± 0.052 0.056 ± 0.052 0.056 ± 0.052
MUR
15
0.00226 ± 0.00022
2
2
2
0.533 ± 0.052 0.533 ± 0.052 0.533 ± 0.052
CEV
7
0.00000
1
1
1
AAL
4
0.00212 ± 0.00112
2
2
2
0.500 ± 0.265 0.500 ± 0.265 0.500 ± 0.265
SE Spain 88
0.00222 ± 0.00020
6
3
7
0.576 ± 0.044 0.385 ± 0.055 0.607 ± 0.050
0.000
0.000
HdCombined
0.000
Collecting tissue samples from road–kill squirrels
avoids such risk and has been proven a suitable
source of quality DNA for molecular studies (Lucas
& Galián, 2009; Doziéres et al., 2012). However, this
kind of sampling does not allow the development of a
sampling plan where regions are equally represented.
In southeast Spain, this disadvantage can be partially
compensated for by the abundance of road–kill ani�
mals in rural and suburban areas.
In this study, we found a level of genetic diversity
similar to that reported for Spain by Hale et al. (2004)
and Grill et al. (2009). However, the extremely low
genetic diversity of ESP, described by Lucas & Galián
(2009), is the most striking result in this study. This
contrasts sharply with the relatively high genetic
variation found in CSV, despite its ecological con�
nectivity with ESP.
Anthropogenic effects such as farming or direct hu�
man exploitation have decreased the distribution ranges
and population sizes of many species in the Iberian
peninsula (Gómez & Lunt, 2007). In southeastern
Spain, the area occupied by ESP and CSV suffered
parameter of 0.17). No significant clustering of the
haplotypes was found for the southeast of Spain or
for the rest of the European populations.
A second analysis was performed for the combined
data set, that included nine haplotypes from other
European populations (Grill et al., 2009). A 611–bp
alignment was generated. The maximum likelihood
tree of the combined mtDNA sequences (log likelihood
of –1,306.7513) was inferred based on the Tamura
3–parameter model (Tamura, 1992) with invariant sites
(fig. 4B). The phylogeny showed a clear differentiation
for the Calabrian lineage but not for the rest of the
sample. The same result was observed by analyzing
the Cytb haplotypes (data not shown). Sequences of
S. lis were always rooted in the phylogenetic trees.
Discussion
Capture and manipulation of living red squirrels may
imply a high risk for their health, such as heart attack
or dorsal spin fracture (Josep Piqué, pers. comm.).
Table 3. FST values between pairs of regions (below diagonal) and P–values computed based on 1,000
permutations (upper diagonal): *P < 0.05, **P < 0.001. (For abbreviations see figure 2.)
Tabla 3. Valores de FST entre pares de regiones (diagonal inferior) y valores de P calculados a partir de
1.000 permutaciones (diagonal superior): * P < 0,05; ** P < 0,001. (Para las abreviaturas, véase la figura 2.)
ESP
MUR
CEV
AAL
CSV
ESP
–
–
0.99902 ± 0.0002
–
–
MUR
0.56208**
–
–
0.24805 ± 0.0161
0.19629 ± 0.0111
CEV
–0.07417
0.39655*
–
–
–
AAL
0.89285**
0.13125
0.82554*
–
0.23828 ± 0.0161
CSV
0.45766**
0.02575
0.30762*
0.05825
–
Animal Biodiversity and Conservation 38.1 (2015)
ITA Venezia
ITA Calabria
ITA Calabria
FRA Aq
UK Wb
A
100
135
98
UK E
UK E
UK Wa
FRA Br
SPA
ITA Vico
UK N
SPA
PRT
SPA
PRT
78
SPA
SPA
FRA Pl
PRT
FRA Mc
ITA Varese
FRA Lc
ITA Calabria
ITA Calabria
69
65
51
100
ITA Belluno
ITA Calabria
SvCR1
SvCR6
SvCR2
SvCR3
SvCR4
SvCR5
Sciurus lis AB 192959
Sciurus lis AB 192960
B
90
98
100
Sv66
Sv67
PRT 303
Svh30
Sv41
Sv76
Sv13
Sv64
PRT 300
FRA 404
ITA 209
ITA 413
FRA 412
ITA 425
ITA 414
Calabria 262
100
Sciurus lis AB 192923
Sciurus lis AB 192922
Fig. 4. Condensed maximum–likelihood trees of the D–loop fragment (A) and the combined D–loop and Cyb
sequences (B). Branches with less than 50% of bootstrap (1,000 replicates) are collapsed in both trees.
The ISO 3166 code is used to designate the country of each sample taken from the literature: A. Taxon
labels refer to the D–loop haplotypes from this study (SvCR#) and from other European populations (Hale
et al., 2004; Grill et al., 2009); all the French sequences are obtained from Doziéres et al. (2012); B. Labels
indicate the sample ID of individuals with different combined haplotypes (Sv##, Svh##) and the specimen
numbers from Grill et al. (2009). GenBank accession numbers of the outgroups are indicated in the trees.
Fig. 4. Árboles condensados de máxima verosimilitud para el fragmento del D–loop (A) y para las secuencias
concatenadas del D–loop y el Cytb (B). Las ramas presentes en menos del 50% de las 1.000 réplicas obtenidas
por muestreo con reemplazo (bootstrap) se han condensado en ambos árboles. Se usa el código ISO 3166
para designar el país de procedencia de cada una de las muestras tomadas de la bibliografía: A. Los nombres
de los taxones hacen referencia a los haplotipos del D–loop de este estudio (SvCR#) y a aquellos procedentes
de otras poblaciones europeas (Hale et al., 2004; Grill et al., 2009); todas las muestras recogidas en Francia
se han obtenido de Doziéres et al. (2012); B. Los nombres de los taxones indican el código de muestra de
individuos con distintos haplotipos de secuencias concatenadas (Sv##, Svh##) y el número del espécimen en
Grill et al. (2009). Se indican los números de acceso al GenBank de los grupos externos en ambos árboles.
Lucas et al.
136
strong deforestation caused by over–exploitation of
forest resources in the 18th and 19th centuries (Val�
verde, 1967; Araque, 2013). As of he second half of
the 19th century, reforestation works have been carried
out (Codorniu, 1900; González–Pellejero & Álvarez,
2004), helping to preserve red squirrel populations in
this area (Valverde, 1967) to date.
As expected given the previous scenario, the propor�
tion of suitable habitats in the landscape decreased criti�
cally, increasing the degree of isolation with increasing
habitat fragmentation. This situation may have led to a
temporary decline in the local squirrel population, which
reduced gene flow (Merriam & Wegner, 1992; Andrén
& Delin, 1994; Wauters et al., 1994; Amos & Harwood,
1998; Wauters et al., 2010). Therefore, the low genetic
variation found in southeast Iberia may be the result of
a severe bottleneck, similar to that reported by Trizio
et al. (2005) for Alpine squirrels. However, whereas
Trizio et al. (2005) found high haplotype diversity but
low nucleotide diversity, we found low genetic variation
at both levels. This situation contrasts strongly with the
high genetic variation found by Gallego & Galián (2008)
for the other Pine–specific species Tomicus destruens
in the Regional Park of Sierra Espuña.
As in other European populations (Hale et al., 2004;
Finnegan et al., 2008; Doziéres et al., 2014), we found
substantial genetic subdivision between regions (table
3). Habitat loss and fragmentation due to anthropo�
genic effects and geographical barriers may explain
these results. For CEV, where SvCR1 was the only
haplotype found, the high haplotype fixation may be
explained by the geographical isolation caused by the
Guadalentín River or by introduction of animals from
other sources such as the Sierra Espuña Regional
Park. The strong fixation found in CEV and AAL might
also be due to low sample size, which can lead to an
overestimation of the FST values.
Valverde (1967) emphasized the differentiation
of the hoffmanni subspecies in Sierra Espuña and
its differentiation from the populations of Sierra de
Cazorla, Segura y Las Villas (S. v. segurae) and the
rest of the Iberian Peninsula. This classification was
achieved using morphological traits and fur colour.
Nevertheless, we found no pattern of genetic variation
to support this subspecific classification.
Since the internal nodes of haplotype networks
are considered as ancestral and the external nodes
as more recent status (Castelloe & Templeton, 1994;
Templeton, 1998), and since a reduction in popula�
tion size results in an accelerated increase in genetic
distance in the early generations (Chakraborty & Nei,
1974; Nei, 1976; Takezaki & Nei, 1996), our results
may be explained by a scenario where widely dis�
tributed ancestral haplotypes became extinct due to a
bottleneck events. Thus, haplotype SvCR4 occupying
the central node of the D–loop network, but in a very
low frequency, is a candidate to be considered an
ancestral widely distributed haplotype that became
extinct in all areas but CSV, especially in ESP which
is the region with the largest sample size.
The finding of a Cytb haplotype (SvCb1) that was
previously described in Albania and Japan but not
in other Eurasian population suggests an ancestral
wide distribution of this haplotype, followed by local
extinction in intermediate areas.
Iberia and Italy have been reported as potential
glacial refuges for the red squirrel (Hale et al., 2004;
Finnegan et al., 2008; Grill et al., 2009; Doziéres et al.,
2012) and our results confirm that Iberian samples do
not show the expected high levels of genetic diversity
(Hewitt, 1996; Taberlet et al., 1998). This finding would
be supported by a paper by Doziéres et al. (2012) that
suggested a postglacial recolonization of Europe from
Asia or from the Balkans or, alternatively, a series of
recent bottlenecks that reduced the genetic diversity
in the Iberian and Italian populations. The finding of
haplotype SvCb1 in Iberia, the Balkans and Japan
favours the hypothesis of the Iberian Peninsula acting
as a glacial refuge. Besides, the low genetic variation
found may be explained by the recent bottleneck in
these populations.
In contrast with the report by Grill et al. (2009)
and Doziéres et al. (2012), we found no significant
clustering for the squirrels of Calabria in the phylo�
genetic analysis of the D–loop haplotypes (fig. 4A).
However, these individuals were clearly differentiated
in the remaining the phylogenetic trees (fig. 4B). Nev�
ertheless, the results of the phylogenetic analysis are
largely dependent on the sequence length (number
of informative sites) and the number of individuals
analysed. Thus, this could be an explanation of the
lack of clustering found in this work for the Calabrian
squirrels (fig. 4A). None of the squirrels in Spain were
separated in these analyses, suggesting that Iberian
squirrels have not been isolated from the rest of the
European populations, as found by Doziéres et al.
(2012) for French squirrels. Nonetheless, Grill et al.
(2009) emphasised the clear separation of the Iberian
squirrels, based on the analysis of eight microsatellite
loci. We noticed that the squirrels from ESP did not
form a monophyletic clade in the philogenetic analy�
ses, in contrast with what we found in previous work
(Lucas & Galián, 2009). The inclusion of samples
from nearby populations (CSV, CEV, ALL and MUR)
shows that, in fact, the population of Sierra Espuña
is very close to other Iberian populations.
A more extensive study should be carried out to
understand the phylogenetic and demographic rela�
tionships between the Iberian populations, not only at
a mitochondrial level, but also at a nuclear level. The
recent development of next–generation sequencing
methods offers a wide potential for obtaining complete
genomes, allowing more accurate research into the
evolutionary relationships at an intraspecific level
(McCormack et al., 2013).
Acknowledgments
We wish to thank the following people who helped
us by collecting road–kill squirrel samples: Antonio
Ortuño, Ángel Albert, José Manuel López, Carlos
González, Jorge Sánchez, Ana Miñano (C. R. F. El
Valle), Cristina López, Javier García, Lidia Lorca, José
Manuel Vidal, Mario León, Irene Muñoz, Carmelo
Andújar, Paula Arribas, José Serrano, José Galián,
Animal Biodiversity and Conservation 38.1 (2015)
Rosa María Ros, and Isabel Sánchez Guiu. We also
thank the environmental officers of the Natural Park
of Sierra de Cazorla, Segura y Las Villas and the
Regional Park of Sierra Espuña for collecting samples.
And Obdulia S. Sanchez–Domingo and Ana I. Asensio
for technical assistance, and thank Prof. José Serrano
for useful comments on the manuscript.
References
Altschul, S. F., Gish, W., Miller, W., Myers, E. W. &
Lipman, D. J., 1990. Basic local alignment search
tool. Journal of Molecular Biology, 215: 403–410.
Amos, W. & Harwood, J., 1998. Factors affecting levels
of genetic diversity in natural populations. Philosophical transactions of the Royal Society of London.
Series B, Biological Sciences, 353: 177–186.
Andrén, H. & Delin, A., 1994. Habitat Selection in the
Eurasian Red Squirrel, Sciurus vulgaris, in Relation
to Forest Fragmentation. Oikos, 70: 43–48.
Araque, E., 2013. Evolución de los paisajes foresta�
les del Arco Prebético. El caso de las Sierras de
Segura y Cazorla. Revista de Estudios Regionales,
96: 321–344.
Bandelt, H. J., Forster, P. & Rohl, A., 1999. Median–
joining networks for inferring intraspecific phyloge�
nies. Molecular Bbiology and Evolution, 16: 37–48.
Barratt, E. M., Gurnell, J., Malarky, G., Deaville,
R. & Bruford, M. W., 1999. Genetic structure of
fragmented populations of red squirrel (Sciurus
vulgaris) in the UK. Molecular Ecology, 8: S55–63.
Cabrera, A., 1905. Las ardillas de España. Boletin
de la Real Sociedad Española de Historia Natural,
5: 225–231.
Castelloe, J. & Templeton, A. R., 1994. Root proba�
bilities for intraspecific gene trees under neutral
coalescent theory. Molecular Phylogenetics and
Evolution, 3: 102–113.
Chakraborty, R. & Nei, M., 1974. Dynamics of gene
differentiation between incompletely isolated po�
pulations of unequal sizes. Theoretical Population
Biology, 5: 460–469.
Clement, M., Posada, D. & Crandall, K. A., 2000. TCS:
a computer program to estimate gene genealogies.
Molecular Ecology, 9: 1657–1659.
Codorniu, R., 1900. Apuntes relativos a la repoblación
forestal de la Sierra de Espuña presentados al
Congreso Agrícola de Murcia. Tipográfica de Las
Provincias de Levante, Murcia.
Corbet, G., 1978. The Mammals of the Palaearctic
Region: A Taxonomic Review. British Museum
(Natural History), Cornell University Press, London.
Dozières, A., Chapuis, J.–L., Thibault, S. & Baudry, E.,
2012. Genetic Structure of the French Red Squirrel
Populations: Implication for Conservation. PLoS
ONE, 7: e47607. Doi:10.1371/journal.pone.0047607
Edgar, R. C., 2004. MUSCLE: multiple sequence
alignment with high accuracy and high throughput.
Nucleic Acids Research, 32: 1792–1797.
Excoffier, L. & Lischer, H. E., 2010. Arlequin suite ver
3.5: a new series of programs to perform popula�
tion genetics analyses under Linux and Windows.
137
Molecular Ecology Resources, 10: 564–567.
Ferreira, A. F., Guerreiro, M., Álvares, F. & Petrucci–Fon�
seca, F., 2001. Distribución y aspectos ecológicos de
Sciurus vulgaris en Portugal. Galemys, 13: 155–170.
Ferreira, A. & Guerreiro, M., 2002. Estudo da dinámica
populacinal do esquilo–comun (Sciurus vulgaris) no
Parque Florestal de Monsanto. Informe Técnico,
Parque ecológico de Monsanto, Lisboa.
Finnegan, L. A., Edwards, C. J. & Rochford, J. M.,
2008. Origin of, and conservation units in, the Irish
red squirrel (Sciurus vulgaris) population. Conservation Genetics, 9: 1099–1109.
Gallego, D. & Galián, J., 2008. Hierarchical structure
of mitochondrial lineages of Tomicus destruens
(Coleoptera, Scolytidae) related to environmental
variables. Journal of Zoological Systematics and
Evolutionary Research, 46: 331–339.
Gómez, A. & Lunt, D. H., 2007. Refugia within refugia:
Patterns of phylogeographic concordance in the
Iberian Peninsula. In: Phylogeography of southern
European refugia: 155–188 (S. Weiss & N Ferrand
Eds.). Springer, Dordrecht.
González–Pellejero, R. & Álvarez, A., 2004. El Mapa
Forestal de España, una obra secular (1868–1966 )
concluida por Luis Ceballos. Ería, 64–65: 285–318.
Grill, A., Amori, G., Aloise, G., Lisi, I., Tosi, G., Wauters,
L. A. & Randi, E., 2009. Molecular phylogeography
of European Sciurus vulgaris: refuge within refugia?
Molecular Ecology, 18: 2687–2699.
Hale, M., Lurz, P. W. & Wolff, K., 2004. Patterns of
genetic diversity in the red squirrel (Sciurus vulgaris
L.): Footprints of biogeographic history and artificial
introductions. Conservation Genetics, 5: 167–179.
Hasegawa, M., Kishino, H. & Yano, T., 1985. Dating
the human–ape split by a molecular clock of mi�
tochondrial DNA. Journal of Molecular Evolution,
22: 160–174.
Hewitt, G. M., 1996. Some genetic consequences
of ice ages,and their role in divergence and spe�
ciation. Biological Journal of the Linnean Society,
58: 247–276.
Larkin, M. A., Blackshields, G., Brown, N. P., Chenna,
R., McGettigan, P. A., McWilliam, H., Valentin, F.,
Wallace, I. M., Wilm, A., Lopez, R. J., Thompson, D.,
Gibson, T. J. & Higgins, D. G., 2007. Clustal W and
Clustal X version 2.0. Bioinformatics, 23: 2947–2948.
Lee, T. H. & Fukuda, H., 1999. The distribution and
habitat use of the Eurasian red squirrel (Sciurus
vulgaris L.) during summer, in Nopporo Forest Park,
Hokkaido. Mammal Study, 24: 7–15.
Librado, P. & Rozas, J., 2009. DnaSP v5: a software
for comprehensive analysis of DNA polymorphism
data. Bioinformatics, 25: 1451–1452.
Lucas, J. M. & Galián, J., 2009. Análisis molecular
de Sciurus vulgaris hoffmanni Valverde, 1967
(Rodentia: Sciuridae) e implicaciones para su
conservación. Anales de Biología, 31: 81–91.
Lurz, P. W. W., Gurnell, J. & Magris, L., 2005. Sciurus
vulgaris. Mammalian Species, 769: 1–10.
Mathias, M. d. L. & Gurnell, J., 1998. Status and
conservation of the red squirrel (Sciurus vulgaris)
in Portugal. Hystrix, 10: 13–19.
McCormack, J. E., Hird, S. M., Zellmer, A. J., Cars�
138
tens, B. C. & Brumfield, R. T., 2013. Applications
of next–generation sequencing to phylogeography
and phylogenetics. Molecular Phylogenetics and
Evolution, 66: 526–538.
Merriam, G. & Wegner, J., 1992. Local Extinctions,
Habitat Fragmentation, and Ecotones. In: Landscape Boundaries: 150. (A. Hansen & F. di Castri,
Eds.). Springer, New York.
Miller, G. S., 1907. LX– Four new European squi�
rrels. Annals and Magazine of Natural History,
20: 426–430.
– 1909. LIV–Twelve new European mammals. Annals
and Magazine of Natural History, 3: 415–422.
– 1912. Catalogue of the Mammals Western Europe:
Europe exclusive of Russia, British Museum.
Nei, M., 1976. Mathematical models of speciation
and genetic distance. In: Population genetics and
ecology: 723. (S. Karlin & E. Nevo, Eds.). Academic
Press, New York.
Oshida, T. & Masuda, R., 2000. Phylogeny and zo�
ogeography of six squirrel species of the genus
Sciurus (Mammalia, Rodentia), inferred from cyto�
chrome b gene sequences. Zoological Science,
17: 405–409.
Oshida, T., Arslan, A. & Noda, M., 2009. Phylogenetic
relationships among the Old World Sciurus squi�
rrels. Folia Zoologica, 58: 14–25.
Palomo, L. J. & Gisbert, J., 2002. Atlas de los Mamíferos Terrestres de España. DGCN–SECEM–
SECEMU, Madrid.
Purroy, F. J., 2014. Ardilla roja – Sciurus vulgaris.
In: Enciclopedia Virtual de los Vertebrados Españoles (A. Salvador & J. J. Luque–Larena, Eds.).
Museo Nacional de Ciencias Naturales, Madrid.
http://www.vertebradosibericos.org/
Shuttleworth, C. M., 2001. Traffic related mortality in a
red squirrel (Sciurus vulgaris) population receiving su�
pplemental feeding. Urban Ecosystems, 5: 109–118.
Sidorowicz, J., 1971. Problems of subspecific taxo�
nomy of squirrel (Sciurus vulgaris L.) in Palaearctic.
Zoologischer Anzeiger, 187: 123–142.
Taberlet, P., Fumagalli, L., Wust–Saucy, A.–G. & Cos�
Lucas et al.
son, J.–F., 1998. Comparative phylogeography and
postglacial colonization routes in Europe. Molecular
Ecology, 7: 453–464.
Takezaki, N. & Nei, M., 1996. Genetic distances and
reconstruction of phylogenetic trees from micro�
satellite DNA. Genetics, 144: 389–399.
Tamura, K., 1992. Estimation of the number of nucleo�
tide substitutions when there are strong transition–
transversion and G + C–content biases. Molecular
Biology and Evolution, 9: 678–687.
Tamura, K. & Nei, M., 1993. Estimation of the number
of nucleotide substitutions in the control region of
mitochondrial DNA in humans and chimpanzees.
Molecular Biology and Evolution, 10: 512–526.
Tamura, K., Stecher, G., Peterson, D., Filipski, A. &
Kumar, S., 2013. MEGA6: Molecular Evolutionary
Genetics Analysis Version 6.0. Molecular Biology
and Evolution, 30: 2725–2729.
Templeton, A. R., 1998. Nested clade analyses of
phylogeographic data: testing hypotheses about
gene flow and population history. Molecular Ecology, 7: 381–397.
Trizio, I., Crestanello, B., Galbusera, P., Wauters, L.
A., Tosi, G., Matthysen, E. & Hauffe, H. C., 2005.
Geographical distance and physical barriers sha�
pe the genetic structure of Eurasian red squirrels
(Sciurus vulgaris) in the Italian Alps. Molecular
Ecology, 14: 469–481.
Valverde, J. A., 1967. Notas sobre vertebrados. III.
Nueva ardilla del SE español y consideraciones
sobre las subespecies peninsulares. Boletín de
la Real Sociedad Española de Historia Natural
(Biol.), 65: 225–248.
Wauters, L. A., Hutchinson, Y., Parkin, D. T. & Dhondt,
A. A., 1994. The effects of habitat fragmentation on
demography and on the loss of genetic variation in
the red squirrel. Proceedings. Biological Sciences
/The Royal Society, 255: 107–111.
Wauters, L. A., Verbeylen, G., Preatoni, D., Martinoli, A.
& Matthysen, E., 2010. Dispersal and habitat cuing
of Eurasian red squirrels in fragmented habitats.
Population Ecology, 52: 527–536.


© Copyright 2026