
Paper - Geotermia.org.mx
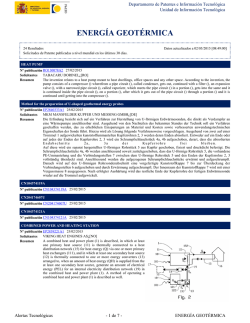
Proceedings World Geothermal Congress 2015
Melbourne, Australia, 19-25 April 2015
Present Situation and Perspectives of Geothermal in Mexico
Luis C.A. Gutiérrez-Negrín1,2, Raúl Maya-González3 and José Luis Quijano-León2
1
Geocónsul, SA de CV, 2Mexican Geothermal Association (AGM), 3Comisión Federal de Electricidad
[email protected], [email protected], [email protected]
Keywords: Direct uses, geothermal development plans, geothermal-electric generation, geothermal production, Mexico, update.
ABSTRACT
Geothermal direct uses in Mexico remains scarcely developed and limited to balneology. The current installed geothermal electric
capacity in the country as of December 2013 is 1,017 MWe, distributed into four geothermal fields in operation. The geothermal
electric running capacity is 839 MWe, since the four oldest units of Cerro Prieto (with a combined capacity of 150 MWe) are out of
operation, along with five of the eight back-pressure units in Los Humeros (25 MWe) and the two only binary cycle units in Los
Azufres (~3 MWe). All of these geothermal fields and power plants remain owned and operated by the state utility CFE (Comisión
Federal de Electricidad). Two additional geothermal projects are currently under construction: Los Azufres III with 50 MWe and
Los Humeros III-A with 27 MWe. During 2013, 28 power plants of condensing, flash and back-pressure type were in operation in
Mexico, producing 6,070 gigawatts-hour (GWh) that represented 2.4% of the total electric output for public service in the country.
An average of 223 production wells were in operation producing 56 million of metric tons of steam accompanied by 67 million
metric tons of brine, at an annual average of 6,358 tons per hour (t/h) of steam. The brine was disposed of by a solar evaporation
pond in Cerro Prieto and by 26 injection wells operating in all the four fields. Two permits for private geothermal electric
developments have been issued for one small-production and one self-supplying project, both located in Nayarit, which are the first
ones in Mexico. It is estimated that more than 14,000 t/h of geothermal fluids in Mexico are utilized for direct uses, with an
installed capacity of 156 MWt for balneology and bathing purposes. There are high expectations for future geothermal development
in Mexico, due to a new regulatory framework of the power and geothermal markets and the foundation of a national geothermal
innovation center (CEMIE-Geo).
1. INTRODUCTION
In the last five years since the previous country update presented in the 2010 World Geothermal Congress (Gutiérrez-Negrín et al.,
2010), things have not changed in regards that geothermal resources in Mexico remain to be almost only utilized to produce
electricity. Direct uses of geothermal energy are still basically limited to bathing and swimming, as shown by the data included in
the following sections.
What has changed, and will continue changing in the next years, is the structure of the power industry in Mexico in general, and of
the geothermal power market in particular. Both are secondary consequences of the so-called Energy Reform passed by the
Mexican Congress in late 2013, which remarkably involves a deep transformation of the oil and gas industry, including the state
companies Petróleos Mexicanos (PEMEX) and Comisión Federal de Electricidad (CFE) in the oil and power industries,
respectively. Although own by the State, both companies will be operative, finance and management autonomous companies that
will compete with private companies in free power and oil national markets. Another change was the issuing of the two first permits
for geothermal power projects in the state of Nayarit, based on the legislation previous to the Energy Reform, which are still in their
exploration and construction stages of development.
Thus, this paper presents the current and projected situation of geothermal energy in Mexico, but also includes some relevant
information about those structural changes in the power and geothermal markets, and how they will probably impact the future
geothermal development in the country.
2. THE POWER MARKET
As of December 2013 the total installed power capacity in Mexico for public service was 53,455 MWe (SENER, 2014a; see Table
1). As indicated in a footnote of the same table, that total does not include 9,020 MWe of additional power own and operated by
PEMEX and private companies for self-supplying and co-generation to satisfy their own electric demand, and/or to export power to
the US and Belize. In the former regulatory context before the Energy Reform, those services were considered as non-public. Thus,
the total electric installed capacity in Mexico in December 2013 was 62,475 MWe, which represents a 4.8% increase over the total
of 59,601 MWe reported five years ago (Gutiérrez-Negrín et al., 2010), or less than 1% yearly in this period.
It is worth mention that the total for public service includes 12,851 MWe in power plants own and operated by 28 independent
power producers (PEE: Productores Externos de Energía) that sell their power production to the CFE by means of long-term power
purchasing contracts, since they were not allowed to negotiate and contract with private costumers. Out of that amount, 12,340
MWe account for 23 gas combined cycle power plants and 511 MWe for five wind power farms (SENER, 2014a).
As indicated in Table 1, more than two thirds of the installed capacity for the electric public service in Mexico (68.3%) is based on
fossil-fueled power plants (hydrocarbons and coal), and more than one fifth (21.52%) on hydroelectric plants. Geothermal electric
capacity represents 1.5% and other renewables (wind and solar photovoltaic) only 1.1%. The rest (2.6%) is represented by nuclear
power plants (Fig. 1).
1
Gutiérrez-Negrín et al.
Electric generation for public service in Mexico in 2013 was 257,860 GWh (SENER, 2010a), as reported in Table 1. This is 10.2%
higher than generation reported five years ago (234,096 GWh). More than four fifths (81.2%) of the electric energy produced for
public service in Mexico that year came from power plants fueled by hydrocarbons and coal, only 10.6% was produced by
hydroelectric plants, 4.6% by nuclear power plants, 2.5% by geothermal electric plants and 0.7% by wind and solar resources, as
deduced from Table 1 (Fig. 1). Thus, while the installed capacity from fossil fuels in the country reduced from 73.1% in 2008 to
68.3% in 2013, the power generation increased from 76.1% to 81.2% in the same period (Gutiérrez-Negrín et al., 2010). Regarding
geothermal, it is important to highlight the fact that while the installed capacity was only 1.5% of the total in 2013, its electric
outcome was 2.4% (Fig. 1).
Table 1: Present and planned production of electricity.
Geothermal
Capacity
MWe
In operation in
December 2013
Gross
Capacity
Prod.
MWe
GWh/yr
1,017.4 6,069.7 38,925.4
Under construction
in December 2013
77.0
Funds committed,
but not yet under
construction in
December 2013
0.0
Estimated total
projected use by
2020**
Fossil Fuels
1,395.4
Gross
Prod.
GWh/yr
Hydro
Capacity
MWe
210,718.9 11,508.8
Gross
Prod.
GWh/yr
27,444.1
Nuclear
Capacity
MWe
Gross
Prod.
GWh/yr
1,400.0 11,799.9
Other Renewables
(Wind + solar)
Capacity
MWe
603.6
Total*
Gross
Capacity
Prod.
MWe
GWh/yr
1,827.0
53,455.1
1,762
0
0
102
1,941
49,304
13,609
1,400
3,008
68,716
Gross
Prod.
GWh/yr
257,859.6
*Total for public service, not including 9,020 MWe (as of December 2013) of installed capacity for self-supplying, co-generation, and export, considered as non-public.
**It considers dismantling of some currently installed power units between 2015-2020. It does not include estimates for non-public service of 15,164 MW in addition to estimated totals in 2020.
According to the Energy Secretary (SENER, 2014a), by December 2013 there were several power plants under construction to be
commissioned in 2014 through 2020, with a combined capacity of 1,941 MWe, as reported in Table 1. Two of these plants are
geothermal electric, one of 50 MWe in the Los Azufres geothermal field (project Los Azufres III-phase 1) and the other in Los
Humeros (project Los Humeros II-phase A, with 27 MWe gross) (see also Table 2). There is one wind project of 102 MWe (project
Sureste I, second phase, in Oaxaca), and the remaining 1,762 MWe are composed of four projects of combined cycle and three of
internal combustion in the states of Baja California, Baja California Sur, Guanajuato, Morelos and Sonora.
Figure 2: Breakdown of total electric installed capacity (left) and total power generation (right) by energy source in Mexico
in 2013.
For geothermal, the projected use in 2020 (Table 1) is 1,395 MWe of running capacity. This is composed of 715 MWe in Cerro
Prieto, which in turn are composed of 570 MWe currently running plus the 100-MWe Cerro Prieto V project and a binary-cycle
project of 45 MWe. It also includes 306 MWe in Los Azufres resulting from 191 MWe currently running plus Los Azufres III and
Los Azufres IV projects with 75 MWe each, minus all the 5-MWe each back pressure units currently in operation. Estimated use in
2020 also includes 107.4 MWe in Los Humeros, composed of the two operating 26.7-MWe each power units and other two 27
MWe power units of the projects Los Humeros III, phases A and B, and considers dismantling all the back-pressure units (Table 2).
It also considers 12 MWe in the Las Tres Vírgenes geothermal field, as well as an estimate of 50 MWe in the Domo San Pedro
field, 100 MWe in El Ceboruco Volcano, both in the state of Nayarit, and another 30 MWe in other zones to be developed by the
CFE and/or private developers, according to the new geothermal law to be commented below.
2
Gutiérrez-Negrín et al.
The estimated geothermal electric deployment in 2020 represents an increase of 378 MWe over the current installed capacity, or
around 37%, which may look very optimistic, since between 2009 and 2013 the actual increase of geothermal power in Mexico was
only 59 MWe, or around 6% along the period (just 1% yearly). And if we consider not the installed capacity but the running
capacity, there was a net decrease of 12.5%, from 958 MWe in 2008 to 839 MWe (see Gutiérrez-Negrín et al., 2010, and Table 2).
However, the high perspectives commented in the last part of this paper makes probable such deployment.
Table 2: Utilization of geothermal energy for electric power generation as of 31 December 2013.
Locality
Power
Plant
Name
Year
Commissioned
CP-I U-1
U-2
U-3
U-4
U-5
CP-II U-1
U-2
Cerro Prieto
CP-III U-1
U-2
CP-IV U-1
U-2
U-3
U-4
Mexicali
U-2
U-3
U-4
U-5
U-6
U-7
U-9
U-10
Los Azufres
U-11
U-12
U-13
U-14
U-15
U-16
AZ III-1
AZ III-2
AZ IV
U-1
U-2
U-3
U-4
U-5
U-6
Los Humeros
U-7
U-8
HUM II-A
HUM II-B
HUM III-A
HUM III-B
U-1
Las Tres
U-2
Vírgenes
U-3
Cerritos
U-1
U-2
Colorados3)
Other zones
Total
1973
1973
1979
1979
1982
1986
1987
1986
1987
2000
2000
2000
2000
2018
1982
1982
1982
1982
1986
1988
1990
1992
1993
1993
2003
2003
2003
2003
2015
2018
2020
1990
1990
1991
2003
1991
1992
1994
2008
2012
2013
2016
2018
2002
2002
No. of
Units
Type of
Status1)
1
1
1
1
1
1
1
1
1
1
1
1
1
4
1
1
1
1
1
1
1
1
1
1
1
1
1
1
1
1
1
1
1
1
1
1
1
1
1
1
1
1
1
1
1
1
1
1
Unit2)
N
N
N
N
1F
1F
1F
1F
2F
2F
2F
2F
2F
1F
1F
1F
1F
1F
O
O
O
O
O
1F
O
O
B
B
1F
1F
1F
1F
1F
1F
1F
O
O
O
O
O
O
O
O
1F
1F
1F
1F
1F
1F
B
1F
1F
N
N
N
N
N
N
N
Total
Installed
Capacity
(MWe*)
Total
Running
Capacity
(MWe*)
37.5
37.5
37.5
37.5
30.0
110.0
110.0
110.0
110.0
25.0
25.0
25.0
25.0
0.0
0.0
0.0
0.0
30.0
110.0
110.0
110.0
110.0
25.0
25.0
25.0
25.0
0.00
0.00
0.00
0.00
251.04
875.01
696.60
835.58
602.22
164.04
225.43
237.14
239.96
5.0
5.0
5.0
5.0
5.0
50.0
5.0
5.0
1.5
1.5
26.5
26.5
26.5
26.5
5.0
5.0
5.0
5.0
5.0
50.0
5.0
5.0
0.0
0.0
26.5
26.5
26.5
26.5
42.58
40.61
44.09
43.63
43.64
386.12
43.60
43.23
0.00
0.00
207.41
202.81
211.91
232.76
100.0
50.0
25.0
75.0
5.0
5.0
5.0
5.0
5.0
5.0
5.0
5.0
26.7
26.7
0.0
0.0
5.0
0.0
0.0
5.0
0.0
5.0
26.7
26.7
5.0
5.0
1,017.4
2) B: Binary, 1F: Single flash, 2F: Double flash, O: Other (back -pressure)
3) Formerly k nown as La Primavera.
3
0.00
0.00
42.08
4.53
0.00
25.96
4.87
42.24
226.1
0.0
27.0
27.0
5.0
5.0
839.4
* Installed capacity is maximum gross output of the plant; running capacity is the actual gross being produced.
1) N: Not operating (temporarily). Blank if presently operating.
Annual
Total
Energy
under
Produced Constr. or
in 2013
Planned
(GWh)
(MWe)
28.97
25.60
6,069.7
2.0
25.0
50.0
60.0
441.0
Gutiérrez-Negrín et al.
The total power capacity estimated in Mexico in 2020 is 83,880 MWe, composed of 68,716 MWe for the former public service plus
15,164 MWe for the non-public service (Table 1; see also the second footnote), although for that year there will not be this
difference anymore.
3. GEOTHERMAL POWER
No additional geothermal field was incorporated to production in Mexico in the last five years. Thus, there are four fields in
production, Cerro Prieto, Los Azufres, Los Humeros and Las Tres Vírgenes (Fig. 2), with an installed capacity of 1,017.4 MWe and
a running or operating net capacity of 839.4 MWe. All these fields and the power units installed in them belong to the CFE and are
managed and operated by CFE’s personnel. Power plants in operation produced 6,069.7 GWh in 2013 (Tables 1 and 2),
representing an average annual capacity factor of 68.1% considering the installed capacity, or 82.5% taking into account the
running or effective capacity. The geothermal electric output in those fields was 13.8% lower than five years ago, when 7,047 GWh
were produced in the same four fields (Gutiérrez Negrín et al., 2010).
Figure 2: Geothermal fields in Mexico.
As shown in Table 2, the main difference between the installed and running capacity lies in Cerro Prieto. There are 13 power units
installed in this field, all of condensing, flash type. However, the four oldest 37.5 MWe units commissioned in 1973 and 1979 (see
Table 2) in the sector known as Cerro Prieto I have been out of operation since 2011 and 2012 due to their high specific
consumption of steam, combined with the shortage of available steam in the field, which is preferred for supplying the most recent
and efficient power units.
Cerro Prieto is the oldest and still the largest Mexican geothermal field in operation. It is located in the northern part of Mexico
(Fig. 2), lying into a pull-apart basin formed as result of two active strike-slip faults from the San Andreas Fault System, at just a
few meters above the sea level (masl). The heat source seems to be a basic intrusion producing a thermal anomaly, which in turn
has been produced by the thinning of the continental crust in the basin. A sequence of sedimentary rocks (sandstones interbedded
into shales) with a mean thickness of 2,400 meters are hosting the geothermal fluids.
During the last 50 years or so, 429 geothermal wells have been drilled in Cerro Prieto, with a mean depth of 2,430 meters and
maximum depth of 4,400 m. On average, 158 production wells were in operation during 2013 producing 34.6 million of metric tons
of steam, at an annual average rate of 3,948 tons per hour (t/h). Five years ago the steam produced in this field was 45.9 million
tons, at 5,244 t/h (Gutiérrez-Negrín et al., 2010), and then the steam availability has decreased in 24.6%, which explains why four
power units have been out of operation. Consequently the electric output of the field dropped from 5,176 GWh in 2008 to 4,127
GWh in 2013 (see Gutiérrez-Negrín et al., 2010, and the last column of Table 2).
The annual average production rate per well in Cerro Prieto in 2013 was 25 t/h, around 20% lower than five years ago (31.3 t/h) and
36% lower than the average annual rate in 2003 (39.3 t/h) (Gutiérrez-Negrín et al., 2010). There were also 17 injection wells
operating in the field to partially dispose of 59.8 million tons of separated brine. Most of the brine was disposed of in the solar
evaporation pond. According to the steam and electric output produced in Cerro Prieto, the gross steam specific consumption was
of 8.47 tons per MWh, which is slightly better than the figure for 2008 (8.82 tons per MWh).
The Los Azufres geothermal field is located in the central part of the country, 250 km away from Mexico City (Fig. 2), and lies
within the physiographic province of the Mexican Volcanic Belt at an altitude of around 2,800 masl. The installed capacity is 194
MWe composed of one 50-MWe condensing, flash power unit, four 26.5 MWe flash units, seven 5-MWe back-pressure and two
1.5-MWe binary cycle power units (Table 2). The two binary cycle units are out of operation, and then the running capacity is 191
MWe (Table 2). Generation of electricity in 2013 was 1,542 GWh, at an annual capacity factor of 92.2%. This is almost the same
electric output reported five years ago (1,517 GWh), and is perhaps worthy of mention that the installed capacity is also the same in
spite it was reported 188 MWe (Gutiérrez-Negrín et al., 2010). The difference is because 188 MWe is the net capacity (meaning the
energy capable to be delivered to the grid) and 194 MWe is the gross capacity.
4
Gutiérrez-Negrín et al.
The Los Azufres geothermal fluids are hosted by volcanic rocks, mainly andesites, with secondary permeability produced by three
fault systems, the most important of which presents E-W trend and controls the movement of the subsurface fluids. The magma
chamber of the nearby San Andrés volcano –the highest peak in the area—has been deemed as the heat source of the geothermal
system.
Thirty-nine production wells were in operation in the Los Azufres field in 2013, producing 14.9 million tons of steam, at an annual
average rate of 1,695 t/h. The annual mean production per well was 43.8 t/h. The gross specific consumption by the Los Azufres
power units was 9.72 tons of steam per MWh, as an annual average. The produced steam was accompanied by 4.5 million tons of
brine that was fully injected into the reservoir through 6 injection wells. All production data in Los Azufres during 2013 are similar
to those reported five years ago (Gutiérrez-Negrín et al., 2010), which indicates a steady behavior of the system and a careful
management of the geothermal resource. One additional 50 MWe flash unit is currently under construction, programed to be
commissioned in early 2015. When this occurs, four of the seven currently operating back-pressure units are planned to be placed
out of production. Thus the net addition of power will be 30 MWe, and the available steam will be more efficiently used.
The Los Humeros field is also of volcanic type and located in the central part of Mexico, at the eastern end of the Mexican
Volcanic Belt (Fig. 2). The field is placed within a Quaternary caldera (Caldera de Los Humeros) at 2,600 masl. The geothermal
fluids are contained in andesites that overlie a complex basement composed of metamorphic, sedimentary and intrusive rocks. The
heat source is the magma chamber that produced the Los Humeros and Los Potreros calderas, being the latter nested in the first one.
The last volcanic activity has been dated in around 20,000 years ago.
The installed capacity in the field is 93.4 MWe composed of two flash units of 26.7 MWe each, and eight back-pressure units of 5
MWe each. However, five of the latter remain in stand-by to be used only when the flash units are out of service, and then the
running or operative capacity is 68.4 MW. The second 26.7-MWe unit started to operate by the end of 2013, what explains why
there was no electric output in 2013 (Table 2).
The steam produced in Los Humeros in 2013 was 5.47 million of metric tons at an annual mean rate of 624 t/h. Each of the 23
production wells in operation produced an average of 27.4 t/h of steam. The wells also produced 0.7 million tons of brine that was
fully injected into the reservoir through two injection wells. With that amount of steam, the power units operating in Los Humeros
produced 345.8 GWh. This represents an annual capacity factor of 94.7%, considering that just one 26.7 MWe power unit was in
operation all the year, and annual steam specific consumption of 15.8 tons per MWh. In general, the production conditions in this
field were better in 2013 than in 2008 (Gutiérrez-Negrín et al., 2010), since the steam produced was 13.2% higher and the electric
output was 10.3% higher.
In the middle of the Baja peninsula is located the Las Tres Vírgenes geothermal field, the smaller and more recent of the fields
operating in Mexico (Fig. 2). The field is inside a Quaternary volcanic complex composed of three N-S aligned volcanoes. The
geothermal fluids are hosted by intrusive rocks (granodiorite) and the heat source of the system is related to the magma chamber of
the La Virgen volcano, the youngest and most southern of the volcanic complex.
There are only two condensing, flash 5-MWe each power units in Las Tres Vírgenes, which produced 54.6 GWh in 2013 at annual
average capacity factor of 62.3%. This is the lowest capacity factor of geothermal plants in Mexico, yet represents an important
improvement over the 47% obtained five years ago (Gutiérrez-Negrín et al., 2010) in the same field. Four production and one
injection wells were operating in the field, with output of 0.8 million tons of steam and 2.4 million tons of brine. Production wells
produced 24 t/h of steam and 69 t/h of brine on average along the year. The gross specific consumption in the field was 14.4 tons
per MWh.
To take advantage of the huge production of hot brine in this field, CFE has planned to install a 2-MWe binary cycle power unit
(Table 2).
Main data on geothermal production in Mexico in 2003, compared with similar data in the last 18 years are presented in Table 3
(some data taken from Hiriart-Le Bert and Gutiérrez-Negrín, 1996, and Quijano-León and Gutiérrez-Negrín, 2000).
Table 3: Main data on geothermal-electric production in Mexico in the last 18 years.
Data
1995
1999
2003
2008
2013
Installed capacity (MW)
753
755
953
958
1,107
Running capacity (MW)
753
755
953
958
839
Electricity output (GWh)
5,682
5,619
6,282
7,047
6,070
Annual average capacity factor (%)
86.1
85.9
74.5
84.0
82.5*
Steam produced (million metric tons)
55.0
56.3
67.5
65.9
55.7
Annual average steam specific consumption (tons/MWh)
9.7
10.0
10.7
9.35
9.27
Production wells (number)
173
164
197
229
223
Average steam produced per well (t/h)
36.3
39.2
39.1
32.8
28.5
5
Gutiérrez-Negrín et al.
It can be noted that while the installed capacity increased in the last five years, the running capacity dropped around 12%, mainly
due to the shortage in the steam availability in the Cerro Prieto field, which forced CFE to put out of service the oldest plants.
Regardless, the electrical output is comparable to that obtained 10 years ago. Thus, the available steam seems to have been used
more efficiently to produce electricity, as reflected by the gross specific consumption of steam that is slightly better than in 2008
and the lowest (9.27 tons per MWh) since 1995.
Seventy-nine geothermal wells were drilled in Mexico for geothermal electric purposes in the period 2009-2013, as shown in Table
4. All but five were production wells drilled by the CFE in the four geothermal wells in operation, with a combined length of 204.2
km. Five exploration wells were drilled in the geothermal areas of Tulecheck, Baja California, and Domo San Pedro, Nayarit, with
approximate combined length of 12.2 km (Table 4). It can be assumed there were no wells drilled for direct uses in the period, since
most of the bathing facilities use thermal water from hot springs and only exceptionally from hot-water wells constructed with other
purposes.
Table 4: Geothermal wells drilled in Mexico from January 1, 2009 to December 31, 2013.
Purpose
Wellhead
Temperature
Exploration1)
(all)
o
>150 C
Production
Total Depth
(km)
5
0
0
0
12.197
74
0
0
0
204.181
0
79
0
0
0
0.000
216.378
150-100o C
Injection
Total
1)
Number of Wells Drilled
Direct
Combined
Other
Use
(specify)
Electric
Power
<100o C
(all)
Include thermal gradient wells, but not ones less than 100 m deep.
The geothermal-drilling activity in Mexico was concentrated in the Cerro Prieto field, where 60 production wells with a total depth
of 177.2 km were constructed in the period (87% of the total). The average depth of each production well drilled in Cero Prieto in
these years was 2,954 meters. Nine production wells were constructed in Los Azufres, four in Los Humeros and one in Las Tres
Vírgenes. Average depths in these fields were 1,817, 2,023 and 2,505 meters, respectively.
Considering the drilling data reported in 2010 (Gutiérrez-Negrín et al., 2010), the accumulative total number and depth of
geothermal wells drilled in Mexico up to 2013 is presented in Table 5. Other zones include the following: San Marcos, Jal., Volcán
Ceboruco, Nay., Laguna Salada, BC, Acoculco and Las Derrumbadas, Pue., Los Negritos, Mich., San Antonio El Bravo and
Maguarichic, Chih., Aguacaliente, El Centavito and Santispac, BCS, Santiago Papasquiaro, Dgo., Pathé, Hgo., Tulecheck, BC., and
Domo San Pedro, Nay.
Table 5: Geothermal wells drilled in Mexico from 1963 to December 31, 2013.
Field
Number of wells
Depth (km)
Total
Average
Cerro Prieto
429
1,045.6
2.437
Los Azufres
94
150.3
1.598
Los Humeros
47
102.0
2.171
Las Tres Vírgenes
11
22.4
2.039
Cerritos Colorados
13
23.1
1.778
Other zones
41
60.8
1.484
Total
635
1,404.3
2.212
4. GEOTHERMAL DIRECT USES, HUMAN RESOURCES AND INVESTMENTS
As mentioned before, direct uses of geothermal resources in Mexico are scarcely developed. They are mainly bathing and
swimming facilities with recreational and in some cases therapeutic purposes. Table 6 presents an updated estimate on geothermal
baths and swimming facilities in Mexico, which have been developed and are operated by private investors. There are some
facilities operated by federal, state or municipal governments, through their tourism offices or, in some cases, through federal
institutions like the national social security institute.
6
Gutiérrez-Negrín et al.
Data included in the Table 6 were originally estimated in 1999 (Quijano-León and Gutiérrez-Negrín, 2000), based on the regional
reconnaissance of geothermal resources in Mexico made by the CFE in 1980 through 1990. The geothermal resources used for
bathing, swimming and balneology were grouped for states since so were explored by the CFE. Some information about the annual
average flow was recently updated.
Table 6: Utilization of geothermal energy for direct heat as of 31 December 2013 (other than heat pumps).
Maximum Utilization
Locality
Los Azufres, Mich.
Los Azufres, Mich.
Los Azufres, Mich.
Los Azufres, Mich.
La Primavera, Jal.
Aguascalientes*
Chiapas*
Chihuahua*
Coahuila*
Durango*
Guanajuato*
Hidalgo*
Jalisco*
México*
Michoacán*
Morelos*
Nuevo León*
Querétaro*
San Luis Potosí*
Sinaloa*
Tlaxcala*
Veracruz*
Zacatecas*
TOTAL
o
2)
Type1) Flow Rate Temperature ( C) Enthalpy (kJ/kg)
(kg/s)
Inlet
Outlet
Inlet
Outlet
A
0.100
77.0
60.0
B
38.000
72.0
55.0
G
0.050
60.0
40.0
H
4.583
110.0
86.0
B
63.000
48.0
31.0
B
265.000
43.0
30.0
B
1,000.000
36.0
29.0
B
38.000
39.3
25.0
B
56.000
32.0
25.0
B
34.000
52.5
38.0
B
293.000
40.8
29.0
B
271.000
41.5
32.0
B
368.000
37.8
30.0
B
103.000
35.1
25.0
B
161.000
44.5
33.0
B
95.000
45.0
30.0
B
295.000
38.0
30.0
B
770.000
31.8
26.5
B
292.000
36.8
31.0
B
7.000
72.5
61.0
B
10.000
35.0
28.0
B
42.000
65.0
48.0
B
163.000
36.6
28.5
4,368.733
47.1
Annual Utilization
Capacity 3)
Ave. Flow
Energy 4) Capacity
(MWt)
Factor5)
(kg/s)
(TJ/yr)
0.007
0.030
0.067
0.300
2.703
34.960
78.391
0.920
0.004
0.011
0.028
0.210
0.460
1.389
4.397
0.303
4.481
58.650
131.511
0.931
14.414
194.139
332.890
0.732
29.288
847.656
782.640
0.847
2.274
29.680
55.982
0.781
1.640
33.390
30.829
0.596
2.063
15.975
30.553
0.470
14.466
254.232
395.692
0.867
10.772
250.800
314.265
0.925
12.010
316.350
325.467
0.859
4.353
95.424
127.123
0.926
7.747
152.785
231.752
0.949
5.962
74.580
147.557
0.785
9.874
250.700
264.539
0.850
17.075
697.174
487.373
0.905
7.086
233.888
178.929
0.801
0.337
4.601
6.979
0.657
0.293
8.308
7.671
0.831
2.987
39.328
88.185
0.936
5.524
138.700
148.186
0.851
35.5
155.819
3,732.748
4,171.004
* It is included the estimated total flow rate of all the bathing sites in the state, and the average inlet & outlet temperature.
1)
Type: A: Agricultural drying, B: Bathing and swimming, G: Greenhouses, H: Individual space heating (other than heat pumps).
2)
Enthalpy information is given only if there is steam or two-phase flow.
3)
Capacity (MWt) = Maximum flow rate (k g/s) x [inlet temperature (°C) - outlet temperature (°C)] x 0.004184
4)
Energy use (TJ/yr) = Average flow rate (k g/s) x [inlet temperature (°C) - outlet temperature (°C)] x 0.1319
5)
Capacity factor = [Annual Energy Use (TJ/yr)/Capacity (MWt)] x 0.03171.
Table 7: Summary table of geothermal direct heat uses as of 31 December 2013.
Installed Capacity
(MWt)
Annual Energy Use
(TJ/yr)
Capacity Factor
1)
Individual Space Heating
0.460
4.397
0.303
District Heating
Air Conditioning (Cooling)
Greenhouse Heating
Fish Farming
Animal Farming
0.000
0.000
0.004
0.000
0.000
0.000
0.000
0.028
0.000
0.000
0.000
0.000
0.210
0.000
0.000
Agricultural Drying2)
0.007
0.067
0.300
Industrial Process Heat
Snow Melting
0.000
0.000
0.000
0.000
0.000
0.000
Bathing and Swimming7)
Other Uses (specify)
Subtotal
Geothermal Heat Pumps
TOTAL
155.347
0.000
155.819
0.000
155.819
4166.512
0.000
4171.004
0.000
4171.004
0.850
0.000
0.849
0.000
0.849
Use
1)
Other than heat pumps.
2)
Includes drying or dehidratation of grains, fruits and vegetables.
3)
Includes balneology.
Definitions and calculations of installed capacity, annual energy use and capacity factor as in Table 6.
7
0.849
Gutiérrez-Negrín et al.
The only known direct uses of geothermal resources other than bathing and swimming were developed by the CFE in the Los
Azufres geothermal field. These projects represent an installed capacity of 0.47 MWt and an annual energy use of 4.5 TJ/year
(Table 7). There are no known geothermal heat pumps in operation in the country, yet a couple of housing projects in some extreme
climate regions of the country are planning the use of GHP.
Thus, it can be summarized that Mexico has around 4,369 kg/s (15,727 t/h) of geothermal resources flowing at the surface with
average superficial temperature of 47°C, out of which 3,733 kg/s (14,438 t/h) are utilized for direct uses, with an installed capacity
of 155.8 MWt, with a mean capacity factor of 0.85 and an annual utilization of 4,171 TJ/year (Tables 6 and 7).
Table 8 reports the personnel with a university degree allocated to geothermal activities and its variations during the last five years.
Professionals working for the government are mainly in the federal Secretary of Energy. They do regulatory activities and have not
been involved only in geothermal but in renewable energy sources. The second column in Table 8 reports the CFE personnel
working in its geothermal division (Gerencia de Proyectos Geotermoeléctricos). The total manpower of this division was around
850-900 persons in the last five years. Data for 2014 are estimated.
Column 3 in Table 8 reports the amount of professionals working mainly in the geothermal division of the electric research institute
(IIE, Instituto de Investigaciones Eléctricas), in some universities like UNAM, the center of scientific research and high studies of
Ensenada (CICESE), and the Michoacán and Baja California universities. It can be noted a significant increase in 2013 and
particularly in 2014 due to the formation of the Mexican Center for Innovation in Geothermal Energy (CEMIE-Geo), as
commented below.
The professional personnel working in the private industry is reported in the column 6 of Table 8. Up to 2011 these professionals
were mainly concentrated in drilling companies and few in consulting companies. In the last three years, however, it has been an
important increase in consulting and developing companies involved in the first private geothermal projects in Mexico.
Table 8: Allocation of professional personnel to geothermal activities (restricted to personnel with university degrees).
Year
(1)
2010
2011
2012
2013
2014
Total
6
7
7
7
8
35
Professional Person-Years of Effort
(2)
(3)
(4)
(5)
105
25
0
0
107
24
0
0
105
26
1
0
105
30
1
0
105
40
0
0
527
145
2
0
(6)
21
23
26
50
70
190
(1) Government, (2) Public utilities, (3) Universities, (4) Paid foreign consultants,
(5) Contributed through foreign aid programs, (6) Private industry.
Estimated investments in Mexico for geothermal development over the last twenty years are shown in Table 9. Figures for the
periods 1995-1999, 2000-2004 and 2005-2009 are the same reported five years ago (Gutiérrez-Negrín aet al., 2010), updated to
2014 USD. The amounts reported for the last five years in the first column are substantially higher than in the previous periods
(more than four times), although the total investment is comparable to the figure reported for 2000-2004. The main causes for that
remarkable increase in exploration investments in Mexico are the exploration activities (including drilling) by private developers in
2012-2014, and the programed investments in new innovation projects to be developed in its first year (2014) by the CEMIE-Geo
center.
Table 9: Total investments in geothermal in (2014) US$.
Research &
Period
1995-1999
2000-2004
2005-2009
2010-2014
1)
Development1)
Million US$
7.41
11.61
15.65
64.61
Field Development
Utilization
Including Production
Direct
Electrical
Million US$
Million US$ Million US$
246.64
254.05
315.17
326.77
237.69
253.34
265.67
330.28
Funding Type
Private
Public
%
%
100
100
100
5
95
This column includes surface exploration and exploration drilling.
5. THE NEW GEOTHERMAL FRAMEWORK IN MEXICO
In late December 2013 the amendment of three constitutional articles was passed by the Mexican federal and states congresses,
regarding the oil and electric sectors in the country. This was known as the Energy Reform and gave place later to a series of 21
legislative initiatives composed of 9 new laws and 21 reforms to pre-existing laws in the energy sector, and in related areas like
federal financing, incomes and taxes and the structure of the federal administration. Two of the new laws are the electric industry
8
Gutiérrez-Negrín et al.
act (LIE: Ley de la Industria Eléctrica) and the geothermal act (LEG: Ley de Energía Geotérmica) (SENER, 2014b), that were
approved in August 2014.
The main change implied by of the new LIE is the creation of a free power market in Mexico. Before the LIE, the CFE was a
vertically integrated utility in charge of generation, dispatch, transmission, distribution and commercialization of the electric
energy. The old Law of Public Service of Electric Energy allowed, among other things, the construction and operation of power
units by private investors (PPE) who had to sell all the energy to the CFE through long-term contracts. Although that used to be a
good deal for PPEs, they were not allowed to make other arrangements with private consumers –or offer their output in a public
market, which didn’t exist.
Besides the PPEs, the former law also allowed the formation and operation of private self-suppliers, co-generators, small producers,
exporters and importers of electricity. All these legal figures, including PPEs, were not considered as public service, and all they
needed to do was to apply and eventually get a grant or concession from the regulatory energy commission (CRE: Comisión
Reguladora de Energía). Although most of those private generators could sell their excess power to CFE, and purchase power from
CFE when necessary, the bulk of their output was for their specific business.
Thus, the new LIE defines the main characteristics of a wholesale public power market that will be managed and controlled by the
National Center of Energy Control (CENACE). CENACE was the area of CFE in charge of the electricity dispatch, and now is an
autonomous entity that rules and operates the market. The CFE, private generators, private co-generators, representatives of
generators, and private commercial participants will participate on the spot and/or the auction market, which is supposed to lower
the tariffs. The LIE provides the registration of qualified users who can also participate in the market or sign long-term power
purchase agreements with any generator or commercial operator. The CFE and private investors will operate and maintain the
national transmission and distribution grid, and the CFE will continue providing the final service to domestic and small consumers,
that now are called basic users. CFE will provide this service at fixed tariffs.
On the other hand, the new geothermal act (LEG) divides the process of geothermal development into three successive stages:
reconnaissance, exploration and exploitation, for whose implementation it is necessary first to obtain a registration, permit or
concession, respectively, issued by the Ministry of Energy (SENER). The registration for reconnaissance is valid for eight months,
and after six months technical and financial reports shall be submitted to the SENER in order to apply for an exploration permit in
the same geothermal area.
The exploration permit shall be issued for three years and, only once, may be extended three more years. The licensee shall drill
and complete one to five exploration wells –the final number will be defined by SENER depending on the extent of the area. In
other fields, e.g. hot dry rock, SENER will determine whether and how many exploratory wells must be drilled. The licensee will
have exclusive rights to explore the permit area, which will be a maximum of 150 km2.
The holder of the exploration permit can apply for an exploitation concession in the area, if results are successful. If the concession
is granted, the concessionaire will have a maximum of three years to get the other authorizations, particularly the environmental
licenses and the grant for using geothermal waters. The exploitation concession is valid for 30 years, and can be extended by the
SENER. Where geothermal resources are extended to other geothermal areas and both are subject to a different concession holders,
it may be agreed a joint operation, prior authorization from SENER.
Neither the exploration permit or exploitation concession can be sold, this being a cause for revocation. But both can be assigned
under permission by SENER. The SENER might launch a public tender of an exploitation concession, when the concessionaire
notifies that it cannot meet the terms and conditions of the grant. Areas subject to early termination, revocation or forfeiture of title
could also be subject to public bid.
The CFE may participate and be associated with the winner of the exploitation concessions, and when this paper was written was
preparing its request for all the geothermal areas it wishes to continue doing work of exploration or exploitation, including the four
geothermal fields in operation. It is expected that SENER will review CFE’s request and award the proper concessions and permits
by the first quarter of 2015. In all private geothermal projects started when the act was passed, the developers will have the
preferential right to request the proper permit or concession.
Last but not least, it is worth to mention the recent foundation in February 2014 of the Mexican Center for Innovation in
Geothermal Energy (CEMIE-Geo: Centro Mexicano de Innovación en Energía Geotérmica). The center is a consortium composed
of 22 entities headed by CICESE (The Center for Scientific Research and High Studies of Ensenada). Twelve members are public
research institutes and universities, nine are private companies, and the 22nd entity is CFE. A steering group (Grupo Directivo) was
formed, composed of three representatives from private companies, six representatives from the academia and one from CFE. The
CEMIE-Geo is not intended to have any physical offices, labs or administrative structure, but use the infrastructure of its 22 parties.
In the following four years (2014-2017) the CEMIE-Geo will conduct 30 research and innovation geothermal projects, which
encompass improvements in exploration tools and methods, Mexico’s EGS potential, development and testing of direct-use
prototypes, improvement of conduction pipes and turbine materials, and specific studies in geothermal areas. All the 30 projects
have been defined, described, programmed, scheduled and budgeted. The total for all the projects is around US$ 87 million, $74
million of which (88%) is provided by the federal government and the rest by the private companies as in-kind contributions. All of
the projects must be finished by early 2018 when CEMIE-Geo must seek its own resources to survive. There are also a couple of
transversal projects, one to install or complete some laboratories for geothermal activities and the other to develop human resources
through a program of training and diplomas geothermal courses to be offered in the universities and institutes.
In conclusion, the new regulatory framework of the power market in general and the geothermal market in particular, the
foundation and operation of the CEMIE-Geo, combined with the maturity of the conventional hydrothermal technology in Mexico,
9
Gutiérrez-Negrín et al.
are sufficient elements to produce exciting perspectives and high expectations for the Mexican geothermal development in the
following years.
REFERENCES
Gutiérrez-Negrín, L.C.A., Maya-González, R., and Quijano-León, J.L.: Current Status of Geothermics in Mexico, Proceedings
World Geothermal Congress 2010, Bali, Indonesia, 25-29 April 2010 (2010).
Hiriart-Le Bert, G., and Gutiérrez-Negrín: Geothermal Electric Development Program in Mexico, Transactions of the Geothermal
Resources Council, Vol. 20, (1996) 581-586.
Quijano-León, J.L. and Gutiérrez-Negrín, L.C.A.: Geothermal Production and Development Plans in Mexico, Proceedings World
Geothermal Congress 2000, Kyushu-Tohoku, Japan, May 28-June 10, 2000 (2000).
SENER (Energy Secretary): Subsecretaría de Electricidad. Estadísticas del Sector Eléctrico (2014a). Information available at
http://egob2.energia.gob.mx/portal/electricidad.html, consulted May 12, 2014.
SENER (Energy Secretary): Iniciativas de leyes secundarias. Electricidad (2014b). Information
http://www.energia.gob.mx/webSener/leyes_Secundarias/Seg_nivel_Elect.html, consulted May 12, 2014.
10
available
at


© Copyright 2026