
Las pernoctaciones en alojamientos turísticos extrahoteleros
29 de enero de 2016
Encuestas de ocupación en alojamientos turísticos extrahoteleros
Diciembre 2015 y año 2015. Datos provisionales
Las pernoctaciones en alojamientos turísticos extrahoteleros
aumentan un 8,3% en diciembre respecto al mismo mes de 2014
En el conjunto de 2015 las pernoctaciones en alojamientos
turísticos extrahoteleros alcanzaron la cifra de 113,8 millones, un
4,7% más que en el año anterior
Las pernoctaciones en alojamientos turísticos extrahoteleros (apartamentos, campings,
alojamientos de turismo rural y albergues) superan los 5,7 millones en diciembre, un 8,3%
más que en el mismo mes de 2014. Las pernoctaciones de residentes aumentan un 16,6% y
las de no residentes un 5,0%.
La estancia media es de 5,4 pernoctaciones por viajero.
Los viajeros y pernoctaciones en los alojamientos turísticos colectivos extrahoteleros
durante el mes de diciembre son:
December 2015
Residents in Spain
EU (not including Spain)
Rest of the world
TOTAL
Travellers
611,431
362,292
76,212
1,049,935
Overnight stays
1,745,056
3,400,079
569,500
5,714,635
Apartamentos turísticos
Las pernoctaciones en apartamentos turísticos aumentan un 7,7% en diciembre. Las de
residentes suben un 26,0% y las de no residentes un 4,0%.
La estancia media baja un 6,0% respecto a diciembre de 2014, situándose en 6,6
pernoctaciones por viajero.
En diciembre se ocupan el 35,2% de las plazas ofertadas por los apartamentos turísticos, un
5,9% más que en el mismo mes de 2014. El grado de ocupación por plazas en fin de
semana se sitúa en el 36,1%, con un incremento del 2,9%.
EOAT-DICIEMBRE 2015 (1/11)
Instituto Nacional de Estadística
Overnight stays annual growth rate in holiday dwellings in %
9.7
6.0
6.1
2.5
1.4
Dec-15
Nov-15
Oct-15
Sep-15
Aug-15
Jun-15
May-15
Apr-15
Jul-15
-0.5
-2.1
Mar-15
Jan-15
-1.0
Feb-15
-2.0
Dec-14
0.7
-2.2
7.7
4.3
Las pernoctaciones de no residentes en apartamentos turísticos representan el 80,0% del
total. Reino Unido es el principal mercado emisor, con 975.048 pernoctaciones, un 9,5%
más que en diciembre de 2014. El siguiente mercado emisor es Alemania, con 474.085
pernoctaciones, un 8,2% menos.
Distribution of overnight stays of residents abroad of the 11 main
countries by origin
30.7
14.9
1.4
Other countries
2.4
Belgium
2.5
Italy
2.8
France
4.1
Denmark
Netherlands
5.7
Ireland
10.5
6.0
Finland
9.1
Norway
Sweden
Germany
United Kingdom
9.7
Canarias es el destino preferido en apartamentos, con más de 2,6 millones de
pernoctaciones, un 2,7% más que en diciembre de 2014. Esta comunidad también alcanza
la mayor ocupación, con el 79,5% de los apartamentos ofertados.
Por zonas turísticas, la isla de Gran Canaria es el destino preferido, con 945.314
pernoctaciones y una ocupación del 85,0% de los apartamentos ofertados.
Los puntos turísticos con mayor número de pernoctaciones en diciembre son San Bartolomé
de Tirajana, Mogán y Arona.
EOAT-DICIEMBRE 2015 (2/11)
Instituto Nacional de Estadística
Campings
Las pernoctaciones en campings registran en diciembre un incremento anual del 7,9%
respecto al mismo mes del año anterior. Las de residentes aumentan un 4,2% y las de no
residentes un 9,5%.
Durante el mes de diciembre se ocupan el 35,2% de las parcelas ofertadas, un 5,8% más. El
grado de ocupación por parcelas en fin de semana alcanza el 34,7%, con un aumento anual
del 3,2%.
El 70,9% de las pernoctaciones en campings las realizan viajeros no residentes. Reino
Unido es el principal mercado emisor, con el 37,3% de las pernoctaciones de no residentes,
un 24,5% más que en diciembre de 2014.
Overnight stays annual growth rate in campsites in %
16.2
13.7
11.0
10.7
9.2
7.9
7.5
4.7
4.7
Dic-15
Nov-15
Oct-15
Sep-15
Aug-15
Jul-15
May-15
Apr-15
Mar-15
Feb-15
Jan-15
Dec-14
3.3
3.0
2.7
Jun-15
4.6
Comunitat Valenciana es el destino preferido en campings, con 490.871 pernoctaciones, un
12,1% más que en diciembre de 2014.
La Rioja es la comunidad con el mayor grado de ocupación, el 64,7% de las parcelas
ofertadas.
Por zonas turísticas, la Costa Blanca es el destino preferido, con 296.542 pernoctaciones y
una ocupación del 74,7% de las parcelas ofertadas.
Los puntos turísticos con más pernoctaciones son Benidorm, Cartagena y Marbella.
Alojamientos de turismo rural
Las pernoctaciones en alojamientos de turismo rural presentan un aumento anual del 12,4%
en diciembre. Las de residentes suben un 12,4% y las de no residentes un 12,6%.
En los alojamientos de turismo rural se ocupan el 15,8% de las plazas, con un crecimiento
del 10,1% respecto a diciembre de 2014. El grado de ocupación en fin de semana se sitúa
en el 28,1%, con un incremento del 2,0%.
EOAT-DICIEMBRE 2015 (3/11)
Instituto Nacional de Estadística
Occupancy rate by bedplaces and bedplaces on weekends
44.6
38.5
35.9
34.4
27.5
31.2
24.8
21.3
17.0
16.5
15.8
16.3
14.7
13.7
12.9
10.5
Occupancy rate by bedplaces
Dec-15
Nov-15
Oct-15
Sep-15
Aug-15
Jul-15
Jun-15
May-15
Apr-15
Mar-15
Feb-15
Jan-15
Dec-14
10.8
9.0
7.1
28.1
27.3
24.6
14.3
31.3
29.7
27.4
Weekend occupancy rate by bedplaces
Por comunidades, Castilla y León es el destino preferido, con 142.855 pernoctaciones, un
10,7% más que en diciembre de 2014. Canarias alcanza el mayor grado de ocupación, con
el 33,8% de las plazas ofertadas.
Por zonas turísticas, Pirineus es el principal destino, con 37.407 pernoctaciones. El Parque
Nacional del Teide alcanza la mayor ocupación, con el 36,6% de las plazas ofertadas.
Distribution of overnight stays of traveller residents by autonomous community of destination in %
23.2
1.5
1.5
1.2
0.5
Murcia, Región de
Rioja, La
Balears, Illes
2.4
Galicia
3.2
Madrid, Comunidad de
3.5
Cantabria
3.6
País Vasco
4.7
Comunitat Valenciana
5.1
Extremadura
5.1
Navarra, Comunidad Foral de
5.2
Asturias, Principado de
7.1
Aragón
8.6
Andalucía
Castilla-La Mancha
Cataluña
Castilla y León
10.1
Canarias
13.5
Albergues
Las pernoctaciones en albergues registran en diciembre un aumento anual del 5,0%. Las de
residentes suben un 10,5%, mientras que las pernoctaciones de no residentes bajan un
5,9%.
Se ocupan el 16,5% de las plazas, un 11,2% más que en diciembre de 2014. El grado de
ocupación en fin de semana alcanza el 24,3%, con un descenso del 17,6%.
Por comunidades, Cataluña es el destino preferido, con 38.743 pernoctaciones, un 10,2%
más que en diciembre de 2014. Comunidad de Madrid alcanza la mayor ocupación, con el
29,2% de las plazas ofertadas.
EOAT-DICIEMBRE 2015 (4/11)
Instituto Nacional de Estadística
Índices de precios
El Índice de Precios de Apartamentos Turísticos (IPAP) aumenta un 4,8% respecto a
diciembre de 2014. La tarifa tour-operadores y agencias de viajes, que tiene el mayor peso
en la estructura de ponderaciones este mes (57,2%), sube un 6,8%.
El Índice de Precios de Campings (IPAC) permanece invariable respecto a diciembre de
2014. La tarifa bungalow, que tiene el mayor peso en la estructura de ponderaciones en
diciembre (39,7%), baja un 1,3% respecto al mismo mes de 2014.
El Índice de Precios de Alojamientos de Turismo Rural (IPTR) registra un aumento del 1,5%
en diciembre. La tarifa fin de semana, que supone el 56,2% del peso total, sube un 1,7% en
tasa anual.
Price Indices. Annual variation rates
1.5
Dec-15
0.0
4.8
1.4
Nov-15
0.5
4.4
1.3
Oct-15
0.9
5.1
2.1
Sep-15
-0.1
3.5
0.3
Aug-15
0.8
3.1
-0.1
1.0
Jul-15
3.6
0.4
Jun-15
1.6
May-15
1.5
1.5
4.1
5.7
0.3
Apr-15
-1.4
3.5
1.9
-0.1
Mar-15
4.0
0.9
Feb-15
0.2
5.4
0.1
Jan-15
0.4
6.3
2.4
Dec-14
-1.5
3.9
RTAPI
TCSPI
HDPI
EOAT-DICIEMBRE 2015 (5/11)
Instituto Nacional de Estadística
Evolución de los viajeros y las pernoctaciones en todos los alojamientos
turísticos colectivos españoles
Las pernoctaciones en el conjunto de alojamientos turísticos colectivos españoles (hoteles 1,
apartamentos, campings, alojamientos de turismo rural y albergues) aumentan un 7,3% en
diciembre en tasa anual. Tanto las de residentes como las de no residentes crecen un 7,3%.
La estancia media sube un 0,3%, situándose en 3,3 pernoctaciones por viajero.
Los viajeros y pernoctaciones en alojamientos turísticos colectivos son:
December 2015
Holiday dwellingCampsites Rural T.
Travellers
Residents
Non-residents
Overnight stays
Residents
Non-residents
602,730
232,186
370,544
3,967,669
794,285
3,173,384
139,147
99,279
39,869
981,593
285,863
695,730
Non-hotel
266,311
250,414
15,897
669,384
597,754
71,630
Hotels
41,746
29,552
12,194
95,988
67,154
28,835
Hotels
Total
1,049,934 5,307,903
611,431 3,220,546
438,504 2,087,357
5,714,634 15,018,011
1,745,056 6,355,564
3,969,579 8,662,447
6,357,837
3,831,977
2,525,861
20,732,645
8,100,620
12,632,026
Del total de pernoctaciones realizadas en alojamientos turísticos colectivos, un 72%
corresponde a hoteles y un 28% a alojamientos turísticos extrahoteleros.
Overnight stays annual growth rate in collective tourist
accommodation
12.4
26.0
12.6 12.4
10.5
9.5
8.5
7.9
7.7
7.0
5.0
4.2
5.0
4.0
-5.9
Hotels
Holiday dwellings
Campsites
Resident in Spain
Resident abroad
Rural tourism
Hostels
Total
Los principales mercados emisores en el conjunto de alojamientos turísticos reglados son el
británico (con el 26,7% del total de pernoctaciones de no residentes), el alemán (19,2%) y el
francés (5,8%).
Canarias es el destino preferido, con más de 7,9 millones de pernoctaciones (un 4,7% más
que en diciembre de 2014). Le siguen Andalucía, con más de 2,7 millones (y un aumento
anual del 12,3%) y Cataluña, con más de 2,4 millones (y un incremento del 3,3%).
1
La nota de prensa correspondiente a la Coyuntura Turística Hotelera se ha publicado el 22 de enero. .
EOAT-DICIEMBRE 2015 (6/11)
Instituto Nacional de Estadística
Resultados del conjunto del año 2015
Las pernoctaciones en alojamientos turísticos extrahoteleros (apartamentos, campings,
alojamientos de turismo rural y albergues) alcanzaron la cifra de 113,8 millones en el
conjunto de 2015, un 4,7% más que en el año anterior. Las pernoctaciones de residentes
aumentaron un 7,7% y las de no residentes un 3,0%.
El 60% de las pernoctaciones se realizaron en apartamentos turísticos, el 30% en campings,
el 8% en alojamientos de turismo rural y el 2% restante en albergues.
Overnight annual growth rate in non-hotel accomodation. Annual serie
9.6
7.7
5.4
4.7
3.4
3.0
3.1
1.2
1.0
-1.2
-2.7
-4.8
2012
2013
Residents in Spain
2014
Residents abroad
2015
Total
Apartamentos turísticos
Las pernoctaciones en apartamentos turísticos aumentaron un 2,9% en 2015. Las de
residentes crecieron un 8,2% y las de los no residentes un 1,3%.
Los viajeros no residentes, que representaron un 64,2% del total, realizaron el 75,8% de las
pernoctaciones en apartamentos turísticos.
Overnight annual growth rate in holiday dwellings. Annual serie
8.2
3.3
2.7
2.4
2.4
2.9
2.4
1.3
0.9
0.5
-0.9
-5.4
2012
2013
Residents in Spain
2014
Residents abroad
2015
Total
EOAT-DICIEMBRE 2015 (7/11)
Instituto Nacional de Estadística
En el año 2015 se cubrieron de media el 40,6% de las plazas ofertadas por los
apartamentos turísticos, un 1,4% más que en 2014. El grado de ocupación medio por plazas
en fin de semana se situó en el 43,3%, con un aumento del 2,1%.
Reino Unido se consolidó como primer mercado emisor en apartamentos turísticos, con 18,3
millones de pernoctaciones, un 0,2% más que en 2014. El siguiente mercado fue Alemania,
con más de 8,1 millones de pernoctaciones, un 1,3% menos.
Distribution of overnight stays of residents abroad of the 11 main
countries by origin
35.4
15.8
2.4
1.6
Other countries
2.6
Belgium
3.2
Finland
4.7
Denmark
Norway
4.7
Ireland
4.8
Sweden
Netherlands
France
Germany
United Kingdom
6.6
Italy
11.4
6.8
Canarias fue el destino preferido en apartamentos, con 29,7 millones de pernoctaciones, un
2,0% menos que en 2014. El segundo destino fue Illes Balears, con más de 9,5 millones de
pernoctaciones, un 0,1% más. Estas dos comunidades presentaron el mayor grado de
ocupación medio, con el 74,4% y el 71,8%, respectivamente.
Campings
Las pernoctaciones en campings aumentaron un 6,7% en el año 2015. Las de residentes
crecieron un 6,0% y las de no residentes un 7,6%.
Overnight annual growth rate in campsites. Annual serie
7.6
6.7
6.0
6.0
4.4
3.0
1.7
0.1
-0.2
-1.0
-3.3
-3.7
2012
2013
Residents in Spain
2014
Residents abroad
2015
Total
Los campings ofrecieron, de media, 492.409 plazas, un 0,9% más que en 2014. Se
ocuparon el 38,2% de las parcelas ofertadas, un 3,7% más. El grado de ocupación medio
por parcelas en fin de semana alcanzó el 40,5%, un 2,9% más que en 2014.
EOAT-DICIEMBRE 2015 (8/11)
Instituto Nacional de Estadística
El 48,0% de las pernoctaciones en campings las realizaron no residentes. El mercado
holandés fue el principal mercado emisor, con el 23,9% del total de pernoctaciones, un 7,9%
más que en 2014.
Cataluña fue el destino preferido en campings, con más de 15,2 millones pernoctaciones,
un 4,3% más que en 2014. Por su parte, La Rioja alcanzó, en media, el mayor grado de
ocupación, con el 62,0% de las parcelas ofertadas.
Alojamientos de turismo rural
Las pernoctaciones en alojamientos de turismo rural crecieron un 12,9% en 2015 hasta 8,7
millones. Las de no residentes aumentaron un 13,8% y las de residentes un 10,0%.
Overnight annual growth rate in rural tourism accommodation. Annual
serie
13.8
13.1
12.5
11.3
11.7
12.9
10.0
-1.1
-2.2
-5.9
-7.3
2012
-9.2
2013
Residents in Spain
2014
Residents abroad
2015
Total
Los alojamientos de turismo rural ofrecieron, de media, 142.994 plazas, un 1,1% más que en
2014. El grado de ocupación medio fue del 16,6%, con un incremento del 11,6%. El grado
de ocupación en fin de semana subió un 13,1% y se situó en el 29,5%.
Castilla y León fue el destino preferido, con 1,4 millones de pernoctaciones, un 4,6% más
que en 2014.
Albergues
Las pernoctaciones en albergues crecieron un 0,8% en 2015 y alcanzaron los 2,2 millones.
Las de residentes bajaron un 1,9%, mientras que las de no residentes aumentaron un 6,9%.
Los albergues ofrecieron, de media, 23.517 plazas, un 0,4% menos que en 2014. El grado
de ocupación medio en fin de semana bajó un 1,6% y se situó en el 33,5%.
Por comunidades, Cataluña fue el destino preferido, con 891.731 pernoctaciones, un 0,9%
más que en 2014.
EOAT-DICIEMBRE 2015 (9/11)
Instituto Nacional de Estadística
Índices de precios en alojamientos turísticos extrahoteleros
En el año 2015 el Índice de Precios en Apartamentos Turísticos (IPAP) registró una subida
media del 4,2%.
Holiday dwelling price index. Annual growth rate
4.2
3.8
1.3
1.5
0.9
2011
2012
2013
2015
2014
Por su parte, el Índice de Precios de Campings (IPAC) sufrió un aumento medio del 0,5%.
Tourist campsite price index. Annual growth rate
1.9
0.7
0.4
2011
2012
2013
0.5
0.5
2014
2015
El Índice de Precios de Alojamientos de Turismo Rural (IPTR) presentó un aumento medio
del 0,9% en 2015.
Rural tourism accommodation price index. Annual growth rate
1.5
0.9
0.8
-0.4
-1.3
2011
2012
2013
2014
2015
EOAT-DICIEMBRE 2015 (10/11)
Instituto Nacional de Estadística
Evolución de los viajeros y las pernoctaciones en los diferentes tipos de
alojamientos turísticos colectivos españoles en 2015
Las pernoctaciones en el conjunto de alojamientos turísticos colectivos españoles (hoteles 2,
apartamentos, campings, alojamientos de turismo rural y albergues) superaron los 422,0
millones de pernoctaciones en el conjunto de 2015, con un aumento del 4,5% respecto al
año anterior.
Las pernoctaciones de residentes crecieron un 5,9% y las de no residentes un 3,6%. La
estancia media bajó un 1,6% y se situó en 3,7 pernoctaciones por viajero.
Los viajeros y pernoctaciones en alojamientos turísticos colectivos fueron 3:
Holiday dwellingCampsites
Year 2015
Travellers
Residents
Non-residents
Overnight stays
Residents
Non-residents
10,291,833
3,686,897
6,604,935
68,340,100
16,572,703
51,767,397
6,712,586
4,479,530
2,233,056
34,482,061
17,920,782
16,561,279
Rural T.
Non-hotel
3,222,266
2,685,551
536,716
8,746,210
6,620,289
2,125,921
902,614
606,790
295,824
2,246,451
1,519,309
727,141
Hotels
21,129,299
11,458,768
9,670,532
113,814,822
42,633,083
71,181,738
Hotels
Total
93,081,001
47,427,184
45,653,817
308,186,514
110,272,041
197,914,473
114,210,300
58,885,952
55,324,349
422,001,336
152,905,124
269,096,211
Del total de pernoctaciones en alojamientos turísticos colectivos, un 73% correspondió a
hoteles y un 27% a alojamientos turísticos extrahoteleros.
Overnight stays annual growth rate in collective tourist
accommodation
13.8
12.9
10.0
8.2
7.6
6.9
6.7
6.0
5.3
3.9
4.4
2.9
1.3
0.8
-1.9
Hotels
Holiday dwellings
Campsites
Resident in Spain
Resident abroad
Rural tourism
Hostels
Total
Los principales mercados emisores en el conjunto de alojamientos turísticos reglados fueron
el británico (con el 27,5% del total de pernoctaciones de no residentes), el alemán (21,6%) y
el francés (9,0%).
Por comunidades autónomas, Canarias fue el destino preferido, con más de 94,1 millones
de pernoctaciones (un 0,1% menos que en 2014). Le siguieron Cataluña, con más de 75,3
millones (y un incremento del 3,6%) e Illes Balears, con más de 64,8 millones (y un
crecimiento del 3,0%).
Más información en INEbase – www.ine.es
Todas las notas de prensa en: www.ine.es/prensa/prensa.htm
Gabinete de prensa: Teléfonos: 91 583 93 63 / 94 08 – Fax: 91 583 90 87 - [email protected]
Área de información: Teléfono: 91 583 91 00 – Fax: 91 583 91 58 – www.ine.es/infoine
2
La nota de prensa correspondiente a la Coyuntura Turística Hotelera se ha publicado el 22 de enero.
3 Los resultados presentados en la tabla son la suma de las cifras mensuales. Los posibles desajustes entre los
subtotales y el total están justificados, ya que los datos se presentan sin decimales, pero se calculan teniendo en
cuenta los mismos. Por lo tanto, las diferencias se explican por el redondeo.
EOAT-DICIEMBRE 2015 (11/11)
Tourist Accomodation Occupancy Survey
(Holiday Dwellings)
December 2015
Provisional data
1. Travellers, overnight stays and average stay by Autonomous Cities and Communities
Autonomous Cities and
Communities
Travellers
Total
Residents
in Spain
Residents
abroad
Overnight stays
Total
Residents
in Spain
Residents
abroad
Average
stay
TOTAL
602,730
232,186
370,544
3,967,669
794,285
3,173,384
6.58
Andalucía
Aragón
Asturias, Principado de
Balears, Illes
Canarias
Cantabria
Castilla y León
Castilla - La Mancha
Cataluña
Comunitat Valenciana
Extremadura
Galicia
Madrid, Comunidad de
Murcia, Región de
Navarra, Comunidad Foral de
País Vasco
Rioja, La
Ceuta
Melilla
Annual rate
Cumulative annual rate
108,214
13,516
3,015
3,325
294,264
4,601
9,282
9,639
34,915
61,708
4,240
3,979
33,326
3,459
4,360
6,495
4,392
14.57
6.35
61,713
13,166
2,902
1,284
26,268
4,468
9,031
9,308
20,559
39,240
3,938
3,557
21,411
2,437
3,745
4,899
4,262
29.13
12.26
46,501
350
114
2,041
267,996
133
251
331
14,356
22,468
303
423
11,915
1,022
614
1,596
130
7.01
3.32
423,223
41,252
8,963
20,963
2,683,371
15,098
26,946
26,765
179,925
316,149
8,538
11,776
125,999
26,386
14,572
27,076
10,668
7.73
2.90
162,287
39,761
8,463
3,466
143,952
13,243
25,381
24,519
107,065
121,512
7,890
10,703
71,152
13,654
12,870
17,986
10,382
25.97
8.19
260,936
1,491
500
17,497
2,539,419
1,854
1,566
2,246
72,860
194,636
648
1,073
54,848
12,732
1,703
9,090
286
3.97
1.32
3.91
3.05
2.97
6.30
9.12
3.28
2.90
2.78
5.15
5.12
2.01
2.96
3.78
7.63
3.34
4.17
2.43
-5.97
-3.24
2. Capacity, occupancy and number of staff by Autonomous Cities and Communities
Autonomous Cities and
Communities
Capacity
Estimated
bedplaces
Estimated
Holiday
dwelling
Level of occupancy
Per
Per
bedplaces
bedplaces
at weekend
Per Holiday
dwelling
Per Holiday
dwelling
at weekend
Employed
personnel
TOTAL
363,310
97,919
35.22
36.1
56.77
57.46
21,208
Andalucía
Aragón
Asturias, Principado de
Balears, Illes
Canarias
Cantabria
Castilla y León
Castilla - La Mancha
Cataluña
Comunitat Valenciana
Extremadura
Galicia
Madrid, Comunidad de
Murcia, Región de
Navarra, Comunidad Foral de
País Vasco
Rioja, La
Ceuta
Melilla
Annual rate
Cumulative annual rate
54,896
6,522
3,133
3,785
157,259
2,914
4,891
5,018
20,203
77,495
1,409
3,449
8,677
7,607
1,923
2,691
1,438
2.55
1.66
13,951
1,485
852
984
48,568
836
1,032
1,195
5,169
16,036
333
908
3,417
1,753
391
678
330
1.50
0.55
24.80
20.66
9.38
18.53
54.77
16.70
17.74
17.13
28.79
13.16
19.51
10.96
46.30
11.19
24.37
31.05
23.79
5.86
1.38
26.82
23.62
12.62
18.55
54.49
22.13
26.87
24.53
30.19
13.41
22.09
12.33
51.32
10.93
26.70
35.00
33.07
2.91
2.08
38.81
28.25
13.85
31.22
79.47
24.21
28.19
21.72
42.40
25.94
28.40
21.73
63.54
22.47
40.12
50.36
31.45
6.05
2.60
39.98
31.54
16.94
30.59
79.18
29.42
36.73
29.95
43.40
26.29
33.23
23.45
67.89
22.15
39.94
56.09
41.84
3.59
3.04
3,400
466
215
212
10,688
173
433
424
1,087
2,328
145
208
505
240
379
170
135
5.74
5.45
HDOS (TABLES ANNEXO) - DECEMBER 2015 (1/3)
29th January 2016
3. Travellers, overnight stays, capacity, occupancy, total number of staff with greater
number of overnight stays *
Provinces
Travellers
Overnight stays
Capacity
Level of occupancy
Residents
Residents
Residents
Residents
Ave-
Estimated
Estimated
Per
Per
Per Holiday
Employed
in Spain
abroad
in Spain
abroad
rage
stay
bedplaces
holiday
dwelling
bedplaces
Holiday
dwelling
per-
dwelling at weekend
sonnel
Palmas, Las
16,048
170,748
90,471
1,641,452
9.27
102,132
31,612
54.41
80.48
79.90
6,613
Santa Cruz de Tenerife
10,220
97,248
53,481
897,967
8.85
55,128
16,956
55.43
77.58
77.85
4,075
Málaga
23,009
32,450
67,478
213,974
5.07
35,292
8,782
25.70
41.54
41.40
2,118
Alicante\Alacant
23,820
17,116
73,137
166,978
5.87
57,504
12,046
13.47
27.36
27.29
1,836
Barcelona
6,462
11,660
65,173
63,519
7.10
8,556
2,653
49.38
64.34
63.47
549
11,438
7,061
29,881
22,967
2.86
4,401
1,338
38.41
53.78
59.33
338
Valencia\València
7,189
4,996
23,258
21,103
3.64
9,020
1,937
15.86
28.48
28.27
316
Granada
Castellón\Castelló
Girona
13,073
8,231
6,049
4,135
356
1,911
31,683
25,117
18,242
11,187
6,555
6,700
2.49
3.69
3.13
5,021
10,970
6,677
1,344
2,053
1,503
27.43
9.31
12.02
41.13
15.21
17.21
42.76
18.54
18.52
442
177
341
Huesca
Lleida
7,103
4,852
71
293
22,080
14,304
198
1,031
3.11
2.98
3,535
2,647
776
544
20.88
18.68
25.56
20.92
29.87
23.94
232
111
Gipúzkoa
2,272
1,054
7,253
6,975
4.28
1,305
273
34.03
38.06
43.54
93
Almería
2,760
651
5,959
6,486
3.65
3,996
943
10.04
14.95
17.22
84
Cádiz
3,409
1,361
7,810
4,374
2.55
2,328
586
16.66
23.36
25.32
190
Sevilla
4. Travellers, overnight stays, capacity, occupancy, total number of staff
from tourist areas with greater number of overnight stays
Tourist Areas
Travellers
Residents
in Spain
Overnight stays
Residents
abroad
Residents
in Spain
Capacity
Residents
abroad
Average
stay
Estimated
bedplaces
Level of occupancy
Estimated
holiday
dwelling
Per
bedplaces
Per
Per Holiday
Employed
Holiday
dwelling
per-
dwelling at weekend
sonnel
Isla de Gran Canaria
8,082
89,679
52,653
892,661
9.67
51,288
16,267
59.20
85.00
84.88
3,200
Isla de Tenerife
7,274
90,013
37,493
833,861
8.96
48,892
14,785
57.22
80.25
80.34
3,547
Isla de Lanzarote
5,309
58,811
27,200
542,447
8.88
35,389
10,647
51.61
77.34
76.40
2,534
18,900
22,288
2,658
1,890
31,775
16,915
22,258
704
59,616
70,478
10,618
51,620
213,060
166,092
206,344
22,584
5.38
6.03
8.71
28.61
34,064
55,820
15,454
4,033
8,462
11,781
4,698
1,428
25.79
13.67
44.91
59.17
42.08
27.67
71.94
72.91
41.83
27.58
70.58
71.70
2,029
1,799
879
99
Barcelona
3,633
10,929
12,045
40,832
3.63
4,022
1,059
41.22
55.46
54.57
400
Isla de la Palma
1,639
3,210
9,928
29,959
8.23
2,735
996
47.02
65.40
67.64
263
Isla de la Gomera
1,057
3,997
4,733
33,994
7.66
3,095
1,055
40.31
58.71
59.49
239
Costa del Sol
Costa Blanca
Isla de Fuerteventura
Costa Barcelona
5. Travellers, overnight stays, capacity, occupancy, total number of staff
from tourist sites with greater number at overnights stays
Tourist sites
San Bartolomé de Tirajana
4,037
48,213
18,736
Mogán
Arona
Tías
2,906
1,735
2,846
39,062
39,902
33,463
30,459
10,517
14,898
361,107
377,282
306,151
9.33
9.31
8.84
19,466
20,380
18,779
5,848
6,234
5,895
64.73
61.25
54.77
86.48
82.15
80.29
86.08
82.04
79.26
1,262
1,511
1,155
Adeje
1,643
27,663
9,124
253,542
8.96
15,329
4,298
54.89
82.60
82.61
1,049
1,636
9,773
19,527
15,783
8,418
11,438
9,868
33,027
64,821
153,119
95,578
53,053
9.36
7.07
3.81
9,920
17,987
8,028
2,957
4,324
3,156
52.41
23.06
46.79
78.71
40.79
63.85
77.94
41.34
68.06
751
765
461
Puerto de la Cruz
2,642
9,592
12,223
101,412
9.29
6,110
2,385
59.63
77.78
78.31
469
Oliva (La)
1,355
7,954
5,026
67,884
7.83
4,773
1,347
49.27
81.32
80.82
285
Residents
abroad
Overnight stays
Residents Residents
in Spain
abroad
Level of occupancy
Per
Per Holiday
Per
bedHoliday dwelling
places dwelling at weekend
55.20
83.91
83.92
Employed
Capacity
AveEstimated Estimated
rage
bedholiday
stay
places
dwelling
511,844
10.15
30,823
9,984
Teguise
Benidorm
Madrid
Travellers
Residents
in Spain
* Provinces belonging to uniprovincial Autonomous Communities have not been included because they are reflected
in previous tables.
HDOS (TABLES ANNEX) - DECEMBER 2015 (2/3)
Provisional data
personnel
1,843
6. Travellers and overnight stays by countries of residence
Countries
Travellers
Total
Overnight stays
Total
%
%
TOTAL
602,730
100.00
3,967,669
100.00
Residents in Spain
Residents abroad
Total residents abroad
Total residents in E.U (excluding Spain)
- Germany
- Austria
- Belgium
-Denmark
- Finland
- France
- Greece
- Ireland
- Italy
- Luxembourg
- Netherlands
- Poland
- Portugal
- United Kingdom
- Czech Republic
- Sweden
- Other EU countries
Norway
Russia
Switzerland
Other european countries
United States of America
Rest of America
African countries
Other countries
232,186
370,544
370,544
304,078
43,026
1,909
5,247
15,440
20,239
16,178
251
11,445
14,265
537
18,550
3,575
2,440
113,034
1,182
32,714
4,046
27,570
4,297
3,911
4,535
5,201
6,430
4,021
10,501
38.52
61.48
100.00
82.06
11.61
0.52
1.42
4.17
5.46
4.37
0.07
3.09
3.85
0.15
5.01
0.96
0.66
30.50
0.32
8.83
1.09
7.44
1.16
1.06
1.22
1.40
1.74
1.09
2.83
794,285
3,173,384
3,173,384
2,649,506
474,085
19,765
43,651
130,153
190,199
79,859
1,642
89,478
77,687
5,867
182,411
24,076
8,905
975,048
9,442
308,158
29,093
288,662
32,319
30,911
35,566
21,552
44,810
19,530
50,515
20.02
79.98
100.00
83.49
14.94
0.62
1.38
4.10
5.99
2.52
0.05
2.82
2.45
0.18
5.75
0.76
0.28
30.73
0.30
9.71
0.92
9.10
1.02
0.97
1.12
0.68
1.41
0.62
1.59
HDOS (TABLES ANNEX) - DECEMBER 2015 (3/3)
Provisional data
Tourist Accomodation Occupancy Survey
Campsite Occupancy Survey (COS)
December 2015
Provisional data
1. Travellers, overnight stays and average stay by category of establishment
Category
Travellers
Overnight stays
Total
Residents
Residents
in
abroad
Total
Spain
TOTAL
Luxury and first-class
Residents
Residents
in
abroad
Average
stay
Spain
139,147
99,279
39,869
981,593
285,863
695,730
7.05
60,991
43,256
17,736
392,221
123,304
268,917
6.43
Second-class
67,405
46,858
20,547
557,866
141,407
416,459
8.28
Third-class
10,751
9,165
1,586
31,506
21,153
10,353
2.93
Annual rate
4.11
2.83
7.42
7.94
4.23
9.54
3.68
Cumulative annual rate
6.00
5.29
7.46
6.72
5.96
7.57
0.68
2. Open establishments, capacity, occupancy and number of
staff by category of establishments
Category
Capacity
Estimated
open
establishments
Estimated
Estimated
bedplaces
pitches
Occupied
pitches
Occupancy
rate
Weekend
occupancy
per pitch
rate
Employed
personnel
TOTAL
453
271,983
86,422
943,861
35.23
34.70
2,787
Luxury and first-class
120
115,354
36,068
373,941
33.44
32.03
1,234
Second-class
261
138,677
44,350
516,136
37.54
37.12
1,342
Third-class
72
17,951
6,004
53,784
28.90
32.87
211
Annual rate
2.25
0.80
1.26
7.15
5.82
3.20
-2.92
Cumulative annual rate
1.27
0.89
0.82
4.59
3.71
2.86
5.89
3. Travellers, overnight stays and average stay by Autonomous Cities and Communities
Autonomous cities and
communities
Travellers
Overnight stays
Total
Residents
Residents
in
abroad
Total
Residents
in
Spain
TOTAL
Andalucía
Aragón
Asturias, Principado de
Balears, Illes
Canarias
Cantabria
Average
stay
Residents
eabroad
Spain
139,147
99,279
39,869
981,593
285,863
695,730
7.05
24,543
14,336
10,207
184,278
51,925
132,352
7.51
7,910
6,755
1,154
20,511
18,397
2,114
2.59
581
378
203
1,422
1,093
329
2.45
-
-
-
-
-
-
-
1,102
899
203
6,200
2,361
3,839
5.63
422
422
0
1,466
1,466
0
3.47
Castilla y León
2,450
1,021
1,429
4,192
2,257
1,934
1.71
Castilla - La Mancha
1,478
1,313
165
3,297
3,040
257
2.23
Cataluña
41,484
35,001
6,483
112,769
76,046
36,722
2.72
Comunitat Valenciana
33,168
17,856
15,312
490,871
71,156
419,715
14.80
1,837
1,537
299
4,871
4,404
467
2.65
234
191
43
486
385
101
2.08
Extremadura
Galicia
Madrid, Comunidad de
9,442
8,103
1,339
27,876
24,649
3,227
2.95
Murcia, Región de
5,171
2,869
2,302
103,559
10,651
92,908
20.03
Navarra, Comunidad Foral de
2,735
2,601
134
6,553
6,224
330
2.40
País Vasco
1,857
1,263
594
5,521
4,086
1,435
2.97
Rioja, La
4,733
4,733
0
7,722
7,722
0
1.63
Ceuta
-
-
-
-
-
-
-
Melilla
-
-
-
-
-
-
-
COS (TABLES ANNEX) - DECEMBER 2015 (1/4)
29th january 2016
4. Open establishments, capacity, occupancy and number of
staff by autonomous cities and communities
Autonomous cities and
communities
Estimated
open
Capacity
Estimated
Estimated
establish-
bedplaces
pitches
Occupied
pitches
Occupancy Weekend
rate
occupancy
per
ments
Employed
personnel
rate
pitch
TOTAL
453
271,983
86,422
943,861
35.23
34.70
2,787
Andalucía
102
59,670
19,365
151,176
25.18
25.20
640
38
16,599
4,976
35,843
23.24
23.06
137
Asturias, Principado de
6
4,151
1,273
4,980
12.62
19.76
17
Balears, Illes
-
-
-
-
-
-
-
Canarias
4
3,274
1,386
6,744
15.69
17.28
18
Aragón
Cantabria
Castilla y León
8
3,939
1,215
17,616
46.77
46.47
22
24
8,287
2,663
13,458
16.30
15.58
74
Castilla - La Mancha
12
3,406
1,059
6,848
20.86
13.22
29
Cataluña
77
51,612
16,030
161,091
32.42
31.65
475
Comunitat Valenciana
97
64,234
20,116
328,455
52.67
52.10
790
7
2,557
919
8,229
28.90
31.76
53
Galicia
17
5,854
2,072
3,312
5.16
4.96
42
Madrid, Comunidad de
19
17,093
5,717
85,830
48.43
46.65
183
Murcia, Región de
18
14,815
4,898
66,144
43.56
48.38
182
Navarra, Comunidad Foral de
11
7,001
1,811
15,662
27.91
27.08
64
País Vasco
9
4,860
1,476
9,488
20.74
26.83
32
Rioja, La
4
4,631
1,446
28,983
64.65
42.08
28
Extremadura
Ceuta
-
-
-
-
-
-
-
Melilla
-
-
-
-
-
-
-
5. Travellers and overnight stays, average stay, capacity, occupancy and
number of staff by provinces with the greatest number of overnight stays**
Provinces
Travellers
Overnight stays
Residents
Residents
Residents
Residents
in
abroad
in
abroad
Spain
Average
stay
Estimated
open
Estimated
pitches
establish-
Spain
Occupancy Employed
rate
personnel
per
ments
pitch
Alicante\Alacant
5,314
8,886
30,796
320,141
24.71
38
9,363
68.02
356
Castellón\Castelló
5,113
4,817
17,874
69,921
8.84
33
5,939
34.79
248
Málaga
3,060
3,607
14,204
70,037
12.64
29
4,624
36.57
184
12,272
2,681
28,514
24,432
3.54
20
5,715
33.16
170
7,429
1,609
22,487
29,652
5.77
26
4,814
44.88
186
928
1,340
8,801
29,899
17.07
16
2,427
28.08
77
Girona
12,060
2,570
26,939
9,609
2.50
27
4,517
30.83
165
Huelva
3,998
614
13,673
5,018
4.05
10
4,285
19.11
79
Granada
2,339
2,030
5,596
12,960
4.25
22
2,683
17.20
102
Cádiz
1,477
1,729
3,812
12,812
5.19
13
3,336
27.92
121
Huesca
5,346
265
13,449
594
2.50
23
3,493
28.50
101
Tarragona
5,133
1,221
9,871
2,659
1.97
13
2,849
21.75
80
Lleida
5,537
10
10,722
23
1.94
18
2,949
43.73
61
Zaragoza
212
889
2,125
1,519
3.31
6
471
21.60
15
Gipúzkoa
956
594
2,221
1,364
2.31
6
1,106
18.62
22
Barcelona
Valencia\València
Almería
** Provinces belonging to uniprovincial Autonomous Communities have not been included because they are reflected in previous tables.
COS (TABLES ANNEX) - DECEMBER 2015 (2/4)
Provisional data
6. Travellers, overnight stays, average stay, open establishments, capacity, occupancy
and number of staff from tourist areas with the greatest number of overnight stays
Tourist areas
Travellers
Residents
in
Spain
Overnight stays
Residents
abroad
Residents
in
Spain
Average
stay
Residents
abroad
Estimated
Estimated
open
pitches
establishments
Occupancy
rate
per pitch
Employed
personnel
Costa Blanca
3,046
7,077
13,642
282,900
29.29
30
7,136
74.65
307
Costa Cálida
932
1,999
4,526
87,992
31.00
9
3,798
48.20
138
Costa de Castellón
4,009
4,675
15,803
69,110
9.78
28
5,516
35.04
229
Costa del Sol
1,262
3,302
10,365
68,094
17.19
13
3,275
46.55
137
Costa Valencia
2,988
1,149
12,773
31,841
10.78
11
3,075
45.62
112
Costa Barcelona
6,743
2,667
16,792
24,383
4.38
7
4,196
27.70
117
815
1,316
8,512
27,819
17.05
12
2,120
28.20
61
17,195
0
35,159
0
2.04
38
5,451
44.60
152
Costa Brava
4,266
2,570
10,509
9,609
2.94
13
2,648
23.36
101
Costa de la Luz (Huelva)
3,257
514
12,072
4,211
4.32
5
3,566
17.55
55
P.N. Doñana
3,085
436
12,534
2,902
4.38
5
2,698
9.04
47
104
Costa de Almería
Pirineus
Costa de la Luz (Cádiz)
692
1,672
1,972
12,755
6.23
10
2,771
16.75
5,308
261
13,333
580
2.50
22
3,355
26.35
98
Costa Tropical
512
832
1,755
9,796
8.59
7
1,182
21.20
38
Costa Daurada
4,761
636
8,615
1,448
1.86
7
1,922
28.70
50
Pirineo Aragonés
7. Travellers, overnight stays, average stay, open establishments, capacity, occupancy
and number of staff from tourist sites with the greatest number at overnights stays
Tourist sites
Travellers
Residents
in
Overnight stays
Residents
abroad
Spain
Residents
in
Residents
abroad
Average
stay
Estimated
Estimated
open
pitches
establishments
Occupancy
rate
per pitch
Employed
personnel
Spain
Benidorm
976
2,953
6,069
166,091
31.00
9
3,746
81.30
Cartagena
502
1,045
2,425
53,664
31.00
3
2,537
37.40
87
Marbella
641
1,586
8,225
29,944
17.14
3
1,313
45.41
56
Mazarrón
Peníscola/Peñíscola
133
204
733
1,563
28,564
31.00
3
874
71.05
35
1,040
2,046
2,546
22,501
8.12
8
1,329
32.97
67
Oliva
551
626
3,762
20,290
20.44
5
1,244
34.65
71
Vélez-Málaga
150
980
946
22,992
21.18
4
744
61.36
47
1,175
462
5,327
12,509
10.90
4
846
42.55
36
107
410
308
13,505
26.72
4
289
81.30
17
Benicasim/Benicàssim
Calp
Campello (El)
396
511
2,885
9,262
13.39
4
341
68.14
21
Motril
468
579
1,402
6,815
7.85
3
579
31.86
23
Alcalà De Xivert
310
762
437
6,619
6.58
3
689
21.36
32
COS (TABLES ANNEX) - DECEMBER 2015 (3/4)
Provisional data
8. Travellers and overnight stays by countries of residence
Countries
Travellers
Total
TOTAL
Residents in Spain
Residents abroad
TOTAL residents abroad
TOTAL residents in E.U. (excluding Spain)
- Germany
- Austria
- Belgium
- Denmark
- Finland
- France
- Greece
- Ireland
- Italy
- Luxembourg
- Netherlands
- Poland
- Portugal
- United Kingdom
- Czech Republic
- Sweden
- Other EU countries
Norway
Russia
Switzerland
Other European countries
United States of America
Rest of America
African countries
Other countries
Overnight stays
Total
%
%
139,147
100.00
981,593
100.00
99,279
39,869
39,869
37,171
9,158
407
1,943
291
573
6,740
27
435
1,981
122
5,525
83
308
8,263
55
912
349
183
0
1,377
233
60
302
4
539
71.35
28.65
100.00
93.23
22.97
1.02
4.87
0.73
1.44
16.90
0.07
1.09
4.97
0.31
13.86
0.21
0.77
20.72
0.14
2.29
0.88
0.46
0.00
3.45
0.58
0.15
0.76
0.01
1.35
285,863
695,730
695,730
668,398
166,333
4,913
34,375
6,760
9,858
51,124
144
3,932
6,702
1,594
97,490
742
717
259,261
334
23,202
918
5,968
86
15,793
719
249
985
78
3,453
29.12
70.88
100.00
96.07
23.91
0.71
4.94
0.97
1.42
7.35
0.02
0.57
0.96
0.23
14.01
0.11
0.10
37.26
0.05
3.33
0.13
0.86
0.01
2.27
0.10
0.04
0.14
0.01
0.50
* Non-significant data
COS (TABLES ANNEX) - DECEMBER 2015 (4/4)
Provisional data
Tourist accommodation occupancy survey
(Rural tourist accommodation)
December 2015
Provisional data
1. Number of travellers, overnight stays and average stay by Autonomous City and
Community
Autonomous
Communities
TOTAL
Andalucía
Aragón
Asturias, Principado de
Balears, Illes
Canarias
Cantabria
Castilla y León
Castilla-La Mancha
Cataluña
Comunitat Valenciana
Extremadura
Galicia
Madrid, Comunidad de
Murcia, Región de
Navarra, Comunidad Foral de
País Vasco
Rioja, La
Ceuta
Melilla
Annual rate
Cumulative annual rate
Number of travellers
Total
Residents
In Spain
Residents
abroad
Number of overnight stays
Total
Residents
In Spain
Residents
abroad
Average
stay
266,311
23,510
17,308
12,088
3,095
7,955
9,290
58,710
25,093
36,771
13,520
12,860
7,751
10,528
3,535
11,052
10,148
3,097
-
250,414
21,412
16,950
11,957
1,377
2,278
9,112
57,148
24,888
35,382
12,973
12,551
7,462
9,985
3,401
11,001
9,485
3,051
-
15,897
2,097
358
130
1,718
5,677
178
1,562
205
1,388
547
309
290
542
133
52
663
47
-
669,384
61,426
43,520
31,716
9,481
43,160
21,691
142,855
60,885
85,613
32,500
31,050
14,724
19,540
9,212
31,279
23,513
7,218
-
597,754
51,540
42,400
31,243
2,690
9,119
21,158
138,910
60,250
80,654
28,234
30,211
14,108
18,926
8,740
30,694
21,770
7,108
-
71,630
9,886
1,121
473
6,792
34,040
533
3,945
634
4,959
4,266
839
617
613
473
586
1,743
111
-
2.51
2.61
2.51
2.62
3.06
5.43
2.33
2.43
2.43
2.33
2.40
2.41
1.90
1.86
2.61
2.83
2.32
2.33
-
11.25
14.15
11.03
13.96
14.70
15.10
12.44
12.85
12.43
13.80
12.57
9.98
1.08
-1.14
2. Open rural establishments, bed-places, occupancy rates and employed
personnel by Autonomous City and Community
Autonomous
Communities
TOTAL
Andalucía
Aragón
Asturias, Principado de
Balears, Illes
Canarias
Cantabria
Castilla y León
Castilla-La Mancha
Cataluña
Comunitat Valenciana
Extremadura
Galicia
Madrid, Comunidad de
Murcia, Región de
Navarra, Comunidad Foral de
País Vasco
Rioja, La
Ceuta
Melilla
Annual rate
Cumulative annual rate
Estimated
Estimated
Occupancy rate
Employed
Of bed-places Of bed-places Of bedrooms personnel
open
bed-places
rural
at weekend
establishments
14,783
136,435
15.76
28.10
19.23
19,997
1,520
13,248
14.93
26.01
18.31
2,077
1,198
9,395
14.82
21.41
17.27
1,376
1,142
10,653
9.60
13.93
11.41
1,440
80
1,519
20.05
21.84
24.17
300
671
4,079
33.83
31.58
50.54
913
295
4,811
14.50
30.64
16.48
513
3,090
27,424
16.73
33.66
19.15
4,086
1,482
13,116
14.93
29.07
19.44
1,818
1,969
15,888
17.32
33.02
19.55
2,693
885
9,101
11.51
18.32
17.60
1,364
557
6,713
14.89
33.45
20.67
796
445
5,499
8.62
16.30
9.17
699
244
3,703
16.95
35.72
22.43
453
136
2,004
14.81
23.90
20.27
222
622
4,602
21.81
37.68
25.29
715
334
3,632
20.67
33.01
22.70
399
112
1,047
22.02
45.00
23.18
134
0.68
2.14
10.08
2.03
9.84
-1.15
0.55
1.07
11.56
13.06
9.75
0.67
EOTR (TABLES ANNEX) - DECEMBER 2015 (1/4)
The 29th of January of 2016
3. Number of travellers, overnight stays and average stay in Provinces with
the greatest number of overnight stays1
Provinces
Number of travellers
Total
Girona
Number of overnight stays
Residents
Residents
In Spain
abroad
Total
Average
Residents
Residents
In Spain
abroad
stay
15,387
14,758
630
34,932
33,066
1,866
2.27
5,620
1,576
4,044
31,450
6,670
24,780
5.60
Ávila
11,525
11,396
130
26,747
26,592
155
2.32
Cáceres
10,614
10,359
255
26,084
25,463
621
2.46
Segovia
11,530
11,196
335
26,074
25,391
684
2.26
Barcelona
9,287
8,944
343
23,368
21,889
1,479
2.52
Huesca
8,789
8,595
194
22,730
22,101
629
2.59
Lleida
8,282
8,028
253
19,587
18,412
1,174
2.37
Albacete
7,256
7,255
1
19,048
19,046
2
2.63
Málaga
6,093
5,348
745
18,736
13,825
4,912
3.08
Burgos
6,275
6,149
126
18,316
18,027
289
2.92
Salamanca
7,838
7,319
518
17,519
16,034
1,486
2.24
Soria
6,174
6,051
123
15,561
15,329
232
2.52
Cuenca
6,005
5,967
38
13,940
13,902
38
2.32
León
5,632
5,504
128
13,746
13,499
247
2.44
Santa Cruz de Tenerife
4. Open rural establishments, bed-places, occupancy rates and employed personnel
in Provinces with the highest number of overnight stays1
Provinces
Estimated
Estimated
Occupancy rate
open
bed-places
Of bed-places
rural
Employed
Of bed-places
Of bedrooms
personnel
at weekend
establishments
Girona
669
5,493
20.46
35.42
22.78
966
Santa Cruz de Tenerife
546
3,108
32.52
30.63
49.66
708
Ávila
703
5,674
15.19
27.23
19.16
788
Cáceres
463
5,626
14.93
34.62
20.33
639
Segovia
404
3,747
22.31
49.92
24.56
545
Barcelona
509
4,365
17.19
37.15
19.24
768
Huesca
625
4,609
15.79
21.03
17.67
702
Lleida
544
3,974
15.81
29.56
17.78
681
Albacete
606
4,013
15.27
25.20
20.02
658
Málaga
589
3,966
15.23
21.97
18.51
710
Burgos
310
3,185
18.47
41.48
20.25
386
Salamanca
464
3,798
14.80
29.41
17.48
588
Soria
311
2,780
17.92
31.89
18.44
384
Cuenca
285
2,918
15.34
30.99
16.98
391
León
360
3,079
14.35
29.49
15.87
575
1
Provinces belonging to uniprovincial Autonomous Communities have not been included because they are reflected in previous tables.
EOTR (TABLES ANNEX) - DECEMBER 2015 (2/4)
Provisional data
5. Number of travellers, overnight stays, average stay, capacity and occupancy rates in areas
with the highest number of overnight stays
Areas
Number of travellers
Number of overnight stays
Capacity
Occupancy rate
Residents
Residents
Residents
Residents
Average Estimated
Estimated
In Spain
abroad
In Spain
abroad
stay
bed-places bed-places places
open rural
Of
Of bed-
establishments
Pirineus
Pirineo Navarro
Of bedrooms
at weekend
15,532
231
36,505
902
2.37
801
6,093
19.71
37.06
22.26
9,653
53
27,130
601
2.86
556
4,049
21.96
37.54
25.85
Pirineo Aragonés
7,373
174
20,048
713
2.75
563
4,185
15.84
21.32
17.10
Extremadura Norte
7,753
119
19,110
338
2.47
323
4,002
15.65
35.37
22.07
Costa Brava
6,875
515
15,619
1,698
2.34
388
3,273
17.04
29.04
18.46
Isla de Tenerife
1,021
2,506
2,219
11,591
3.92
127
1,261
35.13
35.10
49.75
Isla de La Palma
450
1,038
3,464
8,907
8.32
308
1,260
31.57
26.11
52.18
P.Nacional Teide
811
1,985
1,617
8,765
3.71
84
909
36.60
35.51
51.85
19.73
P.Nacional Picos de Europa
3,633
74
10,172
194
2.80
207
1,959
17.06
24.16
Costa Verde
3,060
55
8,051
266
2.67
366
3,856
6.95
9.63
8.27
P.Nacional Taburiente
309
774
2,099
5,965
7.45
179
738
35.18
29.14
54.63
Isla de Mallorca
884
1,525
1,784
6,252
3.34
72
1,340
19.34
21.13
23.76
Isla Gran Canaria
462
992
1,230
5,982
4.96
99
664
34.73
33.05
54.12
Pirineo Vasco
2,616
203
6,346
803
2.54
109
1,155
19.66
31.93
20.15
P.Natural Sierra de Aracena y
Picos de Aroche
2,202
174
5,548
691
2.63
120
833
24.17
49.92
28.52
6. Number of travellers, overnight stays, average stay, capacity, occupancy rates and employed
personnel per rural house by Autonomous City and Community2
Autonomous
Number of travellers
Number of overnight stays
Communities
Residents
Residents
Residents
Residents
Average Estimated
Capacity
Estimated
In Spain
abroad
In Spain
abroad
stay
bed-places bed-places places
open rural
Occupancy rate
Employed
Of
personnel
Of bed-
establish.
TOTAL
at weekends
187,095
10,054
463,718
51,937
2.62
12,779
103,249
16.05
28.62
Andalucía
21,412
2,097
51,540
9,886
2.61
1,520
13,248
14.93
26.01
2,077
Aragón
12,962
242
30,906
712
2.39
928
7,200
14.06
21.48
1,066
4,688
77
12,194
340
2.63
743
4,616
8.76
10.65
851
868
845
1,744
2,492
2.47
31
525
25.78
34.06
101
Asturias, Principado de
Balears, Illes
Canarias
16,062
983
3,182
6,604
24,007
7.35
641
3,234
30.24
27.82
747
2,509
41
8,686
146
3.46
139
1,994
14.28
27.61
192
Castilla y León
38,280
817
102,297
2,731
2.69
2,727
19,680
17.15
34.47
3,109
Castilla-La Mancha
24,326
201
58,554
626
2.41
1,456
12,619
15.09
29.40
1,783
Cataluña
35,382
1,388
80,654
4,959
2.33
1,969
15,888
17.32
33.02
2,693
Comunitat Valenciana
1,224
Cantabria
10,117
453
23,054
3,491
2.51
843
6,954
12.30
18.68
Extremadura
5,703
89
14,081
282
2.48
322
3,189
14.50
33.23
372
Galicia
5,517
180
10,808
366
1.96
340
4,009
8.97
16.40
496
Madrid, Comunidad de
2,884
49
5,888
60
2.03
71
800
23.91
50.58
106
Murcia, Región de
2,584
34
7,511
304
2.98
123
1,672
15.06
25.07
176
11,001
52
30,694
586
2.83
622
4,602
21.81
37.68
715
País Vasco
Navarra, Comunidad Foral de
4,827
261
11,397
839
2.41
190
1,971
19.82
33.14
221
Rioja, La
134
3,051
47
7,108
111
2.33
112
1,047
22.02
45.00
Ceuta
-
-
-
-
-
-
-
-
-
-
Melilla
-
-
-
-
-
-
-
-
-
-
2
To facilitate the comparability between data from different Autonomous Communities (and because of the different regulation and different
characteristics), a group called rural house has been created, with those establishments with similar typology (location, capacity, etc…).
The variables included in the previous table have been estimated with that type of establishments.
EOTR (TABLES ANNEX) - DECEMBER 2015 (3/4)
Provisional data
7. Travellers and overnight stays by country of residence
Results by countries
Travellers
Total
Overnight stays
Total
%
%
TOTAL
266,311
100.00
669,384
100.00
Residents Spain
250,414
94.03
597,754
89.30
Residents abroad
15,897
5.97
71,630
10.70
Total Residents abroad
15,897
100.00
71,630
100.00
Total Residents in EU (excluding Spain)
- Germany
- Belgium
- France
- Italy
- Netherlands
- Portugal
- United Kingdom
Switzerland
Other European countries
United States of America
Other countries
12,987
4,094
335
2,182
711
1,353
768
2,092
268
2,086
393
1,614
81.70
25.76
2.11
13.73
4.47
8.51
4.83
13.16
1.68
13.12
2.47
10.15
62,699
26,344
1,482
6,629
2,124
6,029
2,293
10,968
1,704
8,934
1,129
3,995
87.53
36.78
2.07
9.25
2.97
8.42
3.20
15.31
2.38
12.47
1.58
5.58
EOTR (TABLES ANNEX) - DECEMBER 2015 (4/4)
Provisional data
Tourist Accomodation Occupancy Survey
Hostels Occupancy Survey (HOS)
Provisional data
December 2015
1. Travellers, overnight stays and average stay by Autonomous Cities and Communities
Autonomous cities and
communities
Travellers
Total
Residents
in
Spain
Residents
abroad
Overnight stays
Total
Residents
in
Spain
Residents
abroad
Average
stay
TOTAL
41,746
29,552
12,194
95,988
67,154
28,835
2.30
Andalucía
Aragón
Asturias, Principado de
Balears, Illes
Canarias
Cantabria
Castilla y León
Castilla - La Mancha
Cataluña
Comunitat Valenciana
Extremadura
Galicia
Madrid, Comunidad de
Murcia, Región de
Navarra, Comunidad Foral de
País Vasco
Rioja, La
Ceuta
Melilla
5,954
1,865
182
828
3,741
1,823
15,475
4,299
422
123
2,087
428
3,810
127
-2.55
0.51
5,256
1,798
159
828
3,535
1,740
7,607
2,669
401
108
1,577
400
2,988
127
1.54
-0.17
698
67
23
0
206
84
7,868
1,630
21
15
510
28
822
0
-11.21
1.93
11,658
4,164
321
1,523
8,896
3,375
38,743
10,353
1,052
172
3,929
1,383
8,705
346
5.00
0.75
10,422
4,010
260
1,523
8,512
3,242
19,363
6,529
995
145
3,012
1,162
6,830
346
10.51
-1.94
1,236
154
61
0
384
133
19,381
3,824
57
27
917
221
1,875
0
-5.92
6.89
1.96
2.23
1.76
1.84
2.38
1.85
2.50
2.41
2.49
1.40
1.88
3.23
2.28
2.72
7.75
0.24
Annual rate
Cumulative annual rate
2. Open establishments, capacity, occupancy and number of
staff by autonomous cities and communities
Autonomous cities and
Capacity
communities
Estimated
Estimated
open
bed-places
establishments
TOTAL
Andalucía
Aragón
Asturias, Principado de
Balears, Illes
Canarias
Cantabria
Castilla y León
Castilla - La Mancha
Cataluña
Comunitat Valenciana
Extremadura
Galicia
Madrid, Comunidad de
Murcia, Región de
Navarra, Comunidad Foral de
País Vasco
Rioja, La
Ceuta
Melilla
Annual rate
Cumulative annual rate
Occupancy rate
Of bed-places Of bed-places
at weekend
Employed
personnel
166
18,755
16.51
24.34
1,405
9
15
3
8
21
22
26
9
9
4
5
7
18
6
-2.44
0.19
2,049
1,366
265
451
1,953
2,097
4,422
1,534
646
442
433
603
2,022
262
-5.59
-0.35
18.36
9.83
3.91
10.89
14.69
5.19
28.26
21.77
5.25
1.26
29.24
7.40
13.89
4.26
11.22
1.10
22.67
18.49
10.77
18.29
27.00
9.16
39.45
28.96
10.70
3.00
40.35
7.69
19.13
9.19
-17.60
-1.62
164
94
32
23
143
87
320
89
40
21
164
43
143
10
-2.03
-0.68
HOS (TABLES ANNEX) - DECEMBER 2015 (1/2)
29th January 2016
3. Travellers and overnight stays by countries of residence
Countries
Travellers
Total
Overnight stays
%
Total
Average
stay
%
TOTAL
41,746
100.00
95,988
100.00
2.30
Residents in Spain
Residents abroad
TOTAL residents abroad
TOTAL residents in E.U. (excluding Spain)
- Germany
- Belgium
- France
- Italy
- Netherlands
- Portugal
- United Kingdom
Switzerland
Other European countries
United States of America
Other countries
29,552
12,194
12,194
8,056
1,272
239
2,387
1,378
388
314
1,111
145
1,715
643
2,600
70.79
29.21
100.00
66.06
10.43
1.96
19.57
11.30
3.18
2.58
9.11
1.19
14.06
5.28
21.33
67,154
28,835
28,835
19,476
3,094
556
5,485
3,595
961
645
2,498
335
4,278
1,591
5,796
69.96
30.04
100.00
67.55
10.73
1.93
19.02
12.47
3.33
2.24
8.66
1.16
14.84
5.52
20.10
2.27
2.36
2.36
2.42
2.43
2.32
2.30
2.61
2.48
2.05
2.25
2.30
2.49
2.47
2.23
HOS (TABLES ANNEX) - DECEMBER 2015 (2/2)
Provisional data
HOLIDAY DWELLING PRICE INDEX (HDPI)
December 2015
Provisional data
National general index and breakdown by rates
Index
Annual
variation rate
119.62
116.98
115.14
122.56
TOTAL
Normal
Weekend
Tour-operators and travel agencies
4.76
1.66
4.12
6.82
National general index and breakdown by modalities
Index
TOTAL
Studio
Dwellings 2/4 bedplaces
Dwellings 4/6 bedplaces
HDPI (ANNEX OF TABLES) - DECEMBER 2015
Annual
variation rate
119.62
125.17
118.51
121.31
4.76
7.64
4.60
2.91
29th January 2016
Tourist Campsite Price Index (TCSPI). 2002 Base
December 2015
Provisional data
National general index and breakdown by rates
Index
Annual
variation rate
134.58
129.16
135.51
143.73
98.69
TOTAL
Normal rate
Special rate for stays up to one month
Special rate for stays longer than one month
Tarifa bungalow*
0.00
0.01
1.42
2.09
-1.31
National general index and breakdown by categories
Index
TOTAL
Luxury and first
Second
Third
*2014 Base
TCSPI (ANNEX OF TABLES) - DECEMBER 2015
Annual
variation rate
134.58
135.27
132.33
169.43
0.00
-0.45
0.24
3.18
29th january 2016
Rural Tourism Accommodation Price Index (RTAPI)
December 2015
Provisional data
General Autonomous Cities and Communities
and national indices
Index
Annual variation
rate
TOTAL
Andalucía
Aragón
Asturias, Principado de
Balears, Illes
Canarias
Cantabria
Castilla y León
Castilla - La Mancha
Cataluña
Comunitat Valenciana
Extremadura
Galicia
Madrid, Comunidad de
Murcia, Región de
Navarra, Comunidad Foral de
País Vasco
Rioja, La
Ceuta
Melilla
130.60
136.42
156.58
121.61
101.91
104.08
134.92
130.16
128.21
120.33
136.05
118.13
125.96
140.50
135.38
190.85
132.01
123.98
-
1.49
4.78
2.58
-1.35
4.23
0.30
7.23
3.43
7.15
-4.35
2.25
3.85
-3.81
-2.53
-8.14
6.13
2.26
-8.18
-
National general index and breakdown by rates
Index
TOTAL
Normal
Weekend
Annual variation
rate
130.60
1.49
129.48
1.23
133.19
1.69
National general index and breakdown by rent modality
Index
TOTAL
Shared use (in case of per room rent modality)
Full use (rent of entire dwelling)
RTAPI (ANNEX OF TABLES) - DECEMBER 2015
Annual variation
rate
130.60
1.49
113.85
1.41
135.36
1.50
29th January 2016
Tourist Accomodation Occupancy Survey
(Holiday Dwellings)
Year 2015
Provisional data
1. Travellers, overnight stays and average stay by Autonomous Cities and Communities
Autonomous Cities and
Communities
TOTAL
Andalucía
Aragón
Asturias, Principado de
Balears, Illes
Canarias
Cantabria
Castilla y León
Castilla-La Mancha
Cataluña
Comunitat Valenciana
Extremadura
Galicia
Madrid, Comunidad de
Murcia, Región de
Navarra, Comunidad Foral de
País Vasco
Rioja, La
Ceuta
Melilla
Annual rate
Travellers
Total
Residents
in Spain
Residents
abroad
Overnight stays
Total
Residents
in Spain
Residents
abroad
Average
stay
10,291,833
3,686,897
6,604,935
68,340,100
16,572,703
51,767,397
6.64
1,819,826
151,614
51,238
1,305,163
3,499,033
112,377
107,247
94,791
1,026,124
1,289,817
56,815
84,797
399,104
114,184
66,385
66,226
47,092
6.35
848,645
133,019
47,155
176,606
611,204
98,838
100,160
86,536
409,783
637,482
51,189
69,951
203,110
82,946
44,729
42,613
42,932
12.26
971,181
18,595
4,084
1,128,557
2,887,829
13,539
7,087
8,255
616,341
652,335
5,626
14,845
195,994
31,239
21,655
23,613
4,161
3.32
8,729,916
506,173
199,914
9,585,277
29,726,557
444,371
307,757
252,119
6,194,180
9,026,305
114,576
320,299
1,528,149
859,027
177,932
258,176
109,371
2.90
2,984,608
429,960
187,283
995,425
3,033,427
379,853
282,522
215,785
2,175,499
3,799,558
102,815
276,301
716,239
593,605
139,547
160,013
100,263
8.19
5,745,309
76,214
12,631
8,589,852
26,693,130
64,518
25,234
36,334
4,018,681
5,226,747
11,761
43,998
811,909
265,423
38,384
98,163
9,108
1.32
4.80
3.34
3.90
7.34
8.50
3.95
2.87
2.66
6.04
7.00
2.02
3.78
3.83
7.52
2.68
3.90
2.32
-3.24
2. Capacity, occupancy and number of staff by Autonomous Cities and Communities
Autonomous Cities and
Communities
Capacity1
Estimated
bedplaces
Estimated
Holiday
dwelling
Level of occupancy2
Per
Per
bedplaces
bedplaces
at weekend
Per Holiday
dwelling
Per Holiday
dwelling
at weekend
Employed
1
personnel
TOTAL
457,531
121,377
40.55
43.25
60.32
63.36
25,210
Andalucía
Aragón
Asturias, Principado de
Balears, Illes
Canarias
Cantabria
Castilla y León
Castilla-La Mancha
Cataluña
Comunitat Valenciana
Extremadura
Galicia
Madrid, Comunidad de
Murcia, Región de
Navarra, Comunidad Foral de
País Vasco
Rioja, La
Ceuta
Melilla
Annual rate
66,722
6,606
3,521
45,471
153,306
4,045
4,932
4,891
51,648
87,651
1,563
3,810
8,235
9,275
2,071
2,457
1,329
1.66
16,631
1,518
953
13,969
47,309
1,094
1,050
1,169
11,434
18,134
364
1,011
3,260
2,124
432
620
303
0.55
35.58
21.25
15.35
56.44
52.68
29.72
17.02
14.04
32.68
28.06
19.94
22.72
50.32
25.24
23.31
28.35
22.35
1.38
39.99
31.59
19.79
56.91
53.95
37.17
29.85
25.29
35.78
30.19
28.96
26.13
55.36
27.45
30.58
34.80
40.90
2.08
53.10
29.96
20.84
71.78
74.38
39.34
29.14
19.42
46.71
44.47
28.98
34.51
69.02
38.75
41.43
49.76
30.91
2.60
58.38
41.27
25.77
72.36
76.01
47.86
41.38
33.02
50.56
47.33
39.57
38.50
72.72
41.77
46.67
56.86
53.30
3.04
3,927
478
243
3,368
10,195
246
422
416
1,683
2,506
156
243
500
284
294
122
127
5.45
1
2
Annual average
Occupancy rate is weighted by number of bedplaces or by number of appartments.
HDOS (TABLES ANNEX) - ANNUAL 2015 (1/4)
29th January 2016
3. Travellers, overnight stays, capacity, occupancy, total number of staff with greater
number of overnight stays *
Provinces
Travellers
Residents
in Spain
Overnight stays
Residents
abroad
Residents
in Spain
Capacity**
Residents
abroad
Average
stay
Estimated
bedplaces
Level of occupancy***
Estimated Per
holiday
beddwelling places
Per
EmploPer Holidayed
Holiday
dwelling per-
dwelling at weekensonnel**
Palmas, Las
381,484
1,824,451
1,947,230
17,156,730
8.66
98,653
30,409
52.53
75.46
77.06
6,234
Santa Cruz de Tenerife
229,720
1,063,378
1,086,197
9,536,400
8.21
54,653
16,900
52.94
72.45
74.13
3,961
Alicante/Alacant
328,852
510,823
1,668,306
4,253,749
7.05
58,354
12,392
27.70
46.26
48.57
1,816
Málaga
270,319
701,790
1,033,477
4,804,183
6.01
39,550
9,727
40.19
62.09
65.18
2,418
Girona
125,364
214,096
746,983
1,728,482
7.29
24,383
5,073
27.47
37.26
39.92
614
Tarragona
155,263
174,418
682,936
1,242,638
5.84
15,653
3,115
33.71
49.87
55.45
490
Barcelona
91,261
224,800
630,948
1,033,136
5.27
9,365
2,780
49.00
65.63
69.01
495
159,284
149,346
129,184
99,523
41,989
20,118
1,088,678
1,042,574
591,562
563,749
409,250
156,929
6.38
7.59
5.01
13,705
15,591
7,469
2,778
2,964
1,683
32.71
25.31
27.22
46.99
34.60
40.19
51.42
38.29
47.51
388
301
222
Sevilla
115,208
124,139
298,330
374,795
2.81
4,239
1,299
43.04
59.89
69.12
330
Granada
115,665
73,659
329,523
232,545
2.97
4,867
1,271
31.35
41.38
49.96
403
293
Valencia\València
Castellón\Castelló
Almería
Cádiz
82,293
33,486
296,984
123,145
3.63
4,127
1,077
27.31
36.59
43.24
Huelva
71,362
5,386
277,751
25,495
3.95
3,271
773
25.15
31.10
38.99
55
Huesca
67,967
8,078
244,377
30,626
3.62
3,646
804
21.20
26.51
38.17
255
4. Travellers, overnight stays, capacity, occupancy, total number of staff
from tourist areas with greater number of overnight stays
Tourist Areas
Travellers
Residents
in Spain
Overnight stays
Residents
abroad
Residents
in Spain
Capacity**
Residents
abroad
Average
stay
Estimated
bedplaces
Level of occupancy***
Estimated Per
holiday
beddwelling places
Per
EmploPer Holidayed
Holiday
dwelling per-
dwelling at weekensonnel**
Isla de Tenerife
174,231
998,563
827,246
8,957,171
8.34
48,495
14,754
54.94
75.40
76.94
3,442
Isla de Gran Canaria
224,889
771,408
1,081,050
7,726,860
8.84
47,130
14,989
50.95
72.08
74.70
2,847
Isla de Lanzarote
98,134
767,669
569,951
6,734,465
8.44
35,211
10,385
56.09
81.05
81.54
2,472
Costa Blanca
321,211
504,398
1,610,717
4,171,175
7.00
56,260
11,932
28.03
46.82
49.18
1,765
Isla de Mallorca
Costa del Sol
63,973
236,928
678,711
669,821
293,637
945,357
5,397,935
4,674,202
7.66
6.20
26,378
37,669
8,213
9,265
57.53
40.62
73.19
62.89
73.53
65.82
2,028
2,323
Isla de Fuerteventura
58,461
285,374
296,229
2,695,405
8.70
16,312
5,035
49.39
73.97
74.85
915
Costa Brava
94,598
212,022
655,468
1,721,713
7.75
22,773
4,755
28.23
38.23
40.21
512
67,984
284,003
389,386
1,869,333
6.42
11,271
3,571
53.98
67.10
68.20
801
144,370
171,741
637,675
1,229,819
5.91
14,877
2,981
34.11
50.45
56.05
444
Islas de Ibiza y Formentera
Costa Daurada
5. Travellers, overnight stays, capacity, occupancy, total number of staff
from tourist sites with greater number at overnights stays
Tourist sites
San Bartolomé de Tirajana
Arona
Tías
Mogán
Adeje
Benidorm
Teguise
Madrid
152,099
453,580
725,892
EmploCapacity**
Level of occupancy***
Per
Per Holidayed
AveEstimated Estimated Per
rage
bedholiday
bedHoliday dwelling perstay
places
dwelling places dwelling at weekensonnel**
4,761,107
9.06
29,800
9,601
50.11
72.66
75.75
1,764
45,150
53,608
57,752
437,960
417,492
303,517
230,962
310,945
276,676
4,080,625
3,640,869
2,847,892
8.92
8.39
8.65
20,088
18,460
16,457
6,179
5,768
4,999
58.51
57.54
51.95
76.90
81.80
71.27
78.09
82.18
72.84
1,457
1,139
1,009
36,448
327,719
181,470
2,860,839
8.35
15,423
4,296
53.67
79.78
80.78
994
110,051
38,372
192,595
237,342
211,562
188,840
596,962
229,475
659,213
2,002,240
1,906,581
779,355
7.48
8.55
3.77
18,957
9,839
7,610
4,555
2,896
3,002
37.44
58.83
51.24
59.50
82.86
69.87
62.23
83.40
73.62
713
690
451
Travellers
Residents
in Spain
Residents
abroad
Overnight stays
Residents Residents
in Spain
abroad
Calvià
14,480
149,723
82,264
1,227,673
7.98
5,927
1,920
59.32
74.05
74.81
502
Alcúdia
20,700
155,444
82,528
1,140,887
6.95
5,981
1,807
60.44
75.34
75.72
354
* Provinces belonging to uniprovincial Autonomous Communities have not been included because they are reflected
in previous tables.
** Annual average
***Occupancy rate is weighted by number of bedplaces or by number of appartments.
HDOS (TABLES ANNEX) - ANNUAL 2015 (2/4)
Provisional data
6. Travellers and overnight stays by countries of residence
Countries
Travellers
Total
TOTAL
Residents in Spain
Residents abroad
Total residents abroad
Total residents in E.U (excluding Spain)
- Germany
- Austria
- Belgium
-Denmark
- Finland
- France
- Greece
- Ireland
- Italy
- Luxembourg
- Netherlands
- Poland
- Portugal
- United Kingdom
- Czech Republic
- Sweden
- Other EU countries
Norway
Russia
Switzerland
Other european countries
United States of America
Rest of America
African countries
Other countries
HDOS (TABLES ANNEX) - ANNUAL 2015 (3/4)
Overnight stays
Total
%
%
10,291,833
100.00
68,340,100
100.00
3,686,897
6,604,935
6,604,935
5,649,007
864,137
30,177
111,623
168,350
149,366
524,877
5,392
310,202
279,662
8,736
389,516
63,638
58,190
2,296,325
20,980
291,316
76,521
237,681
99,882
76,313
69,807
107,604
116,903
61,931
183,823
35.82
64.18
100.00
85.53
13.08
0.46
1.69
2.55
2.26
7.95
0.08
4.70
4.23
0.13
5.90
0.96
0.88
34.77
0.32
4.41
1.16
3.60
1.51
1.16
1.06
1.63
1.77
0.94
2.78
16,572,703
51,767,397
51,767,397
45,209,776
8,171,924
244,623
829,599
1,323,293
1,261,142
3,531,895
27,432
2,408,183
1,661,740
80,935
3,436,369
435,385
282,540
18,341,161
151,765
2,505,695
516,095
2,409,112
796,375
563,228
479,736
467,419
673,935
341,333
812,404
24.25
75.75
100.00
87.33
15.79
0.47
1.60
2.56
2.44
6.82
0.05
4.65
3.21
0.16
6.64
0.84
0.55
35.43
0.29
4.84
1.00
4.65
1.54
1.09
0.93
0.90
1.30
0.66
1.57
Provisional data
7. 2015 Evolution: Travellers, overnight stays and average stay
Travellers
Total
Residents
in Spain
Residents
abroad
Overnight stays
Total
Residents
in Spain
Residents
abroad
Average
stay
TOTAL
10,291,833
3,686,897
6,604,935
68,340,100
16,572,703
51,767,397
6.64
January
464,014
122,139
341,874
3,742,037
508,787
3,233,250
8.06
February
499,576
151,058
348,518
3,640,308
489,026
3,151,282
7.29
March
579,109
184,401
394,708
4,095,992
637,700
3,458,292
7.07
April
746,642
290,379
456,263
4,271,193
1,021,771
3,249,421
5.72
May
882,639
301,741
580,898
4,812,490
1,002,161
3,810,329
5.45
June
1,042,900
396,963
645,937
6,342,224
1,668,308
4,673,916
6.08
July
1,402,491
538,093
864,398
9,663,933
2,982,796
6,681,138
6.89
August
1,574,273
675,248
899,024
11,411,069
4,158,993
7,252,076
7.25
September
1,065,292
369,080
696,211
7,062,751
1,784,958
5,277,793
6.63
October
879,779
273,231
606,548
5,442,718
969,878
4,472,840
6.19
November
552,388
152,377
400,011
3,887,716
554,039
3,333,677
7.04
December
602,730
232,186
370,544
3,967,669
794,285
3,173,384
6.58
8. Capacity, occupancy rate and employed personnel
Autonomous
Communities
Capacity*
Estimated
bedplaces
Estimated
Holiday
dwelling
Level of occupancy**
Per
Per
bedplaces
bedplaces
at weekend
Per Holiday
dwelling
Per Holiday
dwelling
at weekend
Employed*
personnel
TOTAL*
457,531
121,377
40.55
43.25
60.32
63.36
January
95,588
95,544
34.31
36.83
36.36
39.41
57.20
61.24
59.12
19,604
February
350,923
351,534
25,210
63.89
19,854
March
372,463
100,500
35.42
38.18
59.11
62.07
20,743
April
434,978
113,989
32.60
37.34
50.15
55.74
23,193
May
494,519
131,723
31.26
35.83
47.87
53.07
26,864
June
551,124
144,363
38.16
41.99
55.82
60.17
29,707
July
578,334
150,757
53.27
54.61
68.99
70.58
31,895
August
584,324
151,755
62.26
63.05
78.39
79.47
31,975
September
574,699
150,578
40.76
44.05
62.89
66.74
30,548
October
469,285
125,593
37.21
40.14
58.01
61.36
25,788
November
364,883
98,209
35.44
37.95
60.15
62.90
21,135
December
363,310
97,919
35.22
36.10
56.77
57.46
21,208
* Annual Average. Average Occupancy rates weighted by appartments or bedplaces.
HDOS (TABLES ANNEX) - ANNUAL 2015 (4/4)
Provisional data
Tourist Accomodation Occupancy Survey
Campsite Occupancy Survey (COS)
Year 2015
Provisional data
1. Travellers, overnight stays and average stay by category of establishment
Category
TOTAL
Luxury and first-class
Second-class
Third-class
Cumulative annual rate
Travellers
Total
Residents
in
Spain
Overnight stays
Total
Residents
in
Spain
Residents
abroad
Residents
abroad
Average
stay
6,712,586
3,022,583
3,149,213
540,791
4,479,530
1,874,101
2,170,043
435,386
2,233,056
1,148,482
979,170
105,405
34,482,061
16,342,881
15,924,310
2,214,870
17,920,782
7,738,809
8,394,157
1,787,817
16,561,279
8,604,072
7,530,153
427,054
5.14
5.41
5.06
4.10
6.00
5.29
7.46
6.72
5.96
7.57
0.68
2. Open establishments, capacity, occupancy and number of
staff by category of establishments
Category
TOTAL
Capacity*
Estimated
Estimated
open
establishmentsbed-places
Occupied
pitches
Estimated
pitches
Occupancy
rate
per pitch**
Weekend
occupancy
rate**
Employed
personnel*
492,409
208,913
239,857
43,640
151,785
62,648
75,434
13,703
21,224,702
9,014,197
10,472,245
1,738,260
38.18
40.45
Luxury and first-class
Second-class
Third-class
756
202
423
132
39.28
37.92
34.63
41.26
40.42
37.28
6,003.07
2,792.13
2,725.92
485.02
Cumulative annual rate
1.27
0.89
0.82
4.59
3.71
2.86
5.89
3. Travellers, overnight stays and average stay by autonomous cities and communities
Autonomous cities and
communities
Travellers
Total
Residents
in
Spain
TOTAL
6,712,586
Andalucía
909,204
Aragón
322,336
Asturias, Principado de
169,739
Balears, Illes
36,050
Canarias
25,539
Cantabria
262,216
Castilla y León
278,196
Castilla-La Mancha
84,855
Cataluña
2,754,056
Comunitat Valenciana
765,667
Extremadura
120,813
Galicia
223,865
Madrid, Comunidad de
209,533
Murcia, Región de
118,595
Navarra, Comunidad Foral de
145,242
País Vasco
172,055
Rioja, La
114,624
Ceuta
Melilla
*Anual average
**Occupancy rate is weighted by number of pitches
COS (TABLES ANNEX) - ANNUAL 2015 (1/5)
4,479,530
630,629
207,744
122,366
17,139
23,147
191,678
187,288
70,680
1,717,566
498,358
94,150
166,390
176,064
76,716
115,675
84,644
99,296
-
Residents
abroad
2,233,056
278,575
114,593
47,373
18,911
2,392
70,538
90,908
14,176
1,036,490
267,309
26,663
57,476
33,469
41,880
29,567
87,411
15,328
-
Overnight stays
Total
Residents
in
Spain
34,482,061
3,805,567
993,268
728,794
177,528
101,880
1,315,697
706,638
230,208
15,232,562
6,983,649
297,595
837,670
745,067
1,086,614
421,731
491,483
326,109
-
17,920,782
2,260,574
653,160
600,374
58,495
64,427
1,066,043
559,765
203,996
7,047,678
2,545,096
244,423
706,738
661,778
309,781
368,578
271,327
298,549
-
Residents
abroad
16,561,279
1,544,994
340,108
128,420
119,033
37,453
249,654
146,873
26,212
8,184,884
4,438,554
53,172
130,932
83,289
776,833
53,153
220,156
27,561
-
Average
stay
5.14
4.19
3.08
4.29
4.92
3.99
5.02
2.54
2.71
5.53
9.12
2.46
3.74
3.56
9.16
2.90
2.86
2.85
-
29th January 2015
4. Open establishments, capacity, occupancy and number of
staff by autonomous cities and communities
Autonomous cities and
communities
TOTAL
Andalucía
Aragón
Asturias, Principado de
Balears, Illes
Canarias
Cantabria
Castilla y León
Castilla-La Mancha
Cataluña
Comunitat Valenciana
Extremadura
Galicia
Madrid, Comunidad de
Murcia, Región de
Navarra, Comunidad Foral de
País Vasco
Rioja, La
Ceuta
Melilla
Estimated
open
estab.*
758
119
65
24
6
5
26
54
19
191
103
20
48
20
18
17
17
8
-
Capacity*
Estimated
bed-places
493,154
69,893
24,417
13,114
2,234
4,434
19,092
21,508
7,143
179,673
68,369
7,275
17,080
17,596
14,939
10,515
8,468
7,402
-
Estimated
pitches
152,075
22,595
7,404
4,088
870
1,432
5,839
6,790
2,134
53,360
21,479
2,340
5,510
5,900
4,933
2,622
2,525
2,253
-
Occupied
pitches
21,224,702
2,115,240
681,568
405,243
74,159
87,106
953,237
597,296
196,734
8,366,562
4,076,095
250,424
409,915
1,081,238
661,724
410,127
348,562
509,472
-
Occupancy Weekend Employed
occupancy personnel*
rate
rate**
per
pitch**
38.18
25.60
25.10
26.93
34.73
16.65
44.49
23.97
25.16
42.73
51.98
29.20
20.21
50.18
36.82
42.70
37.64
61.98
-
40.45
29.08
27.96
30.62
28.49
20.07
45.40
26.34
28.49
44.85
52.93
34.61
21.71
51.85
41.42
43.07
39.99
61.35
-
6,003
844
288
119
65
24
147
191
72
2,326
953
114
208
199
194
115
105
60
-
5. Travellers and overnight stays, average stay, capacity, occupancy and
number of staff by provinces with the greater number of overnight stays***
Provinces
Girona
Tarragona
Alicante/Alacant
Barcelona
Castellón/Castelló
Cantabria
Valencia/València
Málaga
Murcia
Cádiz
Huesca
Madrid
Asturias
Huelva
Almería
Travellers
Residents
in
Spain
606,160
506,057
166,498
470,903
138,520
191,678
193,340
95,831
76,716
204,393
162,505
176,064
122,366
140,415
57,524
Residents
abroad
591,283
247,141
122,929
172,435
92,503
70,538
51,877
66,524
41,880
60,005
78,527
33,469
47,373
18,868
35,026
Overnight stays
Residents
Residents
in
abroad
Spain
2,138,385
2,958,499
993,747
1,497,361
784,025
1,066,043
767,324
399,987
309,781
686,059
511,217
661,778
600,374
558,135
261,371
4,870,927
2,152,142
2,998,472
1,091,569
1,027,828
249,654
412,253
702,319
776,833
234,019
240,505
83,289
128,420
75,265
266,070
Average
stay
5.85
6.79
13.79
4.02
7.84
5.02
4.81
6.79
9.16
3.48
3.12
3.56
4.29
3.98
5.70
Estimated Estimated Occupancy Employed
open
pitches*
rate
personnel*
establishme
per
pitch**
75
40
38
43
35
26
30
28
18
21
43
20
24
11
17
22,546
15,227
9,556
10,643
6,252
5,839
5,671
4,626
4,933
5,073
5,236
5,900
4,088
4,610
2,490
41.34
43.95
61.18
46.00
43.82
44.49
45.48
36.25
36.82
24.65
29.15
50.18
26.93
23.29
29.02
1,191
630
445
375
277
147
231
194
194
196
212
199
119
119
101
*Anual average
**Occupancy rate is weighted by number of pitches
***Provinces belonging to uniprovincial Autonomous Communities have not been included because they are reflected in previous tables.
COS (TABLES ANNEX) - ANNUAL 2015 (2/5)
Provisional data
6. Travellers, overnight stays, average stay, open establishments, capacity, occupancy
and number of staff from tourist areas with the greatest number of overnight stays
Tourist areas
Travellers
Residents
in
Spain
Overnight stays
Residents
abroad
Residents
in
Spain
Residents
abroad
Average
stay
Estimated
Estimated
open
pitches*
establishments*
Occupancy
rate
per pitch**
Employed
personnel*
Costa Brava
482,870
580,401
1,807,963
4,825,484
6.24
55
20,213
41.20
1,095
Costa Daurada
449,468
217,663
2,623,678
1,990,957
6.92
30
13,431
44.94
540
Costa Blanca
Costa Barcelona 2015
138,579
99,737
801,467
2,613,127
14.33
29
7,336
66.96
384
342,616
167,293
1,151,855
1,075,609
4.37
24
8,512
44.36
289
PNat Aiguamolls de
87,113
186,688
424,583
1,646,139
7.56
11
4,668
46.34
309
Costa de Castellón
114,082
85,126
723,653
993,672
8.62
28
5,687
44.59
257
Pirineus
330,693
36,746
942,984
114,869
2.88
59
7,909
43.59
258
74,183
52,936
355,325
654,414
7.94
13
3,278
45.60
142
Costa del Sol
Costa Valencia
119,714
39,855
592,384
375,418
6.07
15
3,781
48.07
149
38,656
35,647
181,292
719,871
12.13
9
3,823
38.39
150
Costa de la Luz (Cádiz)
194,221
55,173
660,523
223,231
3.54
17
4,450
24.57
174
Pirineo Aragonés
159,283
73,302
506,445
236,108
3.19
38
4,956
28.80
205
Costa Cálida
Costa Verde
104,607
39,360
543,616
108,011
4.53
19
3,406
29.35
101
Rías Baixas
125,305
33,442
508,892
82,883
3.73
26
3,652
18.51
138
Costa de la Luz (Huelva)
123,741
14,998
506,076
58,683
4.07
6
3,889
22.52
88
7. Travellers, overnight stays, average stay, open establishments, capacity, occupancy
and number of staff from tourist sites with the greatest number at overnights stays
Tourist sites
Travellers
Residents
in
Overnight stays
Residents
abroad
Spain
Benidorm
Mont-roig del Camp
Residents
in
Residents
abroad
Average
stay
Estimated
Estimated
open
pitches*
establishments*
Occupancy
rate
per pitch**
Employed
personnel*
Spain
31,486
39,773
186,293
1,658,459
25.89
9
3,799
73.76
156
63,606
67,278
397,473
814,521
9.26
4
2,878
38.79
120
Torroella de Montgrí
Sant Pere Pescador
18,997
89,256
87,550
849,755
8.66
5
2,104
54.62
159
33,966
75,585
120,039
659,341
7.11
4
2,076
50.50
179
Castelló d'Empúries
21,743
52,188
161,961
566,134
9.85
4
2,357
49.30
152
Salou
46,863
40,514
271,000
423,365
7.95
3
2,054
54.15
103
Blanes
Tarragona
68,854
43,632
301,154
384,797
6.10
7
2,290
47.47
112
77,499
30,013
436,747
227,117
6.17
5
2,683
59.78
168
Cambrils
43,676
26,676
451,403
201,270
9.28
4
2,377
40.97
74
Calonge
32,363
52,132
155,432
477,850
7.49
3
2,048
33.63
97
Marbella
27,996
21,845
171,703
355,023
10.57
3
1,311
48.57
58
Cartagena
14,588
19,166
68,319
458,130
15.60
3
2,537
28.81
91
*Anual average
**Occupancy rate is weighted by number of pitches
COS (TABLES ANNEX) - ANNUAL 2015 (3/5)
Provisional data
8. Guests and overnight stays by countries of residence
Countries
Guests
Total
TOTAL
6,712,586
Residentes en España
Residentes en el Extranjero
TOTAL residentes en el extranjero
TOTAL residentes en U.E (sin España)
- Alemania
- Austria
- Bélgica
- Dinamarca
- Finlandia
- Francia
- Grecia
- Irlanda
- Italia
- Luxemburgo
- Países Bajos
- Polonia
- Portugal
- Reino Unido
- República Checa
- Suecia
- Resto de la UE
Noruega
Rusia
Suiza
Otros países europeos
Estados Unidos
Resto de América
4,479,530
Países africanos
Resto del mundo
COS (TABLES ANNEX) - ANNUAL 2015 (4/5)
Overnight stays
Total
%
%
100.00
66.73
34,482,061
2,233,056
33.27
16,561,279
48.03
2,233,056
100.00
16,561,279
100.00
2,114,461
358,208
16,281
107,874
17,319
6,801
670,165
1,045
39,815
77,258
3,694
432,342
16,976
47,528
274,032
9,294
18,180
17,650
5,585
1,872
51,827
16,006,951
2,747,134
67,864
953,904
154,051
66,526
3,703,249
2,121
337,307
235,958
23,417
3,958,776
75,028
124,013
3,274,405
31,555
191,159
60,484
60,916
8,405
285,339
12,864
94.69
16.04
0.73
4.83
0.78
0.30
30.01
0.05
1.78
3.46
0.17
19.36
0.76
2.13
12.27
0.42
0.81
0.79
0.25
0.08
2.32
0.58
96.65
16.59
0.41
5.76
0.93
0.40
22.36
0.01
2.04
1.42
0.14
23.90
0.45
0.75
19.77
0.19
1.15
0.37
0.37
0.05
1.72
0.33
6,113
0.27
16,582
0.10
10,633
0.48
29,487
0.18
17,920,782
54,567
100.00
51.97
1,787
0.08
5,790
0.03
27,914
1.25
93,241
0.56
Provisional data
9. 2015 Evolution: Travellers, overnight stays and average stay
months
TOTAL
Enero
Febrero
Marzo
Abril
Mayo
Junio
Julio
Agosto
Septiembre
Octubre
Noviembre
Diciembre
Travellers
Total
Residents
in Spain
Residents
abroad
Overnight stays
Total
Residents
in Spain
Average
stay
Residents
abroad
6,712,586
4,479,530
2,233,056
34,482,061
17,920,782
16,561,279
5.14
108,669
62,457
46,213
938,523
189,564
748,959
8.64
123,684
78,925
44,759
955,730
221,094
734,636
7.73
228,821
155,785
73,036
1,186,414
420,513
765,902
5.18
525,963
388,394
137,569
2,169,798
1,319,641
850,156
4.13
574,812
362,956
211,856
2,365,866
1,158,365
1,207,501
4.12
774,370
560,526
213,844
3,211,407
1,858,227
1,353,180
4.15
1,394,242
886,402
507,839
7,284,095
3,957,360
3,326,736
5.22
1,761,029
1,185,502
575,528
9,765,678
6,007,199
3,758,479
5.55
616,131
390,740
225,391
3,106,121
1,595,649
1,510,473
5.04
326,232
216,121
110,111
1,602,221
643,051
959,170
4.91
139,486
92,444
47,042
914,615
264,258
650,357
6.56
139,147
99,279
39,869
981,593
285,863
695,730
7.05
10.Open establishments, capacity, occupancy rate and employed personnel
months
Capacity*
Estimated
Estimated
open
establishments* bed-places
Estimated
pitches
Occupied
pitches
Occupancy
rate
per pitch**
Weekend
occupancy
rate**
Employed
personnel*
TOTAL
756
492,409
151,785
21,224,702
38.18
40.45
6,003
January
431
260,469
82,463
901,704
35.27
36.73
2,684
February
457
284,004
89,818
931,630
37.04
39.41
2,804
March
551
352,499
110,183
1,168,336
34.21
35.35
3,617
April
835
566,478
174,577
1,702,437
32.51
34.92
5,757
May
873
611,702
187,078
1,889,703
32.58
36.69
6,600
June
1,038
704,819
214,305
2,226,202
34.63
38.72
8,478
July
1,160
748,355
228,027
3,178,870
44.97
48.18
11,827
August
1,178
755,955
229,927
3,863,027
54.20
55.91
12,127
September
991
658,723
201,550
2,154,704
35.64
38.20
7,863
October
608
392,158
121,375
1,310,514
34.83
36.94
4,353
November
493
301,765
95,692
953,714
33.22
34.04
3,138
December
453
271,983
86,422
943,861
35.23
34.70
2,787
*Anual average
**Occupancy rate is weighted by number of pitches
COS (TABLES ANNEX) - ANNUAL 2015 (5/5)
Provisional data
Tourist accommodation occupancy survey:
(Rural tourist accommodation)
Year 2015
Provisional data
1. Number of travellers, overnight stays and average stay by Autonomous Cities
and Communities
Autonomous
Communities
TOTAL
Andalucía
Aragón
Asturias, Principado de
Balears, Illes
Canarias
Cantabria
Castilla y León
Castilla-La Mancha
Cataluña
Comunitat Valenciana
Extremadura
Galicia
Madrid, Comunidad de
Murcia, Región de
Navarra, Comunidad Foral de
País Vasco
Rioja, La
Ceuta
Melilla
Interannual rate
Number of travellers
Total
Residents
In Spain
3,222,266
224,346
150,541
207,602
194,271
73,958
206,227
642,251
214,965
378,740
127,873
160,615
189,685
114,712
35,616
128,920
140,759
31,186
14.15
2,685,551
166,637
135,691
197,434
28,855
26,743
185,368
593,313
209,753
330,971
117,785
152,368
146,108
104,637
32,389
108,545
120,176
28,773
13.96
Residents
abroad
536,716
57,709
14,851
10,168
165,416
47,215
20,860
48,939
5,212
47,768
10,086
8,247
43,575
10,075
3,226
20,373
20,587
2,413
15.10
Number of overnight stays
Total
Residents
In Spain
8,746,210
770,956
448,465
681,217
823,620
385,045
483,709
1,418,651
508,253
1,060,772
375,276
348,893
357,757
209,225
91,243
342,196
368,386
72,543
12.85
6,620,289
443,784
396,294
644,244
84,263
106,769
433,758
1,327,211
492,637
800,531
316,018
327,426
287,666
191,963
79,420
305,532
315,841
66,938
13.80
Residents
abroad
2,125,921
327,174
52,173
36,972
739,359
278,274
49,951
91,442
15,616
260,243
59,256
21,468
70,093
17,263
11,823
36,666
52,545
5,604
9.98
Average
stay
2.71
3.44
2.98
3.28
4.24
5.21
2.35
2.21
2.36
2.80
2.93
2.17
1.89
1.82
2.56
2.65
2.62
2.33
-1.14
2. Open rural tourist accommodation and estimated vacancies, levels
of occupancy and personnel employed by Autonomous Cities and Communities
Autonomous
Communities
TOTAL
Andalucía
Aragón
Asturias, Principado de
Balears, Illes
Canarias
Cantabria
Castilla y León
Castilla-La Mancha
Cataluña
Comunitat Valenciana
Extremadura
Galicia
Madrid, Comunidad de
Murcia, Región de
Navarra, Comunidad Foral de
País Vasco
Rioja, La
Ceuta
Melilla
Interannual rate
Nº of rural
open
estimated
accom.*
15,305
1,517
1,179
1,254
222
656
350
3,292
1,445
1,973
916
538
495
241
137
632
344
115
0.55
Nº of
vacancies*
142,994
13,183
9,262
11,789
4,327
3,964
6,000
28,818
12,682
16,001
9,283
6,510
6,222
3,559
1,968
4,645
3,715
1,068
1.07
Level of occupancy*
By vacancies By vacancies
at week
end
16.56
29.45
15.87
25.90
13.09
23.30
15.61
21.62
51.43
53.07
26.51
28.08
21.58
36.24
13.38
29.61
10.89
26.26
17.97
35.77
11.00
18.95
14.60
31.53
15.48
24.18
16.03
36.95
12.61
24.18
19.83
38.02
26.49
40.57
18.32
40.62
11.56
13.06
By rooms
20.03
20.95
15.82
18.26
56.05
40.25
24.08
16.10
13.34
21.10
16.53
18.74
16.41
20.95
16.35
22.05
29.60
19.23
9.75
Employed
personnel*
21,971
2,144
1,324
1,600
1,382
893
606
4,546
1,833
2,700
1,391
794
797
468
216
747
393
137
0.67
* Annual average and weighted average per places or rooms
EOTR (TABLES ANNEX) - YEAR 2015 (1/5)
The 29th of January of 2016
3. Number of travellers, overnight stays and average stay of provinces with
1
the greatest number of overnight stays
Provinces
Number of travellers
Total
Number of overnight stays
Residents
Residents
In Spain
abroad
Total
Average
Residents
Residents
In Spain
abroad
stay
Girona
169,691
144,019
25,672
487,580
361,939
125,641
2.87
Málaga
55,934
28,646
27,288
313,348
108,822
204,526
5.60
Cáceres
133,733
127,666
6,067
296,702
280,477
16,225
2.22
Barcelona
100,506
87,698
12,808
292,607
209,074
83,533
2.91
53,024
18,662
34,361
291,905
82,887
209,018
5.51
116,568
113,195
3,372
291,353
277,968
13,386
2.50
Huesca
79,485
67,787
11,699
261,482
219,194
42,288
3.29
Segovia
107,387
103,931
3,455
210,854
202,833
8,021
1.96
Gipuzkoa
77,336
65,274
12,062
209,423
178,580
30,842
2.71
Lleida
72,214
68,792
3,422
190,993
164,930
26,063
2.64
Santa Cruz de Tenerife
Ávila
Salamanca
80,249
74,709
5,540
175,102
163,499
11,603
2.18
León
75,939
64,219
11,721
173,288
156,926
16,361
2.28
Soria
70,855
69,463
1,392
170,805
167,241
3,565
2.41
Burgos
74,590
58,966
15,624
153,284
131,887
21,397
2.06
Albacete
53,660
53,348
312
147,205
142,735
4,470
2.74
4. Open rural tourist accommodation and estimated vacancies degrees of occupancy
and personnel employed in provinces with the highest number of overnight stays1
Provinces
Nº of rural
Nº of
Level of occupancy*
open
vacancies*
By vacancies
estimated
Employed
By vacancies
By rooms
personnel*
at the
accommodation*
weekend
Girona
682
5,705
23.12
43.51
26.53
Málaga
568
3,736
22.70
28.73
30.97
1,048
722
Cáceres
453
5,496
14.71
32.26
18.97
652
Barcelona
499
4,316
18.38
38.71
22.03
693
Santa Cruz de Tenerife
530
2,986
26.69
27.78
41.01
704
Ávila
772
5,818
13.67
30.25
18.35
1,103
Huesca
628
4,665
15.15
24.67
17.29
686
Segovia
403
3,690
15.56
40.89
17.62
560
Gipuzkoa
158
1,806
30.95
43.51
35.12
196
Lleida
539
3,832
13.55
28.30
15.87
676
Salamanca
478
3,827
12.45
27.22
14.71
612
León
415
3,550
13.22
25.39
15.08
614
Soria
313
2,884
16.02
35.22
17.14
390
Burgos
350
3,548
11.72
25.98
14.01
441
Albacete
581
3,784
10.56
24.05
12.49
662
2
Provinces belonging to uniprovincial Autonomous Communities have not been included because they are reflected in previous tables.
* Annual average and weighted average per places or rooms
EOTR (TABLES ANNEX) - YEAR 2015 (2/5)
Provisional data
5. Number of travellers, overnight stays, average stay, estimated vacancies, levels of
occupancy and personnel employed in areas with the highest number of overnight stays
Areas
Isla de Mallorca
Number of travellers
Number of overnight stays
Residents
Residents
Residents
Residents
Average Nº of rural
Capacity
Level of occupancy*
In Spain
abroad
In Spain
abroad
stay
Nº of
By
By vacancies By rooms
open estima- vacan-
vacan-
at week
ted accom.*
cies
end
cies*
18,394
143,802
48,906
649,416
4.31
189
3,654
51.67
51.54
56.54
138,861
9,562
343,309
55,691
2.69
806
6,123
17.68
37.84
19.87
Pirineo Navarro
96,915
15,898
280,159
28,181
2.73
569
4,121
20.11
38.01
22.50
Costa Brava
77,864
20,125
201,843
105,485
3.14
395
3,437
24.16
41.95
27.96
Costa Verde
69,418
4,380
259,461
16,275
3.74
400
4,246
17.44
22.71
19.73
Pirineo Aragonés
63,070
10,153
204,500
39,540
3.33
570
4,261
15.45
25.98
17.28
P. Nacional Picos de Europa
45,484
3,262
139,081
11,400
3.09
235
2,270
17.96
25.12
20.38
Isla de Tenerife
12,223
21,716
26,935
105,741
3.91
123
1,210
29.87
32.83
40.70
Isla de La Palma
4,623
8,849
42,490
76,057
8.80
297
1,214
26.73
25.97
45.53
P. Natural de Corona Forestal
10,318
17,153
21,855
81,754
3.77
90
934
30.19
33.09
41.03
Pirineo Vasco
31,036
5,310
85,840
15,434
2.79
112
1,177
22.86
36.21
24.28
9,734
16,806
20,635
79,943
3.79
81
864
31.65
34.36
43.02
25,534
5,170
66,933
11,897
2.57
56
646
32.82
48.26
36.59
23,063
1,349
62,936
8,139
2.91
90
720
26.67
56.11
30.65
3,090
5,659
24,138
46,241
8.04
175
720
26.72
26.47
45.30
Pirineus
P. Nacional Teide
Costa de Gipuzkoa
P. Natural de la Zona
Volcánica La Garrotxa
P. Nacional Taburiente
6. Number of travellers, overnight stays, average stay, estimated vacancies, levels of occupancy
and personnel employed class per rural house per Autonomous Cities and Communities2
Autonomous
Number of travellers
Number of overnight stays
Communities
Residents
Residents
Residents
Residents
Average Nº of rural
In Spain
abroad
In Spain
abroad
stay
TOTAL
Capacity
Level of occupancy*
Nº of
By
open estima- vacan-
vacan-
at week
ted accom.*
cies
end
cies*
Employed
By vacancies personnel*
1,728,250
267,335
4,486,418
1,188,448
2.84
12,996
######
14.83
28.12
16,722
Andalucía
165,628
56,633
442,498
329,459
3.47
1,520
13,181
15.94
26.17
2,144
Aragón
101,961
10,596
274,211
36,744
2.76
906
7,035
11.99
22.29
1,018
Asturias, Principado de
63,070
3,255
241,189
15,979
3.88
798
4,994
13.90
18.23
914
Balears, Illes
11,714
39,180
26,787
120,442
2.89
56
816
49.07
54.27
170
Canarias
12,204
25,093
77,383
181,275
6.94
626
3,157
22.43
23.31
743
Cantabria
36,156
2,502
106,940
9,965
3.02
142
2,082
15.25
26.16
198
Castilla y León
326,781
8,201
856,226
35,511
2.66
2,872
20,062
12.11
27.98
3,498
Castilla-La Mancha
200,493
4,931
467,032
15,175
2.35
1,415
12,059
10.90
26.86
1,788
Cataluña
328,916
46,988
799,302
260,119
2.82
1,979
16,064
17.92
35.65
2,712
Comunitat Valenciana
78,824
8,566
212,293
51,822
3.02
873
7,033
10.24
18.94
1,248
Extremadura
59,706
3,165
125,805
8,330
2.13
317
3,096
11.81
28.59
390
Galicia
99,865
24,017
209,613
43,384
2.04
364
4,336
15.73
24.91
532
Madrid, Comunidad de
21,432
1,188
46,233
3,739
2.21
70
727
18.78
41.90
102
Murcia, Región de
22,029
1,232
64,142
7,954
3.10
124
1,626
12.07
24.66
172
108,740
18,707
304,886
34,556
2.66
632
4,647
19.70
37.94
747
País Vasco
62,220
10,596
165,493
28,298
2.66
186
1,939
26.56
40.83
212
Rioja, La
28,517
2,479
66,386
5,698
2.33
115
1,068
18.24
40.41
137
Ceuta
-
-
-
-
-
-
-
-
-
-
Melilla
-
-
-
-
-
-
-
-
-
-
Navarra, Comunidad Foral de
2
To facilitate the comparability between data from different Autonomous Communities (and because of the different regulation and different
characteristics), a group called rural house has been created, with those accommodations with similar typology (location, capacity, etc…).
The variables included in the previous table have been estimated with that type of establishments.
The variables shown in the table have been estimated with the type of accomodation under rural tourist accomodation.
* Annual average and weighted average per places or rooms
EOTR (TABLES ANNEX) - YEAR 2015 (3/5)
Provisional data
7. Travellers and overnight stays by country of residence
Results by countries
Travellers
Total
Overnight stays
Total
%
%
TOTAL
3,222,266
100.00
8,746,210
Residents Spain
2,685,551
83.34
6,620,289
75.69
Residents abroad
536,716
16.66
2,125,921
24.31
Total Residents abroad
536,716
100.00
2,125,921
100.00
Total Residents in UE (excluding Spain)
- Germany
- Belgium
- France
- Italy
- Netherlands
- Portugal
- United Kingdom
Sweden
Other European countries
United States of America
Other countries
435,797
142,188
21,346
81,916
20,143
39,014
8,980
89,153
17,913
49,953
26,747
81.20
26.49
3.98
15.26
3.75
7.27
1.67
16.61
3.34
9.31
4.98
1,861,222
705,377
94,977
295,645
51,632
188,125
21,384
367,792
76,198
188,929
55,728
87.55
33.18
4.47
13.91
2.43
8.85
1.01
17.30
3.58
8.89
2.62
39,360
7.33
80,130
3.77
EOTR (TABLES ANNEX) - YEAR 2015 (4/5)
100.00
Provisional data
8. Evolution of year 2015: Number of guests, overnight stays and average stay
TOTAL
January
Number of guests
Number of overnight stays
Average
stay
Total
Total
Residents
Residents
Residents
Residents
in Spain
abroad
in Spain
abroad
3,222,266
2,685,551
536,716
8,746,210
6,620,289
2,125,921
2.71
2.60
107,614
96,902
10,712
279,609
224,902
54,707
February
143,951
129,875
14,076
325,866
256,223
69,642
2.26
March
193,821
172,064
21,757
442,557
349,870
92,687
2.28
April
286,997
245,348
41,649
730,343
582,482
147,861
2.54
May
278,539
218,202
60,337
634,190
445,420
188,770
2.28
June
275,920
216,601
59,320
663,013
458,489
204,524
2.40
July
365,161
288,336
76,825
1,176,557
826,720
349,837
3.22
August
478,574
387,756
90,819
1,852,391
1,416,893
435,498
3.87
September
304,411
228,135
76,276
771,195
517,637
253,558
2.53
October
318,805
266,037
52,767
751,345
567,174
184,172
2.36
November
202,162
185,881
16,281
449,760
376,725
73,035
2.22
December
266,311
250,414
15,897
669,384
597,754
71,630
2.51
9. Evolution of year 2015: Rural tourism lodgings open, estimated openings,
degree of occupancy and personnel employed
TOTAL
Nº of rural
Nº of
Level of occupancy*
Employed
open
vacancies* By vacancies By vacancies
By rooms
personnel*
estimated
at week
accom.*
end
15,305
142,994
16.56
29.45
20.03
21,971
January
14,111
126,328
7.12
12.94
9.30
18,999
February
14,243
128,972
9.00
21.34
11.52
19,385
March
14,796
136,251
10.45
24.61
13.04
20,679
April
15,588
146,582
16.53
34.40
19.73
22,438
May
15,688
148,501
13.72
27.40
16.60
23,025
June
15,830
150,160
14.66
29.65
17.62
23,524
July
16,011
152,212
24.75
35.85
29.15
24,323
August
16,026
152,811
38.54
44.59
45.38
24,691
September
15,894
150,556
16.99
31.26
20.65
23,702
October
15,691
148,195
16.29
31.17
19.83
22,971
November
14,999
138,929
10.76
27.33
13.59
19,922
December
14,783
136,435
15.76
28.10
19.23
19,997
* Annual average and weighted average per places or rooms
EOTR (TABLES ANNEX) - YEAR 2015 (5/5)
Provisional data
Tourist Accomodation Occupancy Survey
Hostels Occupancy Survey (HOS)
Year 2015
Provisional data
1. Travellers, overnight stays and average stay by Autonomous Cities and Communities
Autonomous cities and
communities
Travellers
Total
Residents
in Spain
Overnight stays
Total
Residents
in Spain
Residents
abroad
Residents
abroad
Average
stay
TOTAL
902,614
606,790
295,824
2,246,451
1,519,309
727,141
2.49
Andalucía
Aragón
Asturias, Principado de
Balears, Illes
Canarias
Cantabria
Castilla y León
Castilla - La Mancha
Cataluña
Comunitat Valenciana
Extremadura
Galicia
Madrid, Comunidad de
Murcia, Región de
Navarra, Comunidad For
País Vasco
Rioja, La
Ceuta
Melilla
Annual rate
117,088
27,215
5,165
13,530
52,129
34,514
351,430
91,824
10,570
5,817
29,625
25,704
115,853
4,565
0.51
94,638
25,343
3,547
12,204
44,122
32,362
186,979
53,189
9,932
5,069
22,449
16,958
81,104
4,446
-0.17
22,450
1,872
1,618
1,326
8,008
2,154
164,450
38,636
638
748
7,176
8,746
34,751
119
1.93
242,985
89,992
13,411
29,531
137,131
112,022
891,731
236,372
31,928
23,560
66,316
56,997
257,039
10,648
0.75
197,781
84,552
10,633
27,860
119,877
107,935
468,442
134,353
30,058
20,089
49,613
44,622
176,686
10,208
-1.94
45,204
5,439
2,778
1,671
17,253
4,089
423,288
102,019
1,869
3,471
16,703
12,377
80,353
439
6.89
2.08
3.31
2.60
2.18
2.63
3.25
2.54
2.57
3.02
4.05
2.24
2.22
2.22
2.33
0.24
2. Open establishments, capacity, occupancy and number of
staff by autonomous cities and communities
Autonomous cities and
Capacity
communities
Estimated
Estimated
open
bed-places*
establishments*
Occupancy rate
Of bed-places**
Of bed-places
at weekend**
Employed
personnel*
TOTAL
199
23,517
26.06
33.49
1,675
Andalucía
Aragón
Asturias, Principado de
Balears, Illes
Canarias
Cantabria
Castilla y León
Castilla - La Mancha
Cataluña
Comunitat Valenciana
Extremadura
Galicia
Madrid, Comunidad de
Murcia, Región de
Navarra, Comunidad For
País Vasco
Rioja, La
Ceuta
Melilla
Annual rate
15
18
3
8
23
23
39
12
9
4
6
9
20
6
0.17
3,168
1,511
257
438
2,140
2,265
6,200
2,014
732
490
526
751
2,456
254
-0.35
20.98
16.25
14.14
18.34
17.46
13.45
39.27
32.04
11.86
13.01
34.59
20.68
28.50
11.50
1.10
28.30
21.95
14.49
31.49
27.82
19.31
49.73
36.77
18.17
14.98
45.73
17.24
34.41
21.46
-1.62
197
82
35
26
157
104
387
137
49
39
160
55
192
12
-0.68
* Annual average.
** Weighted average per bed-places.
HOS (TABLES ANNEX) - YEAR 2015 (1/3)
Provisional data
3. Travellers and overnight stays by countries of residence
Countries
Travellers
Total
Overnight stays
%
Total
Average
stay
%
TOTAL
902,614
100.00
2,246,451
100.00
2.49
Residents in Spain
Residents abroad
TOTAL residents abroad
TOTAL residents in E.U. (excluding Spain)
- Germany
- Belgium
- France
- Italy
- Netherlands
- Portugal
- United Kingdom
Switzerland
Other European countries
United States of America
Other countries
606,790
295,824
295,824
201,540
33,194
8,173
59,715
30,241
11,151
7,519
26,006
3,916
40,213
16,843
58,846
67.23
32.77
100.00
68.13
11.22
2.76
20.19
10.22
3.77
2.54
8.79
1.32
13.59
5.69
19.89
1,519,309
727,141
727,141
495,192
82,135
19,710
141,741
75,157
29,704
15,940
65,687
9,153
99,684
46,324
141,907
67.63
32.37
100.00
68.10
11.30
2.71
19.49
10.34
4.09
2.19
9.03
1.26
13.71
6.37
19.52
2.50
2.46
2.46
2.46
2.47
2.41
2.37
2.49
2.66
2.12
2.53
2.34
2.48
2.75
2.41
HOS (TABLES ANNEX) - YEAR 2015 (2/3)
Provisional data
4. Evolution in the year 2015: guests, overnight stays and average stay
Months
Number of guests
Total
Residents
in Spain
Residents
abroad
Overnight stays
Total
Residents
in Spain
Residents
abroad
Average
stay
TOTAL
902,614
606,790
295,824
2,246,451
1,519,309
727,141
2.49
January
31,045
20,960
10,085
78,743
51,579
27,163
2.54
February
43,995
32,124
11,871
101,439
68,185
33,254
2.31
March
80,176
57,932
22,244
171,790
117,084
54,706
2.14
April
95,718
65,882
29,836
201,802
135,292
66,510
2.11
May
101,912
75,509
26,403
204,704
144,359
60,345
2.01
June
102,926
74,102
28,823
226,740
160,293
66,446
2.20
July
100,274
61,968
38,306
394,552
291,358
103,194
3.93
August
108,470
63,272
45,198
345,635
233,545
112,090
3.19
September
69,257
39,867
29,390
159,315
87,349
71,966
2.30
October
78,749
51,332
27,417
169,032
100,080
68,952
2.15
November
48,346
34,290
14,057
96,711
63,031
33,680
2.00
December
41,746
29,552
12,194
95,988
67,154
28,835
2.30
5. Evolution in the year 2015: establishments, capacity, occupancy
and employed personnel
Months
TOTAL
Employed
Occupancy rate
Capacity
Estimated
Estimated
Of bed-places** Of bed-places
personnel*
open
bed-places*
at weekend**
establishments*
199
23,517
16.51
24.34
1,675
January
165
19,715
12.88
15.13
1,342
February
181
21,336
16.98
24.23
1,397
March
198
23,532
23.55
31.52
1,631
April
210
25,059
26.84
38.00
1,699
May
215
25,962
25.43
30.78
1,741
June
223
26,894
28.10
37.79
1,988
July
237
28,063
45.35
50.05
2,328
August
221
26,034
42.83
44.83
1,961
September
198
23,455
22.64
32.22
1,708
October
197
22,408
24.33
33.87
1,507
November
179
20,986
15.36
27.82
1,394
December
166
18,755
16.51
24.34
1,405
* Annual average.
** Weighted average per bed-places.
HOS (TABLES ANNEX) - YEAR 2015 (3/3)
Provisional data
HOLIDAY DWELLING PRICE INDEX (HDPI)
Year 2015
Provisional data
Annual variation rate by rates
Annual
variation rate
4.23
2.82
4.01
5.39
TOTAL
Normal
Weekend
Tour-operators and travel agencies
Annual variation rate by modalities
Annual
variation rate
TOTAL
Studio
Dwellings 2/4 bedplaces
Dwellings 4/6 bedplaces
4.23
5.40
4.28
3.33
The Cumulative annual rates of HDPI, have been calculated as annual average rates of HDPI, weighted
per number of appartments of every month.
HDPI (ANNEX OF TABLES) - ANNUAL 2015
29th January 2016
Tourist Campsite Price Index (TCSPI). 2002 Base
Year 2015
Provisional data
National general index and breakdown by rates
Annual
variation rate
0.46
0.68
0.91
0.41
-0.03
TOTAL
Normal rate
Special rate for stays up to one month
Special rate for stays longer than one month
Tarifa bungalow*
National general index and breakdown by categories
Annual
variation rate
TOTAL
Luxury and first
Second
Third
0.46
-0.02
0.93
1.42
The Cumulative annual rates of TCSPI have been calculated as annual average rates of TCSPI ,
weighted per number of pitches of every month.
*2014 Base
TCSPI (ANNEX OF TABLES) - ANNUAL 2015
29th January 2015
Rural Tourism Accommodation Price Index (RTAPI)
Year 2015
Provisional data
Annual variation rates by Autonomous Cities
and Communities
Variation Rate
Annual
TOTAL
Andalucía
Aragón
Asturias, Principado de
Balears, Illes
Canarias
Cantabria
Castilla y León
Castilla - La Mancha
Cataluña
Comunitat Valenciana
Extremadura
Galicia
Madrid, Comunidad de
Murcia, Región de
Navarra, Comunidad Foral de
País Vasco
Rioja, La
Ceuta
Melilla
0.93
2.06
2.37
-0.04
0.73
-1.51
6.34
1.95
6.93
-4.35
1.54
2.34
0.86
0.20
-5.07
6.89
2.01
-6.93
-
Annual variation rate by rates
TOTAL
Normal
Weekend
Variation Rate
Annual
0.93
0.65
1.15
Annual variation rate rent modality
TOTAL
Shared use (in case of per room rent modality)
Full use (rent of entire dwelling)
Variation Rate
Annual
0.93
2.05
0.29
The Cumulative annual rates of RTPAI have been calculated as annual average rates of RTPAI
per number of rooms-establishments every month.
RTAPI (ANNEX OF TABLES) - ANNUAL 2015
29th January 2016
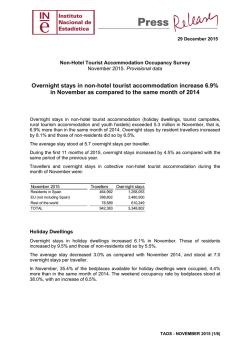


© Copyright 2026